









Pediatric assessment: Frameworks, tools, and clinical workflows
Pediatric assessment adjusts for age. Use the PAT for a 30-second read, then age...

Last Updated: August 18, 2026


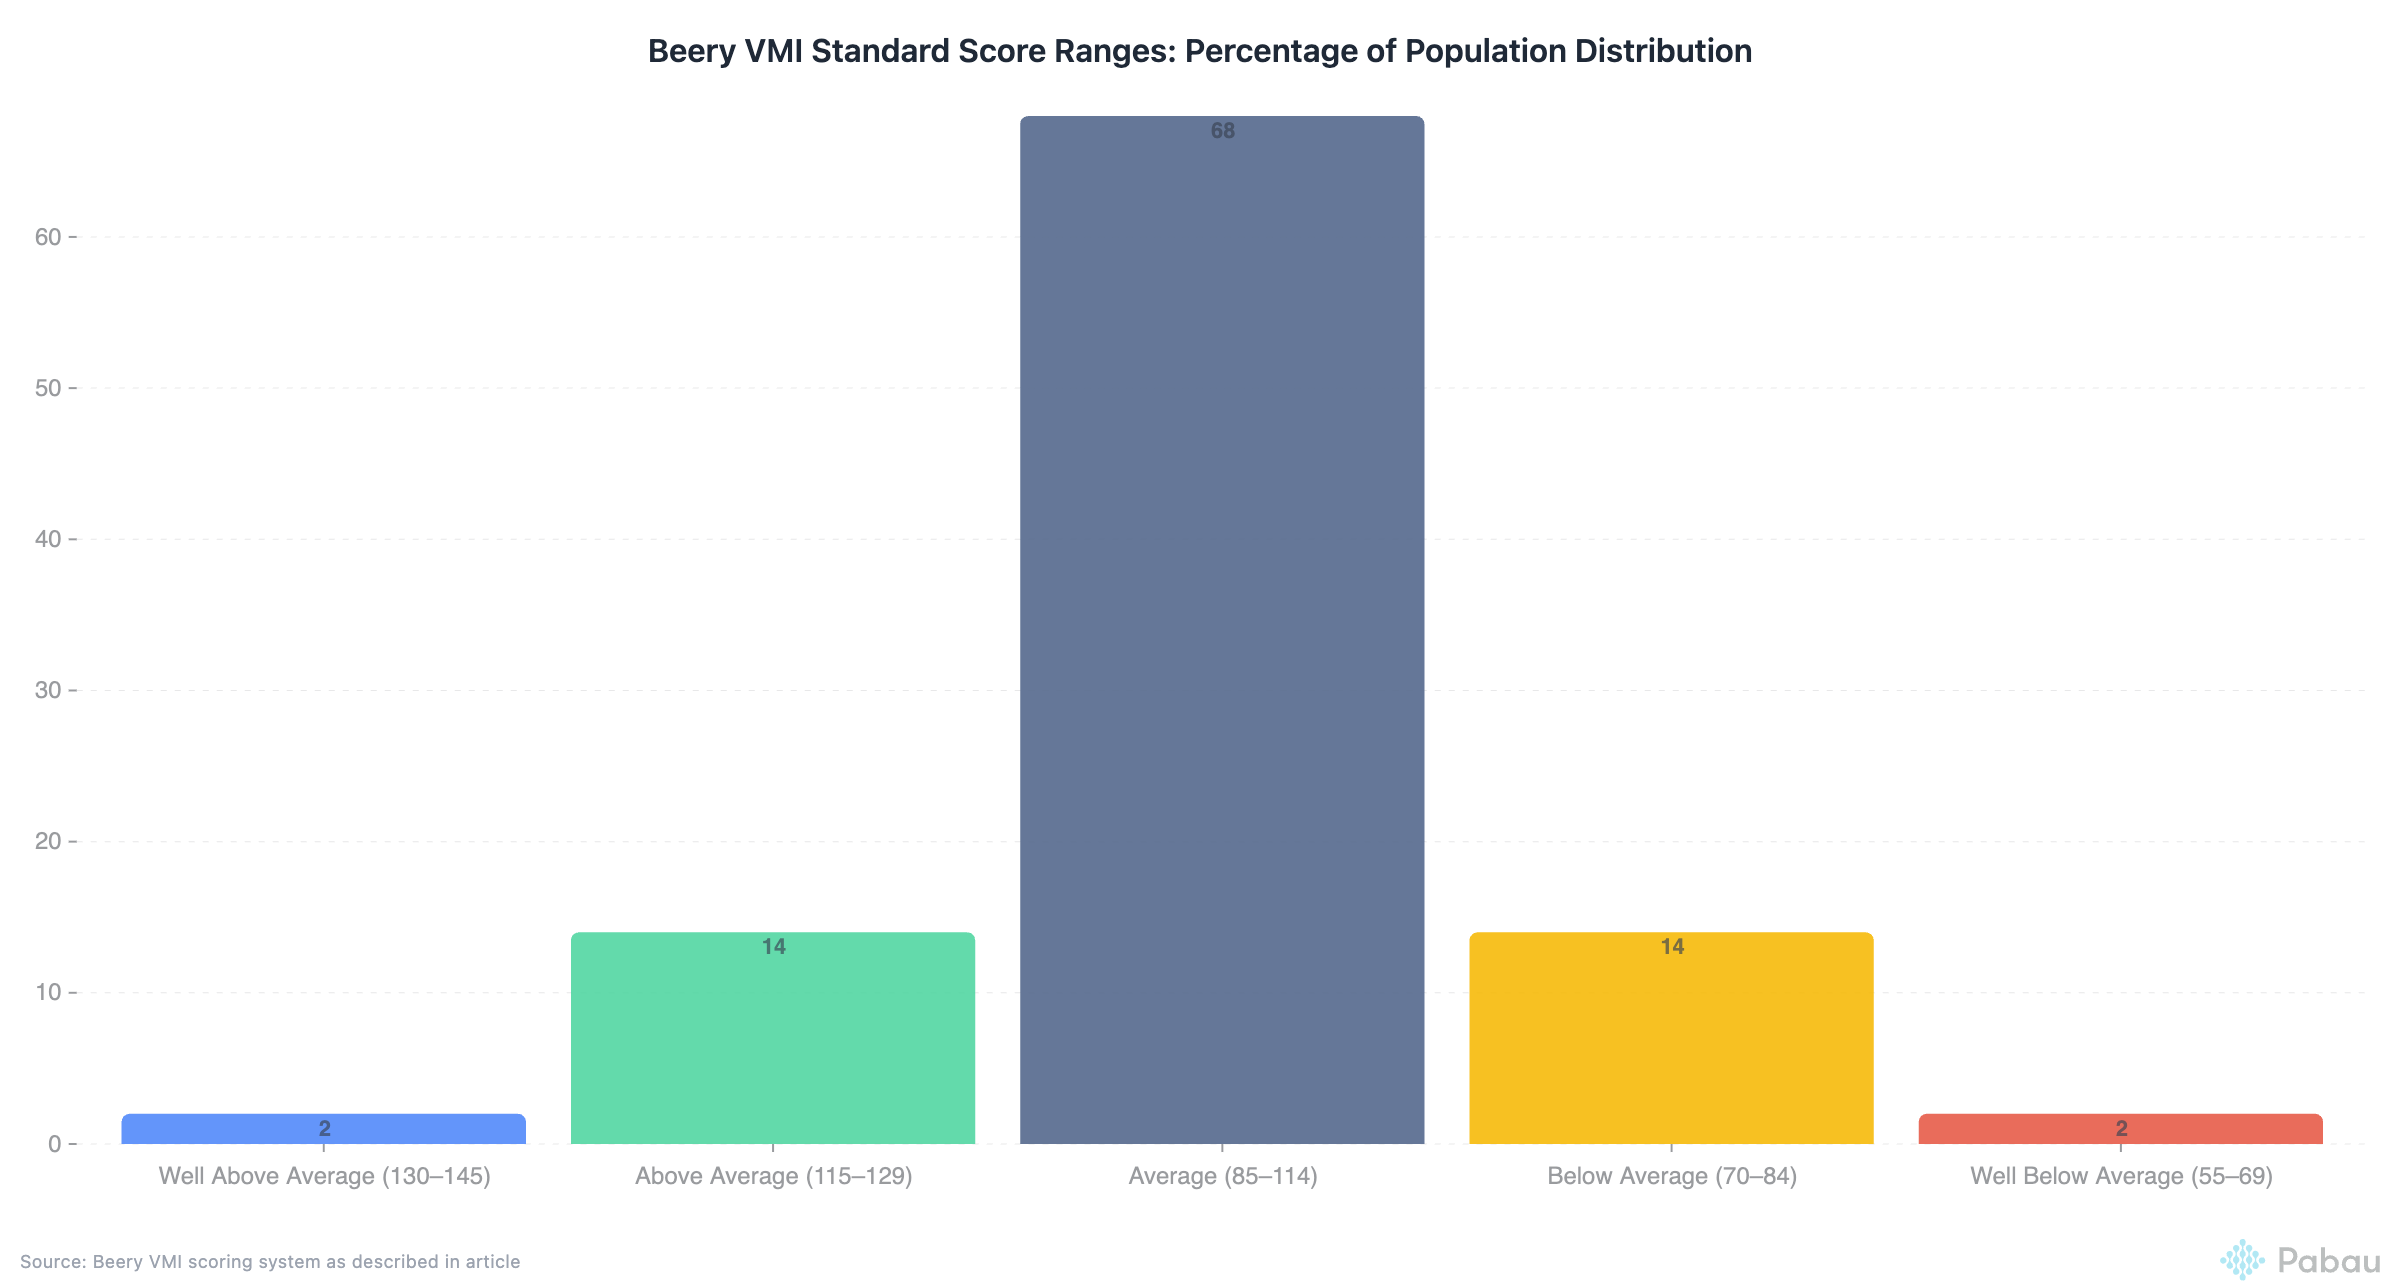
Beery VMI standard scores have a mean of 100 and a standard deviation of 15, so 90 to 109 is average.
A standard score under 85 falls below average, and under 70 marks significant impairment at roughly the 2nd percentile.
Percentile ranks translate the same result for parents and teachers, and the 16th percentile is the usual clinical cutoff.
Comparing VMI against the visual perception and motor coordination subtests shows which skill is driving the difficulty.
The decision table below maps each score pattern to a likely cause, an intervention focus, and report phrasing you can reuse.
The Beery VMI was never built to measure handwriting, so pair it with a functional handwriting measure.

A one-page reference with the standard score bands, matching percentiles, and the subtest discrepancy thresholds you check during scoring.
Beery VMI scoring interpretation runs on one scale: standard scores with a mean of 100 and a standard deviation of 15. A score of 90 to 109 is average. Below 85 is below average. Below 70 marks significant impairment, at roughly the 2nd percentile.
Beery VMI score interpretation gets clinically useful one step later, when you compare the three subtest scores against each other. A child at the 5th percentile with intact visual perception needs a different plan from one whose motor coordination is dragging the composite down.
About 1 in 6 US children aged 3 through 17 has a developmental disability, according to the CDC. Visual-motor deficits overlap heavily with ADHD, learning disorders, and coordination conditions in that group.
Below you’ll find the score-band table and a pattern-to-intervention decision table with report phrasing you can lift into a write-up. A worked example runs a real score triplet through it.
The Beery VMI assessment, formally the Beery-Buktenica Developmental Test of Visual-Motor Integration, measures how accurately a person copies geometric forms by hand. It pairs visual perception with fine motor output in a single task.
Occupational therapists administer it most often, alongside school psychologists and educational psychologists working referral questions about handwriting, copying, and written organization. Administration takes 5 to 10 minutes, which is why it survives in caseloads where testing time is scarce.
The Beery VMI consists of three distinct tests, and the supplemental two are what make pattern analysis possible:
Administer the supplemental tests in the same session where you can, but watch for fatigue. If a young child is flagging by the time you reach motor coordination, take a break and note it. Otherwise the MC score reads as a deficit it isn’t.
A visual-motor integration assessment measures how well someone converts what the eyes take in into a controlled hand movement. That is a narrower construct than most referral notes assume, and it is worth saying so in the report.
In day-to-day school terms, the skill is what lets a child do this:
Low visual-motor integration Beery scores correlate with academic difficulty in handwriting, in copying math problems, and in organizing written work. They do not, on their own, explain why the difficulty is there.
The Beery VMI age range runs from 2 years to 100 years on the 30-item Full Form. A 21-item Short Form covers ages 2 through 7, so preschool testing stays within a child’s attention span.
The sixth edition carries updated norms for ages 2 through 18, with adult norms from 19 upward. Check the Beery VMI age band before you read a standard score. Norm tables run in short age intervals for young children.
The manual also includes developmental “stepping stones” for gross motor, fine motor, and visual milestones from birth. Those are screening context, not scores, and they do not belong in the results table of a report.
Scoring moves through four numbers in order: raw score, standard score, percentile rank, and age equivalent. Only the standard score and percentile belong in your interpretation. The other two support it.
Raw scores are the count of correctly copied designs. The client earns one point per correct form, and testing stops after three consecutive failures. The Full Form maximum is 30.
Scoring criteria are strict, and each design has its own acceptable and unacceptable reproductions illustrated in the manual. Common losses include:
A raw score means nothing without an age. Fifteen correct forms is strong work for a 4-year-old and a concern for a 10-year-old.
Beery VMI score ranges follow the standard normal curve: a mean of 100, a standard deviation of 15, and average performance from 90 to 109. Each band below maps a Beery VMI score to its percentile and its descriptive label.
| Standard score | Percentile | Performance category | What it usually means for the plan |
|---|---|---|---|
| 130 and above | 98th and above | Very high | No visual-motor concern; look elsewhere for the referral question. |
| 120–129 | 91st–97th | High | A relative strength worth naming in the report. |
| 110–119 | 75th–90th | Above average | Solid skill; check subtest scatter before dismissing concerns. |
| 90–109 | 25th–73rd | Average | Typical performance; difficulties likely sit outside visual-motor skill. |
| 80–89 | 9th–23rd | Below average | Monitor, and intervene if classroom function is affected. |
| 70–79 | 2nd–8th | Low | Intervention is usually indicated, guided by the subtest pattern. |
| 69 and below | Below the 2nd | Very low | Significant impairment; consider a broader developmental evaluation. |
The percentiles above are the normal-curve equivalents of each standard score band. Report the exact percentile printed in the manual’s norm table for the client’s age, not the band figure.
The practical shorthand: 85 is the line where most services start paying attention, and 70 is the line where impairment is no longer arguable.
Beery VMI percentiles tell you what share of same-aged peers scored at or below your client’s score. A percentile of 9 means the child outperformed 9 percent of peers and trailed the other 91 percent.
These are the thresholds that carry decisions:
Percentiles are the number to lead with in a parent meeting. Standard deviations mean little to most families, while “better than 5 out of 100 children his age” lands immediately.
An age equivalent names the age group for which a raw score is average. A 10-year-old scoring like a typical 7-year-old has an age equivalent of 7 years.
Handle with care. Age equivalents explain a delay to a family in one sentence, and they mislead in four ways:
Use them to communicate, never to diagnose or to set an eligibility threshold.
The Beery VMI scoring manual supplies three things you cannot score without. Those are the item-by-item criteria, the illustrated pass and fail examples, and the age-banded norm tables.
Hand-scoring against those criteria matters more than it sounds. Two clinicians reading the same protocol can differ by several raw points on rotation and intersection judgments. For a young child, several raw points move the standard score across a whole band.
Keep the Beery VMI manual open beside the protocol rather than scoring from memory. If your service has more than one assessor, score a shared set of protocols together once a year to keep judgments aligned.
There is no authorized Beery VMI 6th edition scoring manual PDF. The manual is copyrighted and sold as part of the physical kit by Pearson, which is the only legitimate source.
Any free Beery VMI scoring PDF circulating on document-sharing sites is an unauthorized scan. Scoring from one carries two risks beyond the copyright question.
If your service shares one kit, the practical fix is a booked-out manual and a scanned internal crib sheet of your own band thresholds. That keeps scoring consistent without copying the norm tables.
Beery VMI interpretation is a two-step read. First place the composite in a band, then compare the three subtests to find out which skill is responsible for that band.
Each of the three scores answers a different question, so read them in sequence rather than as a set of results.
This is the primary score. It reflects the combined ability to perceive a form and reproduce it by hand. A low VMI score with intact subtests points at the coordination of the two skills, even when each one is adequate alone.
What low VMI tends to look like in class:
VP isolates visual analysis with the motor demand removed. A low score points to difficulty processing visual information, judging spatial relationships, or discriminating between similar forms.
MC isolates pencil control by asking the client to trace inside boundaries. A low score suggests motor planning or execution problems independent of visual processing. It is the score most sensitive to fine motor skills.
Read side by side, the two supplemental tests split the same presenting complaint in half:
| Visual perception (VP) | Motor coordination (MC) | |
|---|---|---|
| What it measures | Form matching with no pencil involved | Tracing inside boundaries with no form judgment required |
| Typical low-score presentation | Reverses letters, loses place when copying, misses detail in diagrams | Shaky lines, heavy pressure, awkward grip, hand fatigue after a few minutes |
| What a discrepancy suggests | VP well below MC points to a perceptual driver; visual-perceptual training first | MC well below VP points to a motor driver; fine motor and handwriting work first |
| Watch out for | Practice effects on repeat testing show up here first | Fatigue if MC is administered last in a long session |
The diagnostic power sits in the comparison between subtests. Clinicians commonly treat a difference of 12 or more standard score points, roughly 1 SD, as meaningful. Check the manual for the statistical threshold that applies to your client’s age band.
This table takes each pattern from a likely cause through to phrasing you can adapt in the report.
| Score pattern | Likely cause | Intervention focus | Suggested report phrasing |
|---|---|---|---|
| VMI low, VP and MC average | True integration deficit | Copying tasks, drawing to a model, construction and bilateral activities | “Visual perception and motor control are age-appropriate in isolation. Difficulty emerges when the two are combined.” |
| VMI low, VP low, MC average | Perception is driving the composite down | Form discrimination, spatial relations, figure-ground work | “Performance is limited by visual-perceptual processing rather than motor control.” |
| VMI low, MC low, VP average | Motor control is driving the composite down | Fine motor development, grip and pressure work, handwriting intervention | “Visual analysis is intact. Motor execution is limiting performance on paper-based tasks.” |
| All three low | Global or multi-domain delay | Multidisciplinary plan and broader developmental assessment | “Scores fall below the 2nd percentile across all three measures, consistent with a broader developmental picture.” |
| All three average or high | Visual-motor skill is not the issue | Redirect to attention, executive function, or language assessment | “Visual-motor skills are age-appropriate and do not account for the presenting concerns.” |
A true integration deficit. The child can see the form and can control the pencil, and loses accuracy the moment both demands arrive together. Intervention targets the combination, not either component.
Visual perception is the bottleneck and motor skills are adequate. Handwriting practice alone will disappoint everyone here, because the child is misreading the model before the pencil moves.
Motor coordination is limiting performance while visual processing holds up. This is the pattern where grip, pressure, and pre-writing work earn their place in the plan.
Global developmental delay or several deficit areas at once. Consider a broader neurodevelopmental assessment, since multi-domain delay can stem from underlying neurological conditions with their own diagnostic codes, such as ICD-10 code G07.
Visual-motor skills are not contributing to the presenting concern. Say so plainly in the report and redirect the referral toward attention, executive function, or language.
Take a school-age child referred for illegible handwriting, with standard scores of 58 on VMI, 74 on VP, and 73 on MC. Walk it through the table above.
The number that changes the plan here is the 15-point gap, not the 58. A composite that low with average subtests would produce a much narrower set of recommendations.
Diagnostic groups tend toward characteristic profiles. Treat these as hypotheses to test against the individual protocol, never as a shortcut to a diagnosis.
ADHD: scores are often lowered by impulsivity and inattention rather than by a genuine visual-motor deficit. ADHD is one of the most common referral populations for this test, which makes behavioral observation essential.
Developmental coordination disorder: typically low MC with relatively better VP, and a VMI score falling between the two.
Autism spectrum disorder: often a relative strength in VP compared with VMI and MC, with motor coordination the main area of difficulty.
Learning disabilities: patterns vary by the specific profile. Dysgraphia frequently shows MC below VMI below VP.
For infants and toddlers, an Alberta Infant Motor Scale template supports structured motor screening before the Beery VMI age range applies.
Standard scores record what a client achieved and say nothing about how they achieved it. Record the how while you watch, because you will not reconstruct it a week later. Modern client records systems let you store these notes beside the scores.
Attention and persistence:
Motor behaviors:
Visual behaviors and strategy:
These observations explain score patterns more often than the numbers do. Capturing them in your patient management software alongside the scores keeps the full picture in one place.
Not every administration produces a usable score. These are the threats worth checking before you write anything down:
An invalid score still belongs in the report, described rather than quoted as fact. Work through this checklist before you release it:
A usable sentence: “Results should be interpreted with caution, as sustained attention declined markedly after item 12 and are likely to underestimate current ability.”
This combination confuses referrers, and it is not a scoring error. The Beery VMI was never developed to assess handwriting ability, and evidence points to it being a poor screening indicator for handwriting dysfunction.
Research also suggests VMI scores are not sensitive to handwriting intervention progress. A child can improve legibility substantially while the standard score barely moves, which makes the test a weak progress measure.
Where handwriting is the actual referral question, pair the Beery VMI with a measure built for it. The Test of Handwriting Skills-Revised and the Minnesota Handwriting Assessment both target legibility and speed directly.
For a second read on the visual-motor construct itself, the DTVP-2 and the WRAVMA cover similar ground with different task demands. Using one of them alongside the Beery VMI helps you separate a genuine deficit from a test-specific result.
Match the intervention to the pattern, not to the composite. These are the four starting points that follow from the decision table above.
Low VMI with average VP and MC:
Low VP:
Low MC:
Global low scores:
Recording results in a shared practice management system keeps documentation consistent across the team. If you are still choosing a platform, a head-to-head such as Jane App vs SimplePractice is a useful reference point. Jane App alternatives covers tools built around assessment-driven planning.
Write for the person reading, and reuse the phrasing column from the decision table above so your wording stays consistent across a caseload.
To parents: lead with the percentile, add the standard score, and tie both to a task they recognize. “Jordan may struggle to copy math problems from the board” does more work than any number.
To teachers: skip the statistics and go straight to classroom implications and named accommodations. Describe what the difficulty looks like during a lesson.
To other professionals: lead with standard scores, include the subtest scatter, and state the differential you considered. If sharing reports is clunky in your current system, practices comparing alternatives to Carepatron often prioritize richer formatting and secure clinician-to-clinician sharing.
Documentation habits worth keeping:
Standardized forms keep multidisciplinary notes consistent. Even a nursing resource such as this diarrhea nursing care plan template shows how goal-linked documentation should be structured.
The Beery VMI identifies what is impaired. It does not tell you why, or what will fix it. Effective intervention needs four things:
Practices that also handle musculoskeletal referrals often standardize home programs the same way, using resources like these McKenzie method exercises to keep intervention plans consistent.
Whatever platform you use has to hold those functional measures over time. Practices weighing Semble competitors frequently cite longitudinal outcome tracking as the deciding factor.
Most services store Beery VMI results in three places at once. The protocol sits in a paper file and the standard scores go into a report on a shared drive. The re-assessment date lives in someone’s head or a spreadsheet.
Practice management software like Pabau puts all three in the client record. Scores, behavioral observations, the report you sent to the school, and the date the next administration falls due sit on one timeline you open mid-appointment.
That matters most at the 6 to 12 month re-test. Instead of chart-mining for last year’s numbers, you open the record. The previous standard scores sit next to the functional measures you tracked in between. The comparison takes seconds.
Digital forms collect intake and parent questionnaires before the session, so you spend the appointment testing rather than transcribing. Every subscription includes every feature, so a solo occupational therapist gets the same record and reporting tools as a multi-site service.


Pabau stores Beery VMI scores, behavioral observations, and the reports you share with families on a single client timeline. Re-assessment reminders fire automatically, so progress comparisons take seconds.

Treat the standard score as a starting hypothesis. Let the VMI, VP, and MC pattern, the percentile, and your qualitative observations decide what actually gets written into the plan.
The trade-off worth remembering is that this test is precise about a narrow construct. It will tell you which of three skills is failing, and it will not tell you whether handwriting is improving. Keep a functional measure running beside it.
Build that habit into how you approach managing your private practice and each assessment turns into an actionable plan. For a smaller setup, choosing the best EHR for solo practice is what keeps it sustainable.
Book a demo to see how clinicians document standardized assessments, share results with families, and track functional outcomes alongside Beery VMI scores.

How do you keep standardized assessments organized across years of treatment? Clinical documentation best practices – integrate Beery VMI results into comprehensive client records for evidence-based treatment planning.
Tired of manually tracking when re-assessment is due? Streamline assessment scheduling – automate reminders and track the 6-12 month intervals between Beery VMI administrations.
Need to share scores with parents and schools without emailing PDFs? Secure report sharing – send results through HIPAA-compliant client portals.
Still chasing paper intake forms before each assessment? Digital assessment forms – move intake to customizable digital forms that flow straight into the clinical record.
A normal Beery VMI score is a standard score between 90 and 109, which covers the middle 50 percent of same-aged peers. The wider average band runs from 85 to 115. Scores below 85 fall below average, and scores below 70 sit at roughly the 2nd percentile and indicate significant impairment.
No. The Beery VMI was not developed to assess handwriting ability, and evidence describes it as a poor indicator for screening handwriting dysfunction. It also appears insensitive to handwriting intervention progress. Use a functional measure such as the Test of Handwriting Skills-Revised or the Minnesota Handwriting Assessment when handwriting is the referral question.
Wait at least 6 to 12 months between administrations. That interval minimizes practice effects and allows time for developmental change or intervention response. For progress monitoring in between, use curriculum-based handwriting measures or functional task analysis rather than repeating the Beery VMI.
No. The Beery VMI is one component of a dysgraphia assessment and cannot diagnose it alone. A diagnosis needs handwriting samples, writing speed and fluency measures, fine motor assessment, orthographic coding, and language-based writing skills. A low motor coordination score supports the picture without being sufficient on its own.
Look outside visual-motor integration. Executive function, working memory, language-based writing difficulty, attention, or limited handwriting instruction can all produce this pattern. The Beery VMI measures copying geometric forms, not written language. Assess compositional writing, spelling, and written expression before settling on a cause.
Report both. Standard scores are the primary clinical metric and allow comparison across other standardized tests. Percentiles are far more intuitive for parents and teachers. Include age equivalents as supplementary context for families, never as the primary interpretive score.
A difference of 12 or more standard score points, roughly 1 SD, is treated as meaningful. VMI well below both VP and MC suggests a true integration deficit. VMI close to MC but below VP points to motor limits. VMI close to VP but below MC points to perceptual limits.
Yes, with caution. Children with ADHD often score lower because of impulsivity and inattention rather than a genuine visual-motor deficit. Behavioral observation is essential here. Consider testing under optimal conditions, with breaks and after medication, before treating a low score as a skill deficit.