
☰
- Calendar
- Online Booking
- Pabau Scribe
- Client Portal
- Forms & Charting
- Pabau Pay
- Telehealth
Core Features
Top picks

- Clients (EMR)
- Pabau Scribe
- Telehealth
- Memberships & Packages
- Measurement-based care
- Vaccines
- Forms & Charting
- Before & After Photo
- Aftercare
- Letters & Dictation
- Labs
- Prescriptions
Optimize Client Care
Clinical Excellence

- Team Management
- Commissions
- Timesheets
- Compliance
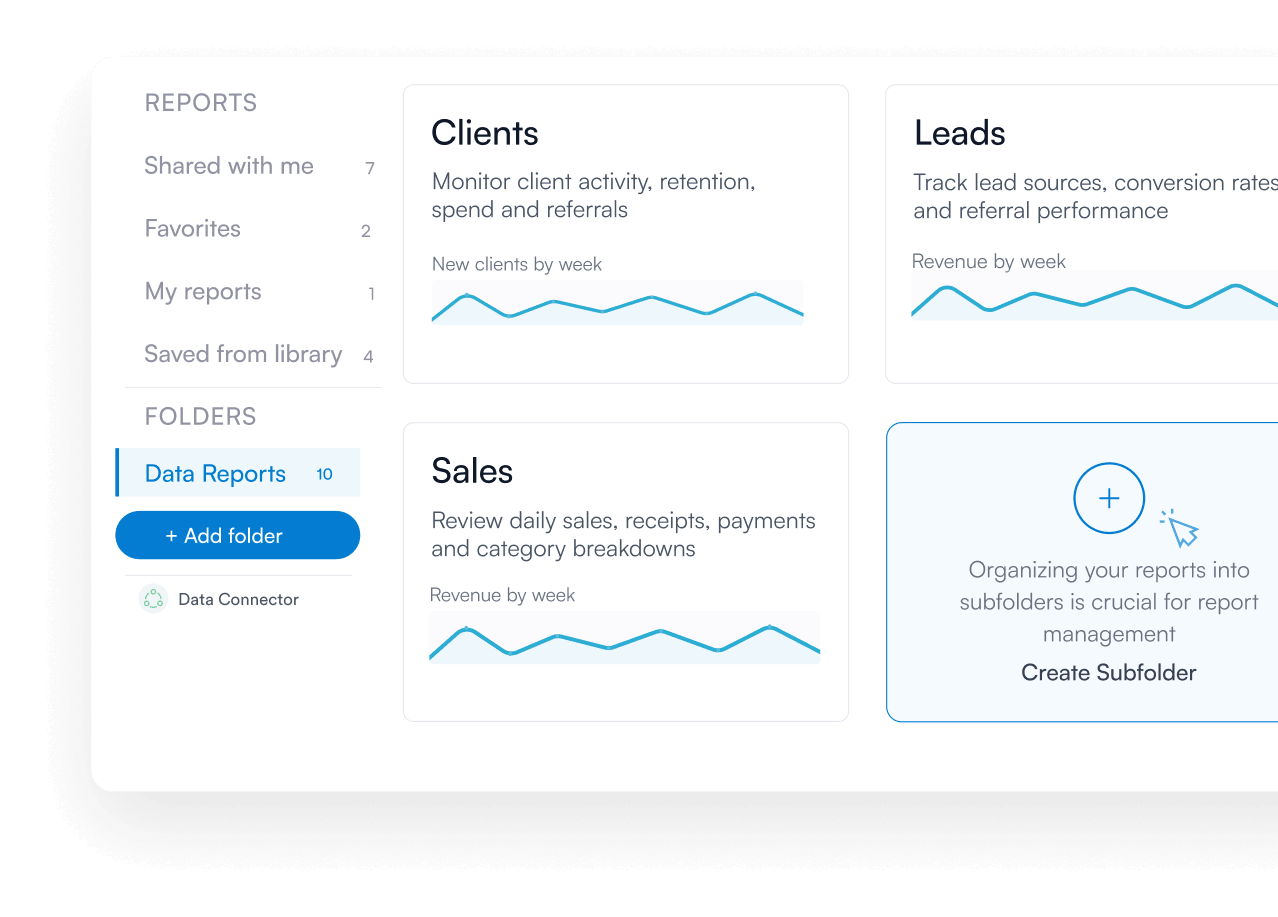
- Reporting
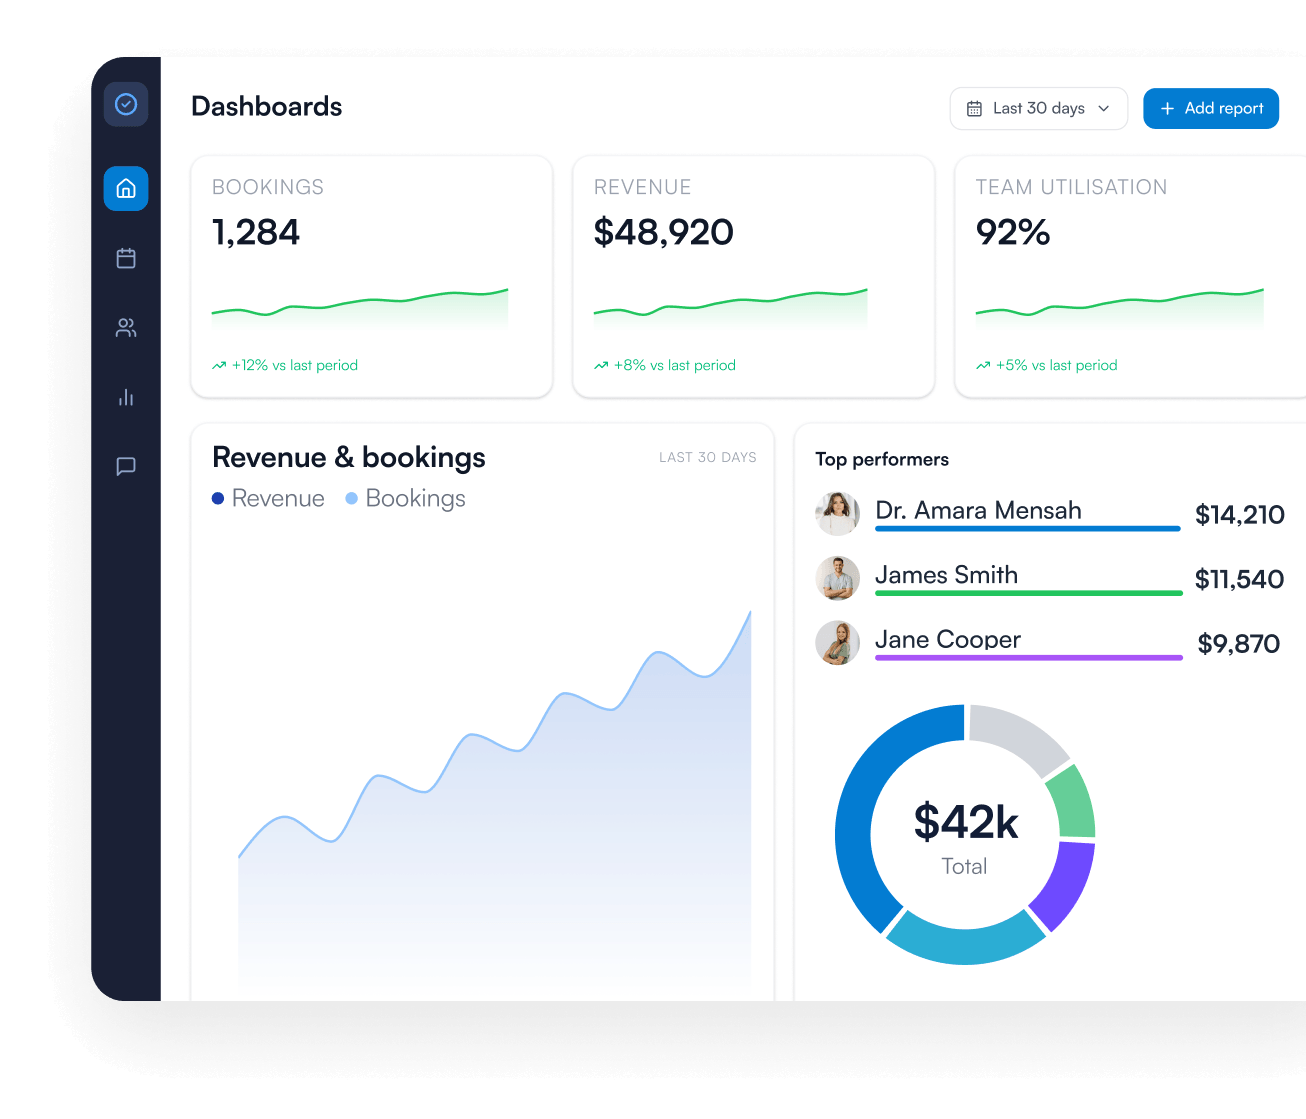
- Dashboards
- Inventory & Orders
Manage & Grow
Gain Insights
Stock

- Capture Forms
- Lead Management
- Campaigns
- Workflows
- Loyalty
- Gift Vouchers
- Offers & Discounts
- Reviews
- Referrals