


Wellness journal template
Download your free wellness journal template A comprehensive daily tracking temp...
July 15, 2026
Measuring patient engagement requires tracking both leading indicators (portal logins, recall response rates) and lagging indicators (retention rate, health outcomes) together.
The Patient Retention Rate formula – [(end patients minus new patients) divided by starting patients] times 100 – gives private practices a concrete baseline metric.
No-show rates above 10-15% signal a breakdown in engagement long before revenue losses appear in your accounts.
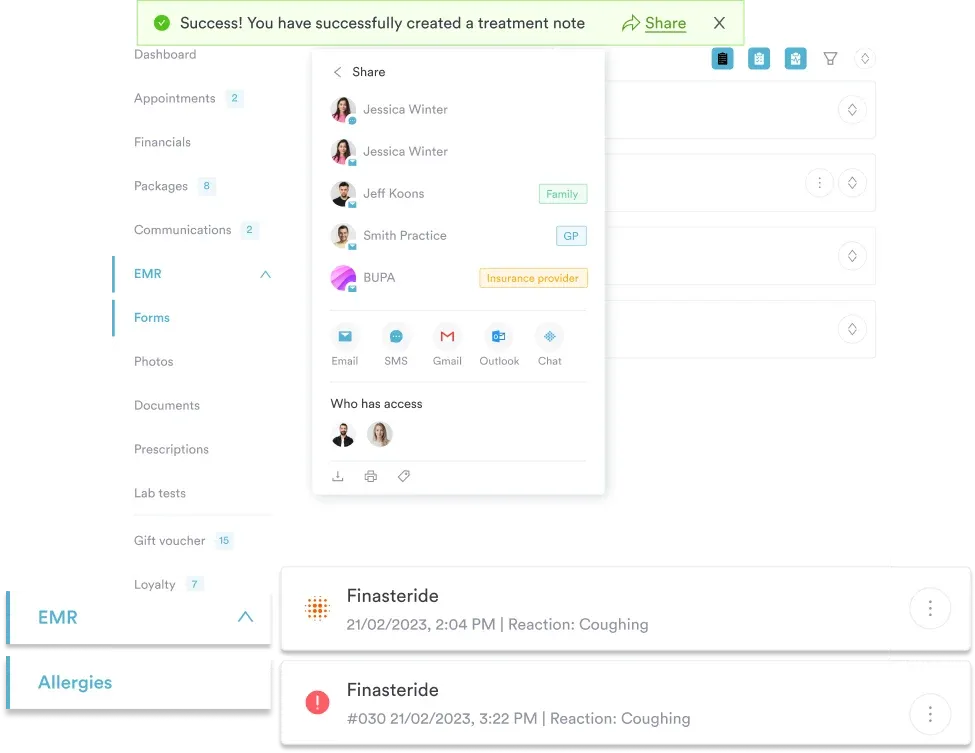
Pabau’s Insights Plus dashboard surfaces engagement metrics automatically, replacing manual spreadsheet tracking with real-time clinic data.
Most clinic owners discover a patient engagement problem the same way: revenue plateaus, recall lists go stale, and the waiting room is full of first-time visitors who never return for a second appointment. By the time the problem is visible in the numbers, months of disengagement have already passed. Measuring patient engagement before the warning signs appear is the only way to intervene early. This guide covers the specific metrics, validated tools, and practice management workflows that private clinics use to build a reliable picture of how engaged their patients actually are.
If you want the groundwork first, our explainer on the fundamentals of patient engagement covers what you are actually measuring here.
Standard practice reports tell you what happened. Appointment volumes, invoiced revenue, treatment counts. What they rarely tell you is why patients stopped coming back, whether patients followed their post-care instructions, or how likely a satisfied patient is to refer a friend. Measuring patient engagement with the help of best patient engagement software fills that gap. It shifts the focus from transactions to behaviour, and from outputs to outcomes.
The challenge is that the healthcare industry has not agreed on a single standard approach. As of 2022, at least 15 frameworks and conceptual models existed to measure the impact of patient engagement, with only 4 of them including specific metrics for demonstrating value. For private clinics, most of these frameworks were designed for hospitals or pharmaceutical research, not for a 5-practitioner aesthetics or physiotherapy practice. The practical answer is a smaller, clinic-specific metric set that connects engagement data directly to retention and revenue. Start by improving patient engagement systematically, and measurement becomes the diagnostic tool that tells you what is working.
| Metric Type | What It Measures | When It Signals a Problem |
|---|---|---|
| Patient Retention Rate (PRR) | Percentage of patients who return | Below 43% over 5 years (industry estimate) |
| No-show Rate | Missed appointments as % of scheduled | Above 10-15% |
| Portal Login Rate | Active patient portal usage | Below 30% of active patients |
| Recall Response Rate | Patients who rebook after a recall message | Below 25% within 14 days |
| NPS Score | Likelihood to recommend the practice | Score below 50 |
Patient engagement metrics split into two categories that serve different diagnostic purposes. Leading indicators tell you what is likely to happen. Lagging indicators confirm what already happened. Relying only on lagging data means responding to problems weeks or months too late.
Leading indicators include patient portal logins, recall message open rates, pre-appointment form completion rates, and responses to post-care instructions. A drop in portal logins this week predicts an increase in no-shows next month. A recall campaign with a 12% open rate tells you the messaging or timing needs adjustment before the recall period closes. Tracking patient compliance with pre-appointment instructions is one of the most underused leading indicators in private practice, yet it correlates directly with treatment outcomes and repeat bookings.
Lagging indicators confirm trends that leading indicators predicted. Patient retention rate, net promoter score, average appointment frequency per patient, and treatment outcome measures all fall here. They are valuable for benchmarking and reporting, but by the time they decline, the disengagement has already occurred.
A well-designed engagement monitoring system tracks both. Leading indicators drive weekly operational decisions. Lagging indicators inform quarterly strategy and resource allocation.
The Patient Retention Rate formula is: [(End-of-period patients – New patients) / Start-of-period patients] x 100. A practice that started the year with 275 patients, ended with 300, and acquired 170 new patients has a PRR of 47.27%. Industry data cited by InteliChart suggests the average 5-year new patient retention rate is approximately 43%, though this figure varies significantly by specialty and practice model. Use your PRR as a baseline, then track it quarterly to identify trends rather than treating any single number as a pass/fail threshold.
A falling PRR is your cue to act before clients drift away, and tactics like mobile rewards to drive retention can pull the number back up.
No-show rate is total missed appointments divided by total scheduled appointments, expressed as a percentage. For most private clinics, a rate above 10-15% indicates a structural engagement problem, not just scheduling friction. Common drivers include poor pre-appointment communication, long gaps between booking and appointment date, and no active recall system. The intervention is operational: automated reminders, deposit policies, and a structured follow-up sequence after each missed appointment. If you want to reduce your no-show rate, the first step is calculating where you currently stand across each practitioner and service type, not just as a practice average.
Net Promoter Score asks a single question: “How likely are you to recommend us to a friend or colleague?” on a 0-10 scale. Scores of 9-10 are promoters, 7-8 are passives, and 0-6 are detractors. NPS = % promoters – % detractors. Healthcare NPS benchmarks vary widely by specialty, but a score above 50 is generally considered strong. The AHRQ’s Consumer Assessment of Healthcare Providers and Systems (CAHPS) survey framework provides a more comprehensive alternative to NPS for practices that want to measure specific service touchpoints rather than overall sentiment. For measuring patient satisfaction at the individual appointment level, a 3-question post-visit survey sent via SMS within 2 hours of discharge yields the highest response rates.
Portal login frequency, form completion rates, and two-way message volumes all indicate how actively patients are engaging between appointments. A patient who books online, completes digital intake forms in advance, and responds to recall messages is demonstrably more engaged than one who requires a phone call for every interaction. Patient portal adoption rates typically range from 20-50% in private practices, with higher rates correlating with younger patient demographics and strong staff encouragement at point of booking. Track these metrics broken down by patient cohort (new vs returning, by age group, by service type) for the most actionable data.
Run a monthly cohort comparison: compare portal login rates for patients who received a post-booking confirmation SMS against those who only received an email. The channel that drives higher portal activation tells you where to invest your recall and communication workflows.
Beyond operational metrics, two validated psychometric instruments are worth understanding for practices that want to assess engagement at the individual patient level.
The Patient Activation Measure (PAM), developed by Judith Hibbard at the University of Oregon and originally commercialised by Insignia Health (now licensed exclusively through Phreesia, which acquired Insignia Health in December 2021), assesses how prepared and confident patients are to manage their own health. It produces a score from 0 to 100 across four levels of activation, from passive reliance on providers to proactive self-management. PAM has strong peer-reviewed validity and is used widely in chronic disease management programmes. Practices managing long-term conditions such as diabetes, hypertension, or weight management can use PAM scores to segment patients by activation level and tailor their communication and care planning accordingly. Sound patient care management frameworks increasingly use PAM to stratify clinical outreach, focusing intensive support on low-activation patients who are most at risk of disengagement.
The Patient Health Engagement Scale (PHE-scale), described in a peer-reviewed study published via PMC (PMCID: PMC4376060), was developed using rigorous psychometric methods grounded in the PHE-model of patient engagement. It measures engagement as a psychological state, capturing how patients move from blackout (passive, disconnected) through arousal and adhesion to eudaimonic project (fully engaged, health as a personal goal). Unlike PAM, which focuses on activation, PHE-scale addresses emotional and motivational dimensions of engagement. For mental health, chronic care, and rehabilitation practices, this distinction matters practically: a patient may have high knowledge of their condition (suggesting activation) but low emotional investment in managing it (suggesting low PHE-scale score).
Pabau's Insights Plus dashboard gives clinic owners real-time data on recall response rates, no-show trends, patient retention, and portal usage, without building a single spreadsheet. Book a demo to see the reporting workflows that replace manual tracking.

Validated tools and metric definitions are only useful when embedded in a repeatable operational workflow. Here is a five-step process that private clinics can implement without a dedicated data analyst.
The same appointment scheduling data from your patient scheduling and appointment management system that drives your daily diary also contains your richest source of engagement signals: booking lead times, cancellation patterns, rebook rates after treatment, and the gap between end of a course of treatment and the next booking. Most clinics have this data sitting unused in their practice management system.
Manual spreadsheet tracking of engagement metrics is sustainable for a solo practitioner seeing 20 patients per week. For any practice beyond that scale, the data collection burden becomes a reason to stop measuring altogether. Practice management software that captures engagement signals automatically removes that barrier.
Set a quarterly engagement review calendar reminder now. Block 90 minutes each quarter to review PRR, no-show rate trends, NPS by practitioner, and recall response rates. Compare against the prior quarter and the same quarter last year. Patterns only become visible when you look at three or more data points in sequence.
Pabau’s Insights Plus reporting module centralises the key engagement metrics covered in this guide. Recall response rates, no-show trends, portal login frequency, and patient retention data are surfaced in a single dashboard without requiring manual exports or formula-based spreadsheets. For clinic owners who want to act on engagement data rather than spend time compiling it, this is the operational difference between a metric that drives decisions and one that sits in a report nobody reads.
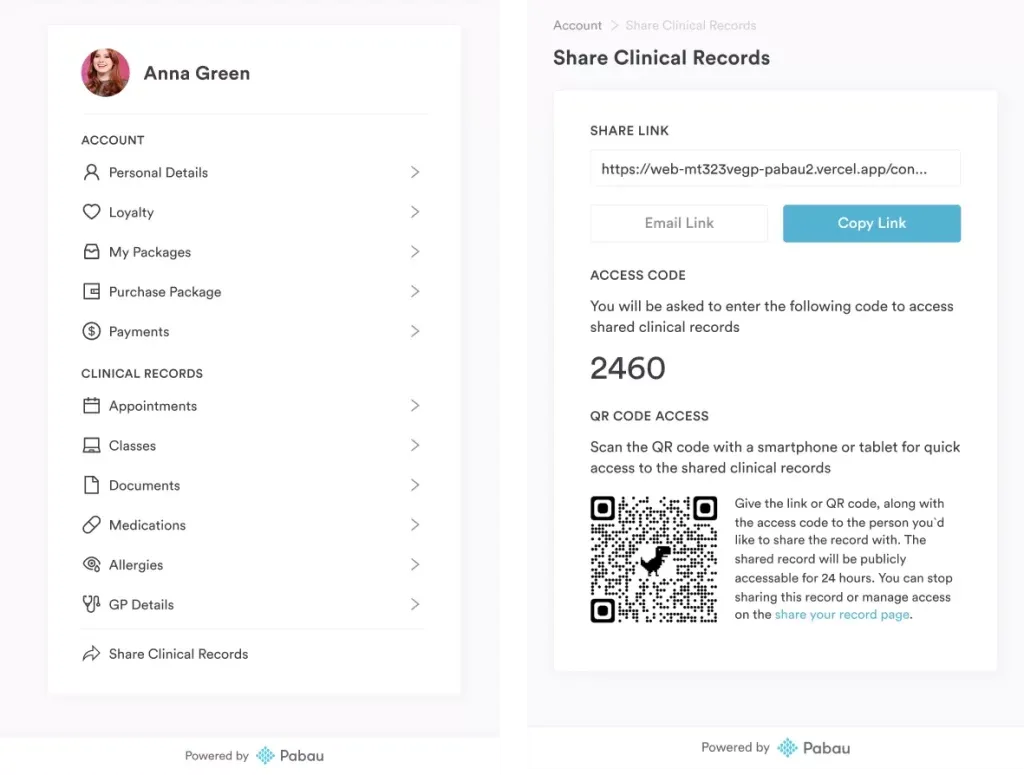
Data privacy is a non-negotiable constraint on any engagement tracking system. Under HIPAA in the US and GDPR in the UK and EU, patient engagement data is protected health information when linked to identifiable individuals. Any practice management platform used to track engagement metrics must be compliant with the relevant framework for your jurisdiction. Pabau operates under both HIPAA and GDPR frameworks, with data stored and processed according to those requirements. Compliance is not a feature to add later; it is a precondition for tracking engagement data at all. Review your obligations with our GDPR compliance checklist if you operate in the UK or EU.
Want a framework for turning engagement data into retention actions? Improve Patient Engagement covers the practical interventions that follow from measuring engagement metrics, with specific workflows for lapsed and at-risk patient cohorts.
Need to understand what satisfied patients actually look like? Measuring Patient Satisfaction breaks down survey design, NPS calculation, and how to benchmark satisfaction scores across practitioners.
Looking for the complete guide to patient-facing digital tools? Benefits of Patient Portals explains how portal adoption rates connect to engagement metrics and what drives patients to use self-service tools consistently.
Patient disengagement does not announce itself. It shows up gradually in retention rates, recall non-responses, and the slow drift of lapsed patients off your active list. Measuring patient engagement consistently, using a combination of leading indicators, validated tools like PAM and PHE-scale, and operational metrics built into your practice management system, is the difference between reacting to problems and preventing them.
Pabau’s Insights Plus module gives clinic owners an always-on view of the metrics that matter most, without manual data work. If your current system requires a spreadsheet to answer “what is our retention rate this quarter?”, it is time to change the system. See how Pabau’s patient experience management tools work in practice, or book a demo to walk through the reporting dashboard with a specialist.
Track a combination of leading indicators (portal logins, recall response rates, form completion rates) and lagging indicators (patient retention rate, NPS, appointment frequency). Calculate your Patient Retention Rate using the formula [(end patients – new patients) / start patients] x 100, and review no-show rates and recall response rates weekly. Leading indicators let you intervene before retention problems become visible in revenue data.
PAM is a validated psychometric tool developed by Judith Hibbard at the University of Oregon that scores patients on a 0-100 scale across four activation levels, from passive reliance on providers to proactive self-management. It is particularly useful in chronic disease management, where segmenting patients by activation level allows practices to target intensive support at patients most at risk of disengagement or poor health outcomes.
Industry data suggests an average 5-year new patient retention rate of approximately 43%, though this varies considerably by specialty, patient demographics, and whether the practice offers ongoing chronic care or episodic treatment. Aesthetic and elective treatment practices typically see lower baseline retention than GP or physiotherapy practices, so benchmarking against your own specialty cohort is more useful than applying a single universal figure.
Higher patient activation, as measured by PAM, correlates with better adherence to treatment plans, lower emergency care utilisation, and improved management of chronic conditions. The PHE-scale research published in PMC (PMCID: PMC4376060) shows that patients in higher engagement states have better quality-of-life outcomes. For private clinics, this translates practically: engaged patients complete treatment courses, follow post-care protocols, and return for maintenance appointments, all of which improve both outcomes and practice revenue.
Predictive analytics tools can flag patients at risk of disengagement before they lapse, using signals like appointment cancellation patterns, declining portal login frequency, and recall non-response. The practical application for most private clinics is not bespoke AI modelling but rather configuring your practice management system to surface these signals automatically, such as flagging patients who have not responded to two consecutive recall messages for a personal outreach call.