


Body scan meditation script
Below is the ready-to-use template, followed by the clinical background and five...
July 23, 2026
A daily mood chart is a structured tool that helps mental health practitioners document and track emotional patterns, symptom severity, and mood episodes in real time.
Mood tracking supports diagnosis of bipolar disorder, depression, and anxiety by revealing patterns that may not be obvious in single appointments.
The NIMH Life Chart Method and STABLE Resource Toolkit are evidence-based approaches to daily mood monitoring that clinicians can adapt for their practice.
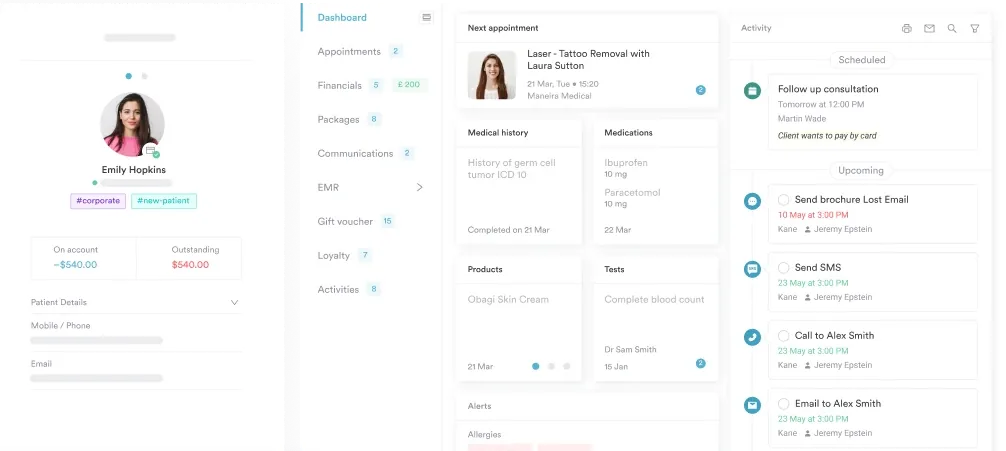
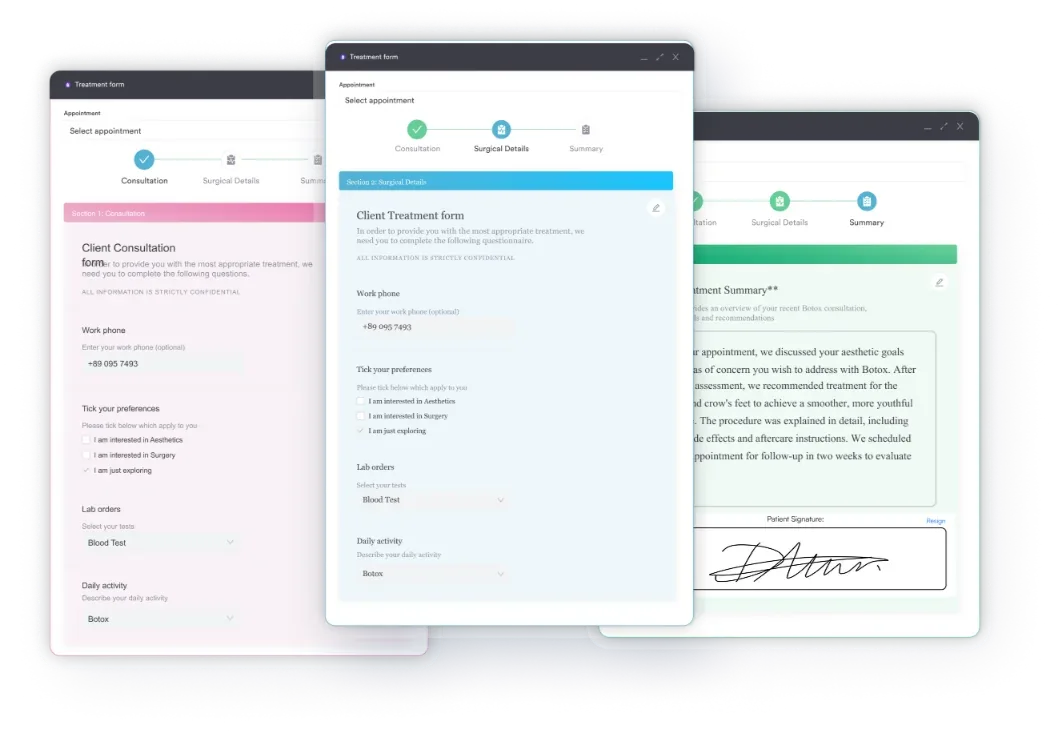
Pabau’s digital forms and client records integrate mood chart data directly into treatment planning and progress notes, streamlining documentation workflow.
Daily mood chart
A ready-to-use mood tracking form for mental health practitioners. This template provides structured daily mood rating scales, space for documenting mood severity, energy levels, sleep quality, and relevant clinical observations to support therapeutic assessment and treatment planning.
Download templateWeekly sessions only capture a snapshot. A daily mood chart fills in the days between appointments, so patterns like a sleep drop before a manic swing or a midweek dip after a stressor surface in the data instead of getting lost to recall. This guide shows how to put daily mood charting to work in your psychiatry practice, condition by condition, and what to record so the chart earns its place in the clinical record.
A daily mood chart is a self-report tracking tool where patients document their emotional state each day, typically on a numerical scale (1-10) or categorical system (depressed, neutral, elevated, manic). The tool captures mood severity, duration, and associated factors like sleep, energy, and life events that may trigger mood shifts.
The National Institute of Mental Health (NIMH) Life Chart Method uses daily ratings that specify both polarity and severity, the gold-standard approach for bipolar disorder monitoring. Recording those ratings in mental health practice software keeps the observations structured and cuts the documentation burden of free-text notes.
Mood charting works when patients get clear instructions and the data flows into your clinical assessments. These five steps set up a mood-tracking protocol patients will actually stick with:
Any mental health clinician working with mood disorders benefits from structured mood tracking. Psychiatrists, psychologists, therapists, and counselors use mood charts across specialties:
Structured mood charting delivers measurable clinical and operational benefits:
Early pattern recognition: Daily data reveals mood cycles and triggers faster than weekly check-ins, so you spot relapse risk before a crisis occurs.
Treatment efficacy assessment: Mood charts give an objective baseline-to-endpoint comparison for medication trials and therapy outcomes. Structured client records let you document trends quantitatively rather than relying on recall.
Patient engagement: Collaborative mood review strengthens the therapeutic alliance. Patients feel heard and see concrete evidence of progress, and shared data review is one of the patient engagement strategies that lifts treatment adherence.
Reduced clinician burden: Digital mood tracking integrates directly into your EMR, so there is no manual data entry or transcription errors. Digital forms for mental health intake capture mood data automatically and populate your progress notes, cutting documentation time.
Mood chart design adapts to the condition being monitored. Bipolar tracking differs from depression or anxiety monitoring.
Bipolar disorder: The chart emphasizes polarity (depressed, euthymic, elevated, manic) on a severity scale (-3 to +3, or 1-10). Capture sleep reduction, since decreased sleep can precede mania even without low mood, and track medication adherence.
Depression (MDD): Focus the chart on mood severity and anhedonia (loss of pleasure). Include energy, sleep, and appetite, since these often co-vary with low mood. Track antidepressant response by comparing baseline mood to post-treatment ratings.
Anxiety disorders: Chart anxiety severity alongside mood, plus triggers (social situations, work stress, health concerns) and avoidance behaviors. This links mood fluctuations to anxiety cycles and informs exposure-based treatment plans.
For ADHD and other ADHD clinic management software users, mood charts document emotional dysregulation patterns separately from inattention or hyperactivity, clarifying the full clinical picture and guiding multimodal treatment.
Two evidence-based frameworks have become standard in mental health practice:
NIMH Life Chart Method (NIMH-LCM): Developed by the National Institute of Mental Health for bipolar disorder research, this method uses prospective daily mood ratings with polarity and severity specifications. It is widely regarded as the gold standard for bipolar monitoring and has been validated in clinical research.
STABLE Resource Toolkit: The STABLE (Standards for Bipolar Excellence) approach pairs mood tracking with treatment planning for bipolar disorder. It emphasizes regular review of mood charts alongside medication and lifestyle variables, supporting holistic assessment.
Both methods adapt well to digital therapy practice management systems where mood data feeds directly into progress notes and clinical dashboards, cutting manual transcription and supporting real-time treatment decisions.
Mood charting has to fit your existing workflow, not sit beside it as an add-on. Patients drop off when tracking feels like bureaucracy instead of care.
Practices focused on clinician burnout prevention often find that automating mood tracking trims documentation time, freeing clinicians for deeper therapeutic work.
Paper mood charts are portable and familiar, but digital tracking adds automated reminders, data visualization (trend graphs), searchability, and integration into the electronic health record.
A Black Dog Institute daily mood chart (PDF) is a fine option for practices without EHR integration, though digital systems reduce transcription errors and prompt patients automatically.
See how Pabau, an all-in-one practice management system, brings digital forms, client records, and automated workflows together so mood tracking lives in the clinical record. Book a demo to explore how structured mood charting reduces documentation time while improving treatment outcomes.
A daily mood chart is a structured self-report tool where patients record their emotional state daily, typically on a 1-10 scale or categorical system (depressed, neutral, elevated, manic). It captures mood severity, associated factors (sleep, energy, events), and supports diagnosis, treatment monitoring, and outcome tracking.
Explain the clinical purpose in your first session: “This chart helps me understand your mood patterns and see how treatment is working.” Provide a printable template or digital link. Set a consistent daily time (morning or evening) for completion. Send automated reminders via text or email to improve compliance.
Bipolar disorder, major depressive disorder, and anxiety disorders benefit most. Mood charting helps identify manic/hypomanic episodes early, track antidepressant response, and link anxiety spikes to specific triggers. ADHD clinics also use mood charts to distinguish emotional dysregulation from other symptoms.
A bipolar mood chart tracks daily mood on a polarity scale (depressed, euthymic, elevated, manic) rather than a single low-to-high line, plus sleep hours, medication adherence, and any triggers. Falling sleep is worth flagging on its own, since it can precede a manic swing even before mood lifts.
Most clinicians use a simple 1-10 daily mood scale or a categorical rating (depressed, neutral, elevated). For bipolar monitoring, a -3 to +3 polarity scale captures both depressive and manic direction. Pick one scale and keep it consistent so ratings stay comparable week to week.
A single filled-in entry might read: mood 4/10, slept 5 hours, took medication, work-deadline stressor. Over a week, those rows expose patterns, such as ratings dropping below 5 on days following poor sleep, that a single appointment would miss.
Collaborative review every session (1-3 minutes) maximizes therapeutic value. Ask what patterns the patient notices, connect mood shifts to life events or treatment changes, and document key findings in your progress notes to track treatment response over time.
Digital charts offer automated reminders, data visualization, and EHR integration, improving compliance and reducing transcription errors. Paper charts remain an accessible option for practices without software integration, though they require manual review and documentation.