Massage Gift Card Template
A massage gift card template is a fill-in-the-blank certificate you customize wi...

19
Last Updated: Sep 11, 2026

A basal body temperature (BBT) pregnancy chart tracks your resting body temperature across your menstrual cycle to identify ovulation and potential early pregnancy signs.
BBT rises approximately 0.2°C (0.4°F) after ovulation due to progesterone; a sustained rise for 18+ days without menstruation may indicate pregnancy.
Biphasic BBT charts show two distinct phases; triphasic patterns (a third rise in the luteal phase) appear in some early pregnancies but are not diagnostic.
BBT charting alone cannot diagnose pregnancy – a clinical pregnancy test is required; this template supports fertility awareness and clinical decision-making, not diagnosis.
A comprehensive basal body temperature charting template that helps track ovulation, confirm pregnancy, and support fertility planning. Includes biphasic and triphasic pattern guidance with both Celsius and Fahrenheit temperature scales.
Download templateTrying to conceive or investigating a cycle irregularity often starts with a single question: did ovulation happen this month? A basal body temperature (BBT) pregnancy chart answers that by tracking small daily shifts in resting temperature across a cycle.
Fertility specialists, gynecologists, and patients themselves use the resulting pattern to confirm ovulation, estimate a fertile window, and flag early signs worth discussing at an appointment. The free template below gives you a ready-to-use chart in both Celsius and Fahrenheit, and the sections that follow explain how to read the results.
A BBT pregnancy chart is a structured tracking tool that records your basal body temperature (your resting temperature taken immediately upon waking) each morning throughout your menstrual cycle. This chart documents the temperature shifts that occur as your body’s hormone levels change, helping you identify ovulation timing and observe patterns that may correlate with early pregnancy.
Basal body temperature shifts are driven by progesterone, a hormone released after ovulation. In a typical cycle, your temperature remains relatively low during the follicular phase (dominated by estrogen), then rises after ovulation by approximately 0.2°C (0.4°F) and stays elevated throughout the luteal phase.
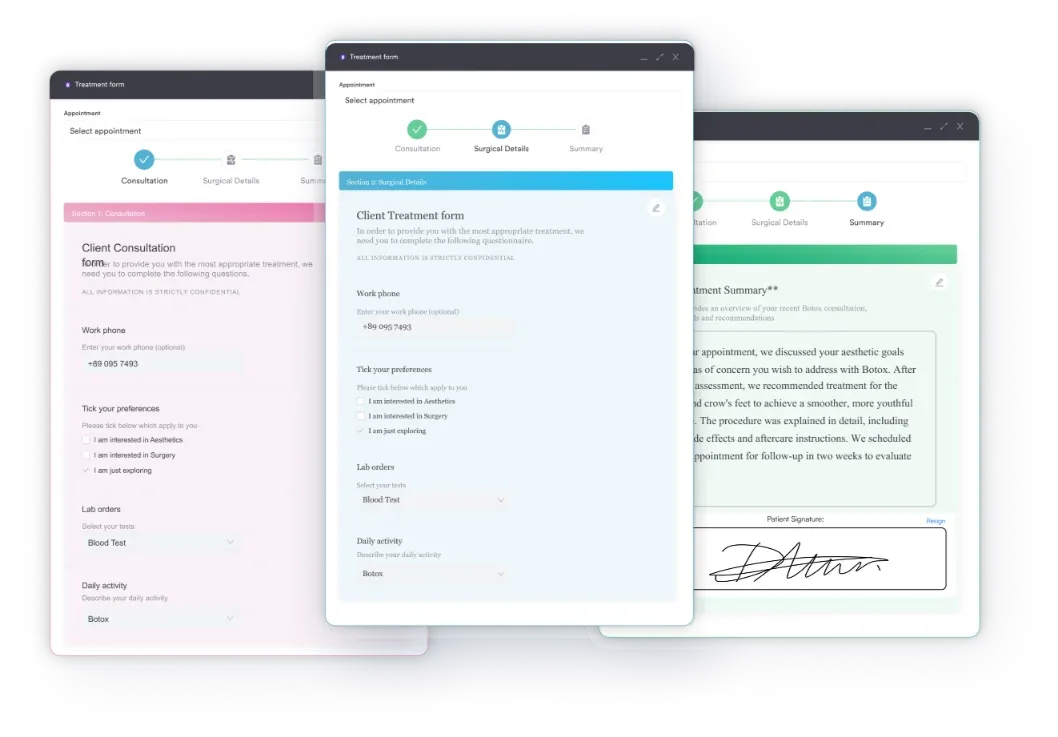
The chart is informed by clinical guidance from NICE (UK) and ACOG (US) as a tool for fertility awareness and natural family planning education. However, BBT charting alone is not a diagnostic method for pregnancy. It is a supportive tracking tool that should always be paired with a clinical pregnancy test.
Using a BBT pregnancy chart effectively requires consistent daily measurement and accurate recording. Follow these five operational steps to generate reliable fertility and cycle data:
The BBT pregnancy chart serves multiple clinical and personal contexts:
An occupational therapy platform can store each completed scale beside the patient’s goals and session history.
Non-invasive cycle documentation: BBT charting requires only a thermometer and daily measurement, with no bloodwork, ultrasound, or clinic visits needed. This accessibility makes it ideal for self-monitoring and longitudinal data collection across multiple cycles.
Identifies ovulation timing: Unlike ovulation predictor kits (which detect the LH surge immediately before ovulation), BBT confirms ovulation has occurred. This retrospective confirmation is clinically valuable for cycle assessment and helps practitioners distinguish anovulatory cycles from those with ovulation.
Supports fertility awareness and family planning education: BBT charting, paired with cervical mucus observation, forms the evidence base for natural family planning and fertility awareness methods. These approaches are recognized by NICE and ACOG as legitimate tools for informed reproductive decision-making.
Enables clinician-patient conversation: A completed BBT chart provides concrete data for discussions about cycle regularity, potential fertility concerns, and reproductive health goals. It demonstrates patient engagement and generates baseline data that informs whether further investigation (such as hormonal testing or imaging) is warranted.
Start a BBT chart during the first day of your next period so you capture a complete cycle from baseline. The first cycle may feel experimental, but by the second or third month, patterns become clear enough to act upon. Many fertility apps and digital charting systems (including those integrated into practice management platforms like Pabau’s digital forms) store historical data automatically, making trend analysis simpler across years of tracking.
BBT charts display distinct patterns that reflect hormonal phases. The biphasic pattern is the standard: a lower temperature range during the follicular phase, followed by a clear sustained rise into the luteal phase after ovulation. This two-level pattern is present in ovulatory cycles and is what practitioners look for when confirming ovulation has occurred.
A triphasic pattern shows a second temperature rise, creating a third distinct level in the luteal phase. Some women, though not all, display this pattern, and it has been observed more frequently in cycles that resulted in pregnancy.
However, a triphasic pattern is not reliably predictive of pregnancy, and many pregnant women show a standard biphasic pattern instead. The triphasic observation is mentioned frequently in fertility communities but should not be relied upon as a pregnancy sign.
An implantation dip is a brief, small temperature drop in the middle of the luteal phase (typically 7-8 days after ovulation) that some women observe on their BBT charts. The theory suggests this dip corresponds to the moment a fertilized embryo implants into the uterine lining. However, this association is not scientifically validated.
Many women experience temperature dips mid-luteal phase without pregnancy, and conversely, many pregnant women never observe an implantation dip. This pattern should not be interpreted as a reliable sign of pregnancy and must be paired with a clinical pregnancy test for confirmation.
If pregnancy occurs, your elevated BBT typically remains high throughout the first trimester as progesterone production continues to support the pregnancy. In a non-pregnant cycle, temperature drops back to the follicular baseline approximately 12-16 days after ovulation (usually a day or two before or during menstruation).
If temperature stays elevated for 18 or more days after ovulation without menstruation appearing, this sustained elevation may signal pregnancy, though it is not diagnostic on its own. A clinical blood hCG test or urine pregnancy test is always required to confirm.
The widely cited “18-day rule” (elevated temperature for 18+ days suggests pregnancy) is a useful clinical heuristic but carries important caveats. Individual cycle length varies; some women have naturally longer luteal phases, while others have irregular ovulation timing. Stress, illness, or poor sleep can also suppress the temperature drop, creating a false appearance of sustained elevation.
BBT charting is a valuable educational and monitoring tool but has specific limitations. According to evidence from Mayo Clinic and NHS guidance, BBT is not a reliable method for contraception.
The same principle applies to other structured monitoring tools.
Typical-use effectiveness is 76-88%, meaning roughly 12-24 out of 100 users will experience unintended pregnancy in a year. If contraception is the goal, barrier methods or hormonal contraception offer higher efficacy.
BBT charts cannot diagnose pregnancy, thyroid disorders, or other medical conditions on their own. They serve as supportive documentation that prompts clinical evaluation. Practitioners should always pair chart observations with appropriate testing (blood hCG, progesterone levels, TSH, pelvic ultrasound) before drawing clinical conclusions.
The downloadable template above includes both Celsius and Fahrenheit versions to accommodate regional practice standards and patient preference. In Celsius, the typical biphasic shift is 0.2-0.5°C; in Fahrenheit, this translates to 0.4-0.9°F.
When interpreting a chart, confirm which scale the patient is using to avoid misreading temperature patterns. Digital intake tools can be configured to capture temperature data in either unit, storing it consistently for easy comparison across cycles.

Pabau’s digital forms and client records let you systematically collect and store patient BBT data, track patterns across cycles, and attach completed charts to clinical files for reference during consultations.

When you meet with a fertility specialist, gynecologist, or functional medicine practitioner, bring your completed BBT chart (ideally covering at least 2-3 cycles). Highlight the ovulation date, note any anomalies or missed readings in your tracking, and mention any concurrent symptoms or stress that may have affected your baseline temperature.
Your practitioner will use the chart as context, alongside blood work, imaging, and clinical history, to assess your reproductive health and plan next steps. The chart is a communication tool, not a diagnostic test, so framing your data this way helps ensure it is interpreted appropriately.
If you still need to schedule that visit, a patient booking form makes it easy to pick a fertility or gynecology appointment slot before your data goes stale.
BBT charting is accurate for confirming ovulation after it has occurred, reliably identifying whether ovulation happened in a given cycle. However, it is less useful for predicting ovulation in advance, since the temperature rise happens only after ovulation is already complete.
Accuracy depends on consistent measurement time, adequate sleep, and absence of confounding factors (fever, travel, irregular sleep schedule). If you miss a day or two of temperatures, the pattern may still be interpretable, but consistency strengthens the reliability of the data.
A basal body temperature pregnancy chart is a practical, evidence-supported tool for tracking ovulation, understanding your menstrual cycle, and supporting informed conversations with your healthcare provider about fertility and reproductive health. The downloadable template above provides a structured format for recording daily temperatures in both Celsius and Fahrenheit, enabling you to identify patterns that may guide clinical decision-making.
Remember that BBT charting is a supportive tool, not a diagnostic test. Always pair chart observations with a clinical pregnancy test, and consult your gynecologist or fertility specialist before interpreting patterns that concern you. With consistent tracking and professional guidance, BBT charting becomes a valuable part of your fertility awareness practice.

Need a trauma-informed intake tool too? Abortion survey questions gather medical history, psychological factors, and personal circumstances in a confidential, trauma-informed way.
Need to integrate fertility data into your practice workflow? Fertility clinic management software centralizes patient charting, consultation notes, and test results in one searchable system.
Ordering an AFP test during pregnancy? AFP blood test template documents test indication, specimen collection, reference ranges, and follow-up for prenatal screening.
A sustained elevation of BBT for 18+ days without menstruation may prompt a pregnancy test, but BBT alone cannot diagnose pregnancy. A clinical blood test (hCG) or urine pregnancy test is required for confirmation. Many non-pregnant cycles can show prolonged temperature elevation due to hormonal variations or stress.
A biphasic chart shows two temperature phases: a lower follicular phase and a higher luteal phase. A triphasic chart displays a third distinct temperature rise within the luteal phase. Triphasic patterns appear in some (but not all) pregnancies; they are not diagnostic and cannot be relied upon as a pregnancy sign.
Track for at least 2-3 complete menstrual cycles (60-90 days) before drawing conclusions about your ovulation timing and cycle regularity. Patterns emerge more clearly when multiple cycles are compared, and individual variation is reduced.
No. BBT charting alone is not reliable for contraception – typical-use effectiveness is 76-88%. If contraception is your goal, use barrier methods, hormonal contraception, or intrauterine devices (IUDs), which offer significantly higher efficacy.
The absence of a temperature rise across multiple cycles may indicate anovulation (no ovulation occurring). Discuss this pattern with your healthcare provider – they may recommend blood work (FSH, LH, progesterone), pelvic ultrasound, or thyroid testing to identify the underlying cause.