Fair fighting rules worksheet
A fair fighting rules worksheet is a therapy handout that sets out ground rules ...

3
Last Updated: Oct 21, 2026

Sleep runs through four stages: three NREM stages (N1, N2, N3) and REM, each with its own EEG signature.
One cycle lasts 90 to 120 minutes and repeats four to six times a night.
Deep sleep (N3) fills the early cycles, while REM sleep grows longer toward morning.
N2 takes the largest share of the night, but N3 is the longest single block inside each cycle.
The chart supports patient education, polysomnography interpretation, and sleep disorder diagnosis on one page.
A one-page reference to the four sleep stages, listing the EEG pattern, eye movement, muscle tone, and typical duration for each one. Print it for the consultation room or send it ahead of a sleep study review.
Download templateA stages of sleep chart is a one-page visual reference that maps the four sleep stages against their physiological markers. It covers the three non-REM stages (N1, N2 and N3) plus rapid eye movement (REM) sleep. Each row names what the EEG shows, what the eyes and muscles are doing, and how long the stage usually lasts.
The four-stage model comes from the American Academy of Sleep Medicine (AASM), which replaced the older five-stage classification in 2007. The chart turns that neurophysiology into something you can point at mid-consultation.
It earns its place in three jobs: reading a polysomnography report, explaining a diagnosis, and setting expectations about sleep hygiene.
Sleep complaints usually arrive attached to a mood or anxiety presentation, so the chart travels well in therapy and psychiatry settings. Practices running on therapy practice management software can hold that sleep history in the client record instead of loose notes.
The chart works best when it sits at five specific points in the patient journey:
The downloadable chart carries five columns for each of the four sleep stages:
Atonia is the column worth reading twice. Muscle tone drops steadily through N1 to N3, but only REM produces the full paralysis that keeps a sleeper from acting out a dream. That distinction is what separates REM sleep behavior disorder from a parasomnia arising out of deep sleep.
The same columns help you spot abnormalities on a sleep study report. Frequent awakenings out of N2 or N3 may point to periodic breathing. Absent REM sleep can signal a medication effect or untreated sleep apnea.
This reference serves several healthcare and wellness roles:
Improves patient compliance. A patient who understands why the stages matter is likelier to hold a bedtime and skip the evening drink. They are also likelier to persist with a CPAP device through the awkward first two weeks.
Speeds clinical decision-making. A visual reference saves you looking up EEG criteria mid-consultation. You can confirm quickly whether a polysomnography result matches the disorder you suspect, such as the short REM latency seen in narcolepsy.
Standardizes documentation. When the whole team works from one chart, sleep assessments stop varying by clinician. Digital intake forms can carry the chart alongside the questions, so every patient is asked about sleep in the same terms.
Supports informed consent. The chart shows the patient what a treatment is aimed at. Use it before you prescribe a sleep aid or refer for cognitive behavioral therapy for insomnia (CBT-I). They can see which stage is disrupted and why the intervention targets it.
Differentiates clinical conditions. Sleep disorders leave distinct fingerprints on the chart. Narcolepsy shortens REM latency. Obstructive sleep apnea fragments every stage. REM sleep behavior disorder shows atypical muscle tone during REM, and primary insomnia often shows a reduced N3 share.
Print the chart and hang it in your consultation rooms and waiting area. Patients who see it often ask about their own sleep before you raise the subject. That is a better opening than any leaflet on a rack.
Open the chart next to the polysomnography report and read them together. Show the patient where their night departs from the healthy profile. Deep sleep at 8% against a target near 25% is a number they can hold on to. So is a REM period that arrives too early.
Then point at the EEG row. “These delta waves are what your brain should be producing during deep sleep for physical recovery. Your study shows fewer of them, which is why you wake up tired.” The chart gives the sentence something to land on.
Use the same page to justify a lifestyle change. A patient who drinks to fall asleep needs to hear that alcohol suppresses REM, the stage that handles emotional processing and memory consolidation. Falling asleep faster and sleeping well are not the same outcome.
Where you need a number rather than a description, add a validated instrument. The Pittsburgh Sleep Quality Index gives you a score you can repeat at review, which the chart alone cannot do.
Healthy adult sleep follows predictable proportions across the four stages. According to NIH StatPearls, the typical breakdown is:
Share of the night and length per cycle are two different readings, and the chart below puts them side by side. N2 takes the largest share overall, yet N3 delivers the longest uninterrupted block inside a single cycle.
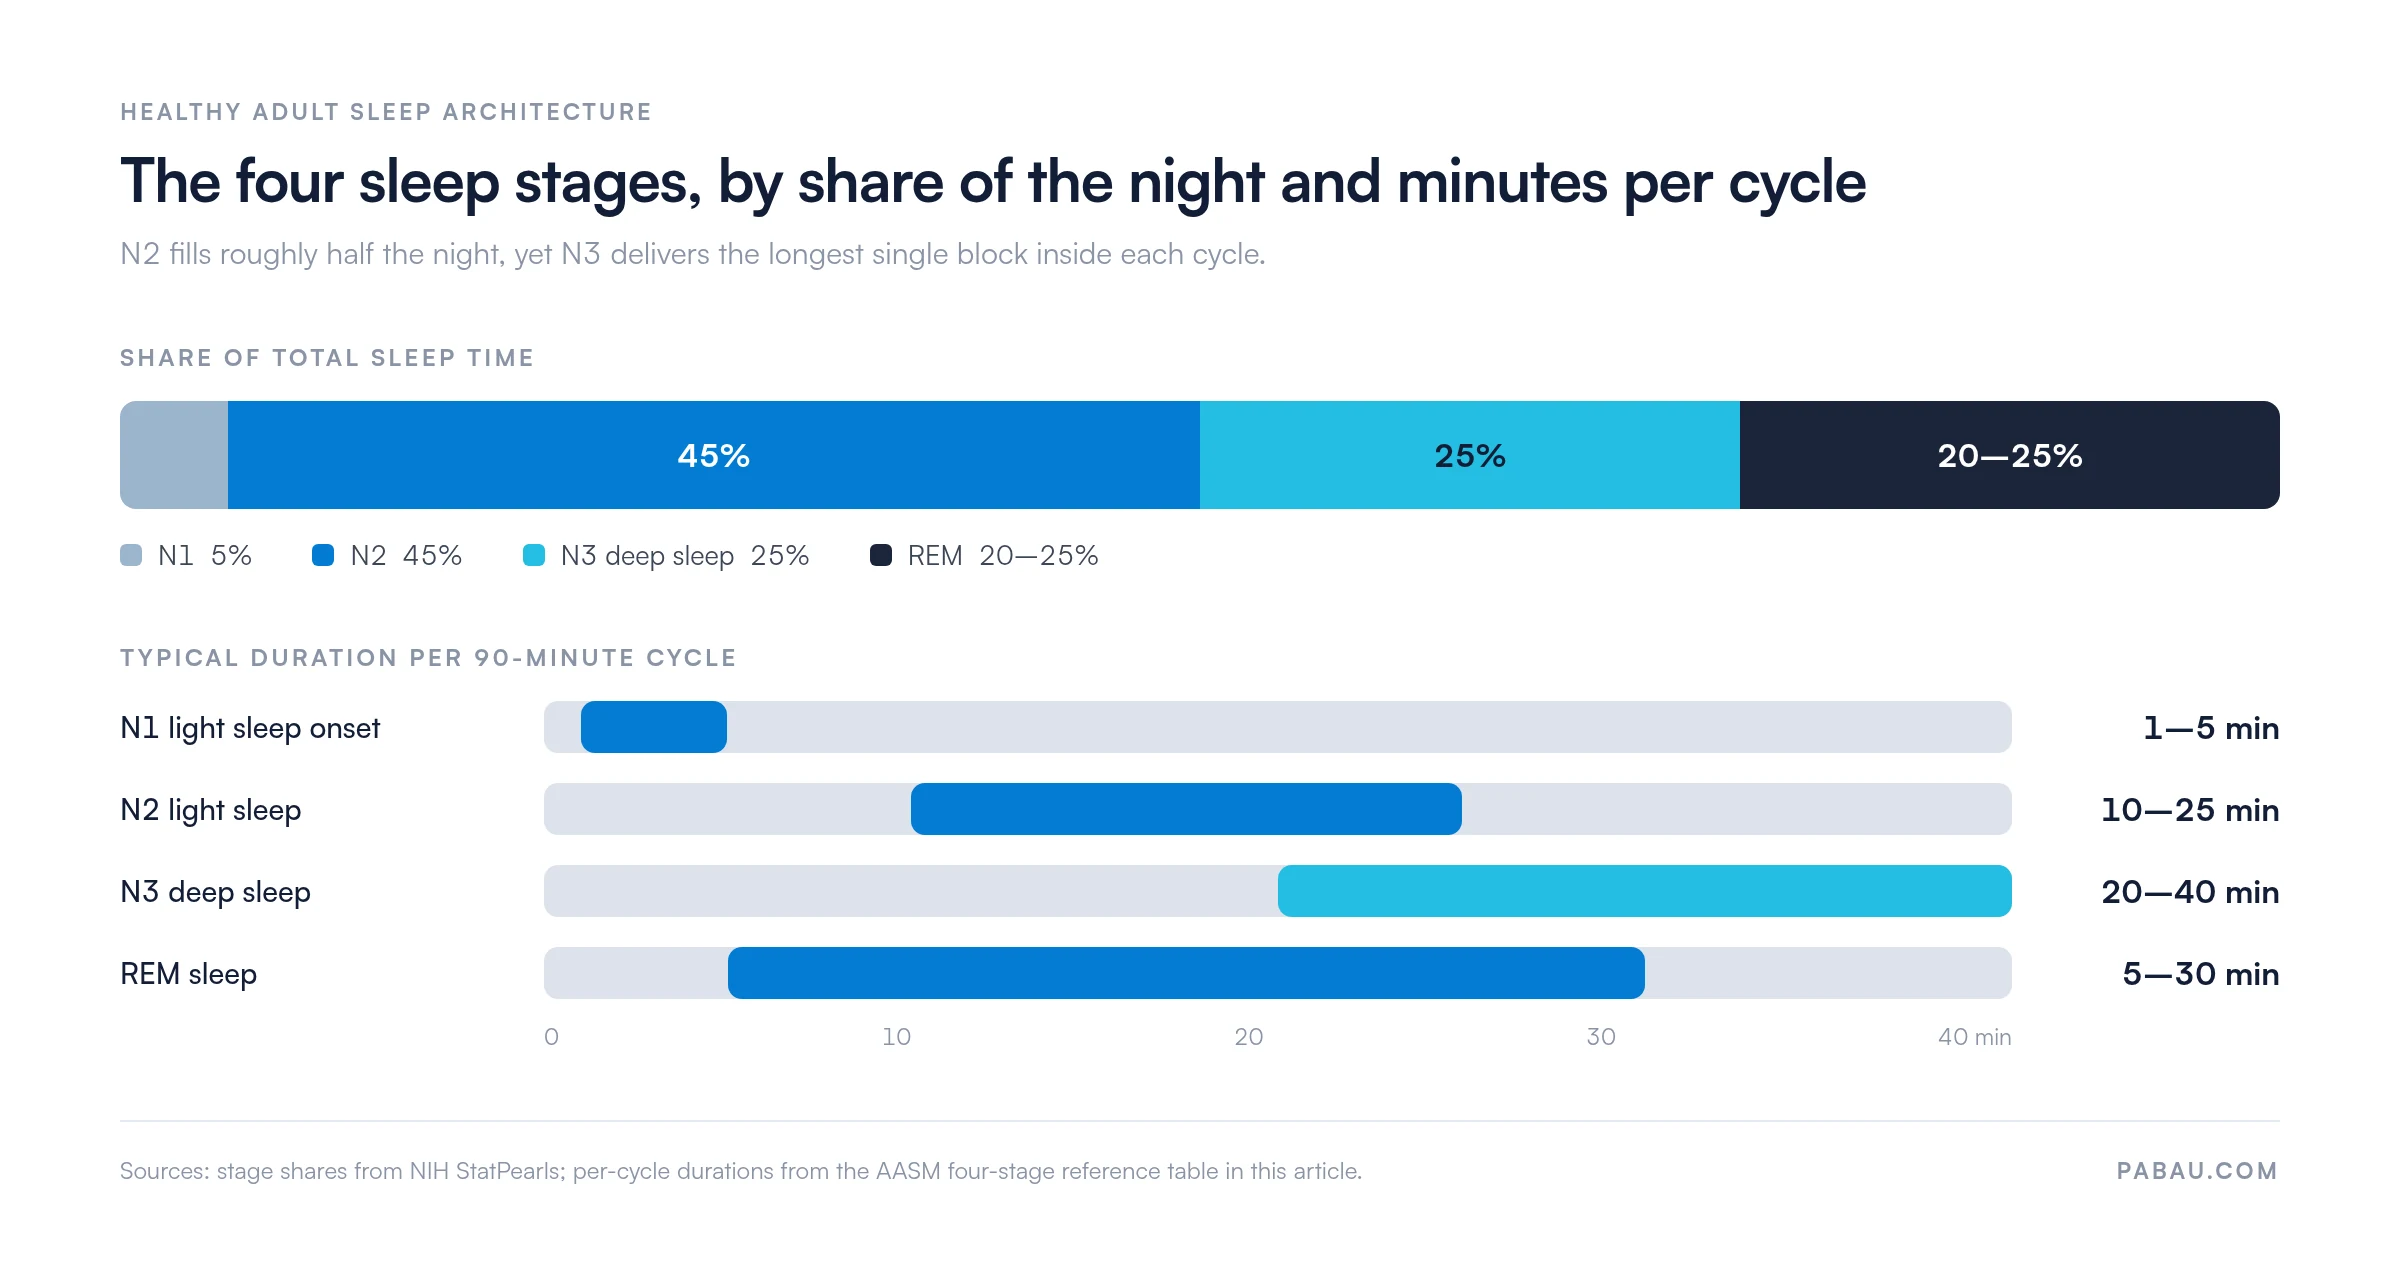
These percentages are guidelines rather than absolutes. Age moves them considerably: children spend more of the night in N3, while older adults get less of it and wake more often. A report showing 35% N2 and 8% N3 warrants a closer look at apnea, medication, and primary sleep disorders.
Sleep architecture is the organized sequence of stages across a night. A typical 90-minute cycle runs N1, then N2, then N3, back to N2, then REM. That sequence repeats four to six times in a healthy sleeper.
Early cycles are weighted toward N3. The first cycle might be 30% deep sleep and only 5% REM. By the fifth, the ratio has flipped to roughly 5% N3 and 30% REM.
That shift explains why cutting a night short costs a patient most of their REM sleep, with the mood and memory consequences that follow. It also explains why an early alarm and a late bedtime damage sleep in different ways.
Disruption to the normal stage sequence sits underneath most sleep disorders. Cleveland Clinic notes that fragmented sleep, meaning frequent micro-awakenings, stops each stage from completing its restorative work.
Obstructive sleep apnea (OSA) is the clearest example. It rouses the patient repeatedly out of N3 and REM, so the study comes back with low percentages in both plus frequent arousals. That combination is close to a signature.
Depression and anxiety leave a different mark. REM latency shortens, so REM arrives sooner after sleep onset than it should. Practices working in a mental health EMR can keep that finding beside the mood history, where the next clinician will see both.
Read these patterns against the chart and the match becomes visible. A complaint of unrefreshing sleep, daytime fatigue, poor memory, or mood instability lines up with a specific stage disruption. That is the point at which treatment can be aimed rather than guessed.
Most practices hand the chart over as a printed sheet at the end of the appointment. The sleep history that prompted it then lives in a free-text note. Nobody can compare what the patient said in March against what they say at review.
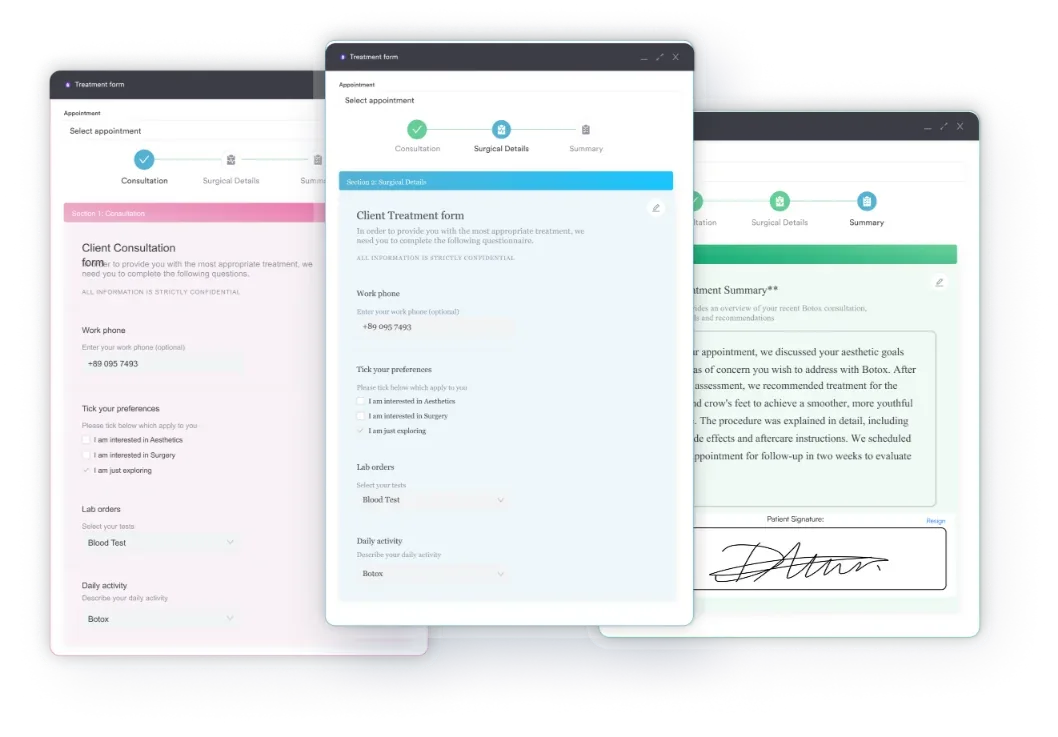
Practice management software like Pabau moves both jobs in front of the visit. You attach the chart to a digital intake form, and the patient reads it while answering structured questions about bedtime, wake time, and night waking. Those answers arrive in the client record as fields you can filter and chart over time.
During the consultation, Pabau Scribe, our AI scribe, drafts the note while you talk the patient through the chart. Our online booking portal handles the review appointment you book off the back of it. Every subscription includes every feature, so a solo psychologist and a six-clinician sleep service work from the same setup.

Pabau’s digital forms and client portal send the sleep chart ahead of the visit. The answers come back as structured fields in the client record, ready for the review.

The chart’s value is in the conversation it starts, not the poster on the wall. A patient who can name the stage they are losing will follow a bedtime rule they previously ignored.
Print it, keep it in the consultation room, and put it in front of anyone whose sleep study you are about to explain. Hold one caveat alongside it. Stage percentages are population guidelines, and age, medication, and comorbidity all move them, so read the report against the patient too.
Download the chart above, then decide where the sleep history it prompts is going to live. Book a demo to see how Pabau keeps that history in the client record instead of a free-text note.

Need a score rather than a description? The Insomnia Severity Index gives you a repeatable measure you can track from intake to review.
Looking for something to send the patient home with? The sleep hygiene handout turns the advice you give in the room into a page they can keep.
Referring for CBT-I? The CBT for sleep worksheet walks the patient through the thought records that sit behind the therapy.
Screening sleep at intake? The sleep questionnaire collects bedtime, wake time, and night waking in a form the patient can fill in beforehand.
Documenting sleep inside a psychiatric assessment? The psychiatric evaluation template carries a structured sleep section that matches these stage terms.
NREM (non-rapid eye movement) sleep covers three stages, N1, N2 and N3. It is marked by slow brain waves, minimal eye movement, and progressive muscle relaxation. REM (rapid eye movement) sleep brings rapid eye movements, vivid dreams, temporary muscle atonia, and high brain activity. NREM does the restorative work for the body. REM handles emotional processing and memory consolidation.
Healthy adults need roughly 1.5 to 2 hours of deep sleep (N3) a night, which is around 25% of total sleep time. That share falls with age, so older adults naturally get less. Consistent schedules, daytime exercise, and a cool bedroom all support healthy N3 amounts.
REM sleep supports emotional regulation, memory consolidation, brain development, and immune function. Procedural and emotional memories are consolidated during it. Dreams in REM process emotional experience, which is why REM deprivation shows up as mood dysregulation and poor learning.
Adults usually complete four to six sleep cycles a night, each running 90 to 120 minutes. Earlier cycles hold more deep sleep (N3), and later cycles hold more REM. Sleeping fewer than six hours normally means losing the full REM periods of the last cycles.
Slow-wave sleep is another name for N3, or deep sleep. It takes the name from the slow delta waves that define the stage on an EEG. It is the most restorative stage, sits mainly in the early cycles, and supports physical recovery and immune function.