

fib-4 index
What is the FIB-4 index and when is it used? The FIB-4 index is a non-invasive s...

1
Last Updated: Nov 11, 2026
The most useful healthcare dashboard examples fall into six types: executive, clinical outcomes, patient-facing, operational, practice performance, and real-time monitoring. A healthcare dashboard is a visual reporting screen that pulls clinical, operational, and financial data into one live view. It tells leaders whether the practice is on track today.
Which type you need depends on your role and how fast your decisions move. Clinic owners get the most from a practice performance dashboard, while hospital teams lean on executive and real-time views. This guide shows what each type tracks, the KPIs behind it, how fresh its data should be, and how to choose a tool.

Healthcare dashboards consolidate clinical, operational, and financial data into one live view for faster decisions.
There are six core dashboard types: executive, clinical, patient-facing, operational, practice performance, and real-time.
Key metrics differ by dashboard type: revenue cycle for finance, bed occupancy for operations, NPS for patient experience.
Refresh speed should match the decision, from every few minutes for real-time views to daily or weekly for executive views.
Small practices can rely on the dashboard and reports built into their practice management software instead of a separate BI tool.
A healthcare dashboard is a visual reporting interface that pulls live or near-live data from an EHR, practice management system, or billing platform. It presents that data as charts, tables, and KPI tiles. It answers the question every clinic owner and hospital administrator shares: “What is happening in my practice right now, and is it on track?”
The difference between a dashboard and a standard report is immediacy. Standard practice management reports are snapshots of a closed period. A dashboard updates as appointments are booked, claims are submitted, or treatments are completed. For a solo practitioner that might mean tracking daily revenue against target. For a hospital CFO it means monitoring readmission rates against CMS benchmarks across 12 departments at once.
Not every dashboard serves the same audience. Before picking a tool or building a view, identify which dashboard type matches your role and the decisions you need to make faster.
The following examples show what each type looks like in practice, which data sources feed it, and who typically builds and maintains it. Use them as reference points when you weigh up your own needs.
A hospital executive dashboard gives CEOs and CFOs a system-wide view across finance, quality, and patient volume, typically refreshed daily or in near-real-time. It skips drill-down clinical analysis and surfaces the signals that need a leadership response.
Data source: EHR, billing system, payroll, and patient satisfaction survey platform, usually aggregated through a BI layer like Power BI or Tableau.
A clinical outcomes dashboard is built for department heads and clinical leads. They use it to monitor treatment efficacy, complication rates, and care pathway adherence across the patient population.
Data source: EHR and EMR exports, lab systems, and AHRQ quality measure frameworks for benchmarking. Like most clinical analytics work, this dashboard usually needs a data warehouse or direct EHR API access to build.
A patient dashboard lives in a patient portal or patient-facing app. It shows each person their own health data, upcoming appointments, and care plan progress, which cuts inbound inquiries and supports adherence.
A patient dashboard works best when each tile prompts an action, such as confirming a visit or signing a form before it. Putting those next steps in front of patients can help improve attendance and reduce no-shows.
An operational dashboard runs in real time for practice managers and operations leads. It answers the question: “Are we running on track today, and where are the pinch points?”
Common mistake: An operational dashboard that refreshes hourly is too slow to act on. Aim for live data, or a refresh within about 15 minutes, so the team can respond while a bottleneck is still forming. A view that is 90 minutes stale when the queue builds works like a slow report.
A practice performance dashboard is the version most relevant to owners of aesthetic, allied health, and private primary care practices. It tracks the commercial and operational health of the practice by practitioner and by service.
Pabau, the practice management platform we build, includes a built-in clinic dashboard that works without a separate BI tool. Practice owners can see daily revenue, appointments, and outstanding balances from a single screen.
A real-time healthcare dashboard is the most technically demanding type. It is built for emergency departments, ICUs, and large inpatient facilities where conditions change faster than any report cycle can capture.
Why it matters: A 10-minute delay in surfacing an ED capacity breach can mean diverted ambulances. These dashboards typically run on streaming data architectures (Azure Health Data Services, AWS HealthLake) feeding BI front ends, rather than standard reporting tools.
The right metrics depend on the dashboard type. The table below maps each metric to the dashboard audiences that care about it most. Its typical benchmark ranges are informed by AHRQ quality and safety frameworks and CMS reporting standards. Regular healthcare benchmarking against these norms shows whether a practice is improving or only collecting more data.
Pabau’s reporting surfaces practice-level metrics such as revenue and appointments, so owners can track the practice performance rows above without a separate BI tool.
Before building or buying a dashboard, list the three decisions you make most slowly because of missing data. Those are your first three metrics. Add more only once those three are in daily use.
Even accurate data becomes useless if the dashboard is too cluttered to read in 30 seconds. Good healthcare dashboard design follows a small set of principles that experienced BI teams learn through trial and error.
The right tool depends on who is building the dashboard, what data sources need to connect, and whether HIPAA compliance is a requirement. The table below compares the most common healthcare reporting tools. For practice owners comparing practice management software features, the choice between a general BI tool and a purpose-built system matters most.
General BI tools (Power BI, Tableau, Looker) require a data team to build and maintain connections, model data schemas, and govern access. That investment makes sense for hospital systems with dedicated analytics functions. A practice owner running 3 to 15 practitioners has a simpler option. A purpose-built practice management app with reporting built in is usually faster to set up and cheaper to run.
Before committing to a tool or building a dashboard from scratch, run through these eight criteria. Missing two or more of them often leaves a dashboard that gets built, used for a month, and then abandoned.
Patient satisfaction scores deserve their own check. Confirm whether the tool pulls from your existing survey platform or needs a separate integration. Feedback split across two systems is one of the most common dashboard blind spots in mid-size practices.
Many small practices still build their performance picture by hand. Someone exports bookings from the calendar, pulls takings from the payment system, and merges both in a spreadsheet at month end.
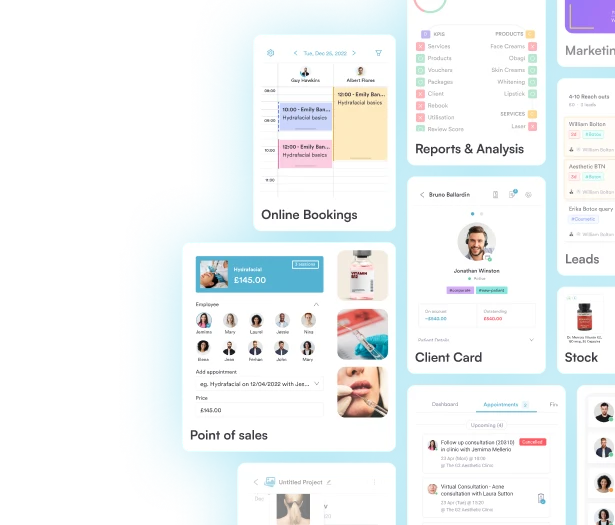
Pabau keeps appointments, patient records, and payments in one system, so its dashboard and reports read from the data your team already enters. You can check the day’s revenue, appointments, and outstanding balances without an export. Reports also break revenue down by service, practitioner, and location.
The result is a performance check that takes minutes, made on this week’s numbers instead of last month’s.

Pabau’s built-in dashboard and reports give practice owners visibility into appointments, revenue, and practitioner performance, without a BI tool or data team.
Start with your role and the decisions you make most slowly. A hospital team needs executive and real-time views on a BI layer, with a data team to maintain them. A practice owner needs a practice performance dashboard that reads straight from the booking and payment system.
Pick the three metrics behind those slow decisions, check that the refresh speed fits, and add more only once they are in use. The trade-off to remember is flexibility against upkeep. BI tools can model almost any metric but need constant maintenance, while built-in dashboards cover fewer views with far less work.
For practices that want that view without a data team, Pabau’s built-in dashboard and reports show revenue by service, practitioner, and location in one place. Book a demo to see how Pabau’s reporting would work for your practice type.

Which reports should a practice run every month? Medical practice management reports covers the standard reports practices use to track bookings, revenue, and staff performance.
Choosing software to collect and present your data? Healthcare reporting tools explains what these tools do and how to choose one for your practice.
Ready to go deeper on clinical data? Clinical analytics walks through the types and use cases of analysis built on the records you already keep.
How do your numbers compare with peers? Healthcare benchmarking shows how to compare clinical and operational performance against a reference point.
A healthcare dashboard is a visual analytics interface that consolidates clinical, operational, and financial data from multiple systems into a single, continuously updated view. Clinic owners, practice managers, clinical leads, and hospital executives use it to monitor performance and make faster decisions without pulling manual reports.
The right metrics depend on your role. Executive dashboards prioritize revenue cycle (days in AR, net collection rate) and quality indicators (readmission rate, patient satisfaction). Operational dashboards track bed occupancy, wait times, and staff utilization. Practice performance dashboards focus on appointment fill rate, no-show rate, revenue per treatment, and rebooking rate. Start with the three decisions you currently make slowest and build your metric set around those.
An operational dashboard runs in real time. Practice managers and charge nurses use it to manage day-to-day throughput, such as bed availability, wait times, and staff ratios. An executive dashboard refreshes daily or weekly and gives leadership a system-wide view of financial performance, quality indicators, and patient volume trends. The two serve different decision speeds and different levels of detail.
Yes. Small and medium practices typically do not need a dedicated BI tool like Power BI or Tableau. Purpose-built practice management platforms include built-in dashboards covering the metrics most relevant to clinic owners. These need no data engineering to set up.
A real-time healthcare dashboard connects to live data streams from an EHR, bed management system, or operational platform and refreshes continuously, usually every few minutes. When a metric crosses a defined threshold (such as ED wait time exceeding 60 minutes), the system triggers an automated alert. Standard reporting works differently, pulling data in scheduled batches.
The most common tools are Microsoft Power BI, Tableau, Looker, and Qlik for hospital and enterprise contexts. Check each vendor’s HIPAA Business Associate Agreement terms before you connect patient data. For smaller practices, purpose-built practice management platforms with native reporting are more practical, because no data team has to build and maintain connections between systems.