Healthcare risk management: A practical guide for private practices
Healthcare risk management is the process of finding, assessing, and controlling...

Last Updated: Oct 5, 2026

Clinical analytics turns patient, appointment, and financial records into decisions that improve care quality and practice performance.
Four types build on each other: descriptive (what happened), diagnostic (why), predictive (what comes next), and prescriptive (what to do).
Most independent practices sit at the descriptive level, and the move up to diagnostic delivers the biggest jump in insight.
Records split across separate booking, notes, and billing systems are the usual obstacle, not a shortage of analysts.
Reporting included in practice management software gives a small practice a starting point without extra tools or a specialist hire.
Clinical analytics sounds like a hospital project with a data team behind it. In practice, the records it runs on already sit in your own system. Appointment histories, treatment notes, outcome scores, and billing records pile up every week, and most of them go unread.
You do not need new data to start, only a way to join what you already keep. Get that right and you stop guessing at which patients lapse, which protocols work, and which slots lose money.
What follows is the four types of clinical analytics, the use cases worth your time, and how to start without an analyst.
Clinical analytics is the collection, analysis, and interpretation of health data to support better decisions in patient care and practice operations. It draws on electronic health records (EHR), appointment and scheduling data, billing records, and treatment outcome measurements.
Collecting the data is the easy half. The work is turning it into a decision someone can act on this week, which usually means answering questions like these:
Scale changes what that work looks like. A hospital might predict readmissions across thousands of episodes. A 10-room aesthetic practice is more likely to track rebooking rates and outcome scores after filler treatments.
The method is identical, but the questions sit closer to the front desk. Both run on the same handful of record types, which is why a single practice management app is usually the shortest route to them.
Analytics comes in four levels, and each one builds on the one before it. Most write-ups stop at three. The fourth matters, but the jump from level one to level two is where a small practice sees the sharpest change.
Most independent practices work at the descriptive level today. They know the number, but not the reason behind it. Moving up to diagnostic analytics, which asks why, is where the quality of the answer changes.
Better still, that move needs no new software for most practices, because the records already sit in the practice management system.
Patient care and business performance are closer together than they look. A practice that spots lapsing patients early also spends less admin time chasing them later.
Five returns show up first:
One caution before you build a dashboard around any of these. A metric nobody owns will not change behavior, because it gets read once and never acted on. Assign each number to one person who reports on it in a set meeting, and the reporting starts earning its keep.
Which use cases matter depends on your specialty, but four apply almost everywhere. They differ mainly in how many record types you have to join. The grid below is a quick check on what is within reach today.
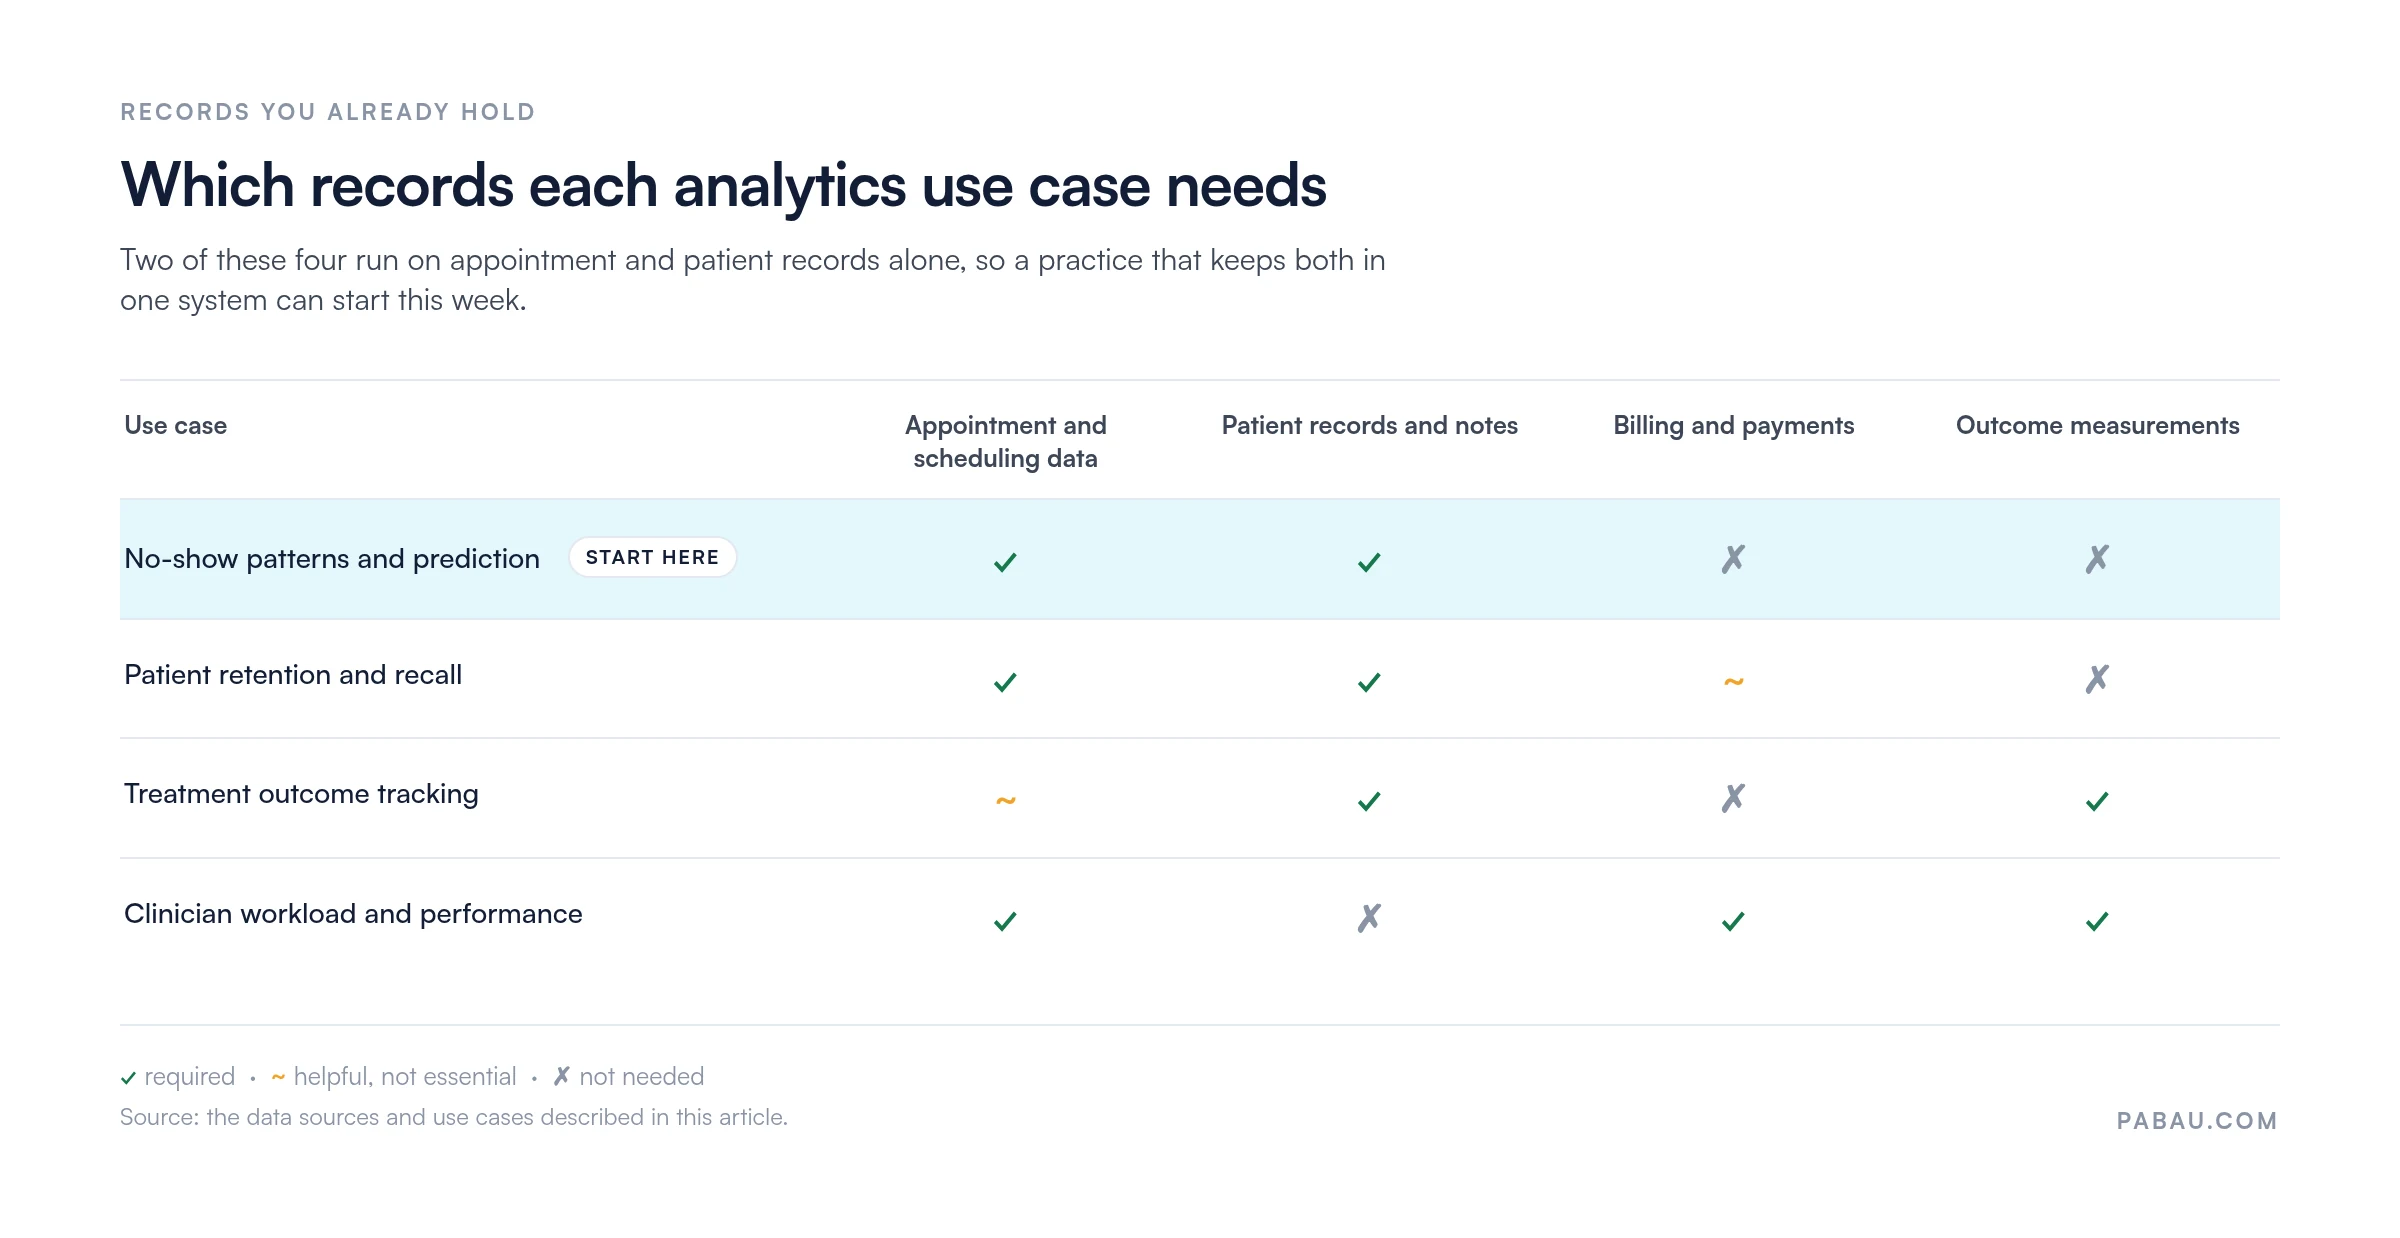
Start by breaking your no-show rate down by patient segment, day of week, and appointment type. The number on its own gives you nowhere to start. The breakdown usually does, and patterns tend to appear within one quarter of data.
Predictive work takes it a step further and flags individual appointments as high-risk before the day arrives, so reception confirms selectively instead of calling everyone.
Practices that ground their patient no-show rate work in segmentation consistently beat those running one blanket reminder policy.
Recording which treatments produce measurable results, and for which patient profiles, gives you a controlled comparison you can run during normal opening hours. A dermatology or aesthetic practice can compare outcome scores across filler protocols, treatment sequences, or aftercare regimens.
The catch is consistency. Scores recorded on a different scale, or at a different interval, are not comparable later. Fix the measure and the follow-up window first, then start collecting. Measurement tools built into a practice management system handle that for you, which is what makes this feasible without a research team.
Retention analysis shows which patient segments drop off earliest and what brings them back. For practices selling treatment courses or maintenance appointments, that reads straight through to revenue. A recall triggered at the right interval for that treatment beats a quarterly campaign to the whole database.
Appointment volumes, revenue per clinician, and outcome scores by practitioner expose imbalances early. A practice manager can see whether one clinician carries a disproportionate load. A new starter’s low conversion rate often points to a support need rather than a performance problem.
Four obstacles come up again and again in independent practices. Large health systems hit the same four, at a different scale.
Published research sorts the obstacles differently. A review on PubMed Central (NIH) groups them into cultural, educational, and technical barriers. It names leadership alignment, organizational culture, standardized measurement tools, and interoperability between systems.
The Agency for Healthcare Research and Quality (AHRQ) builds its quality improvement guidance around measurement too. The recurring theme is data that reaches the person making the decision while it is still current.
Audit where your data lives before you evaluate a single analytics tool. List every system that holds patient or clinical information: your booking platform, your notes system, your billing software, your outcome measurement tool. If that list runs past two entries, consolidating them will deliver more than layering an analytics tool on top.
The instinct is to park analytics until the practice is bigger or has spare admin capacity. That delays value you could have this week. Here is a sequence that works for an independent practice.
The traditional model assumes a pipeline. Pull data out of an EHR, load it into a warehouse, run the models, then read the output in a separate business intelligence tool. That suits a 500-bed hospital with data engineers on staff. It does not suit a six-room dermatology practice.
Practice management software like Pabau removes the pipeline. When bookings, clinical records, treatment outcomes, and payments sit in one system, the records are already structured and consistent. There is no export step, and no reconciling two versions of the same patient.
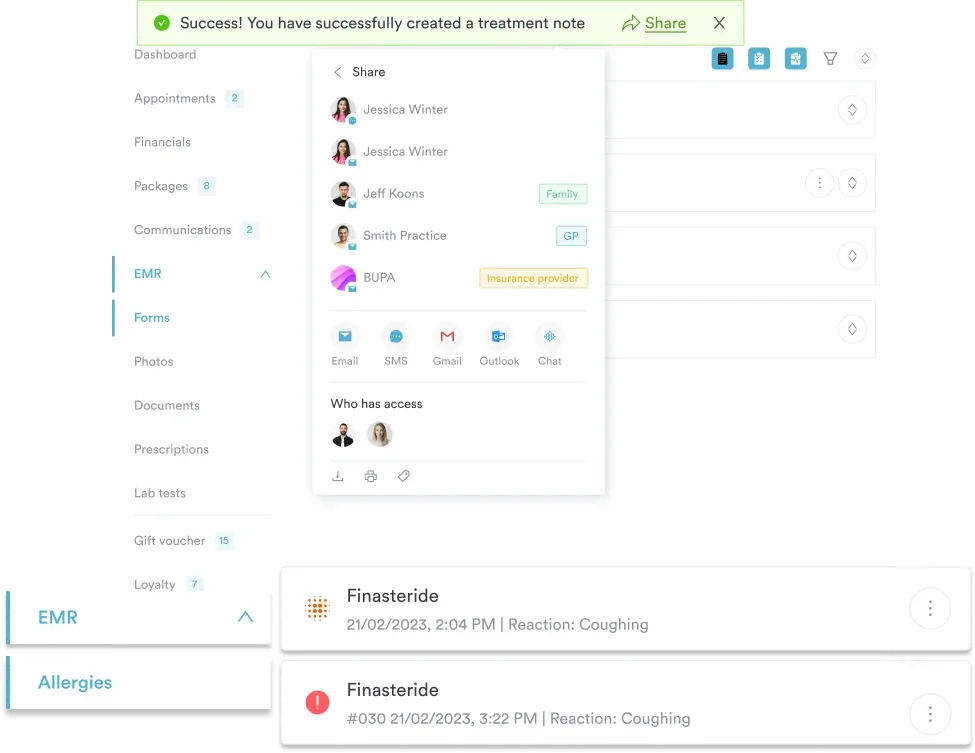
Reporting and analytics comes with every Pabau subscription, at every user count. That covers the dashboards a practice manager opens on a Monday: appointment trends, revenue by practitioner, retention, and treatment outcomes recorded against the patient record.
Because the reports read live data, there is no lag between what happens at the front desk and what the numbers say.
Insights Plus is a separate paid add-on, for practices that want more on top. It focuses on booking and revenue reporting, practitioner performance, custom dashboards, and a connector into your own business intelligence tool. Most practices getting started with clinical analytics will not need it yet.
HIPAA in the US and GDPR in Europe both set rules on how patient data used for analytics is stored, processed, and accessed.
Any platform you use for this has to document its data processing and limit reporting access by staff role. Pabau handles both, so that overhead does not land on your practice manager.

Pabau keeps bookings, notes, outcomes, and payments in one system, so reporting reads live records instead of exports. Book a demo to see the dashboards for a practice your size.

Analytics is a habit before it is a tool. Practices that get value from it read three numbers every week and change one of them. The ones that buy software first often still have the software a year later, and no habit.
So pick your three questions, find out where those records live, and run the first report on the last six months. If the records sit in two or more systems, consolidating them will do more for you than any dashboard laid over the top. That is the trade-off worth remembering.
Reporting is included in every Pabau subscription, so you can start with the records you already keep. Book a demo and we will walk through the numbers a practice your size should be watching.

Want to cut no-shows with data rather than more reminders? How to improve your patient no-show rate covers the scheduling and reminder changes that move the number.
Not sure which reports to run first? Medical practice management reports walks through the ones a practice manager should read every week.
Comparing platforms before you commit? The best medical practice management software weighs the options on reporting depth, workflow, and cost.
A clinical data analyst cleans, joins, and interprets healthcare data so clinicians and managers can act on it. In a small practice nobody holds that title. The work usually sits with the practice manager, supported by reporting built into the software the team already uses.
No. Clinical analytics covers patient care data: outcomes, protocols, and care quality. Healthcare analytics is the wider term, and it also takes in finance, staffing, supply chain, and operations. Clinical analytics is one part of it.
Usually not a separate consent. HIPAA permits the use of patient information for health care operations, which includes quality assessment and improvement. GDPR asks for a documented lawful basis instead. Either way, record why you hold the data and restrict who can query it.
Six months of consistent records is enough for descriptive and diagnostic work. Predictive models want more, usually a year or two, plus enough cases in each group to mean anything. Start with the period you can trust, not the longest one you hold.
Analytics looks back across a group of patients to find patterns. Clinical decision support acts inside a single encounter, prompting the clinician at the point of care. Analytics tells you which protocol works. Decision support reminds someone to follow it.