Physician credentialing checklist
A physician credentialing checklist lists every license, certificate, verificati...

Last Updated: Oct 23, 2026
Healthcare reporting tools answer the questions every practice manager asks on a Monday morning. Who is overbooked? Which service is losing money? Which patients are overdue for follow-up?
These tools pull scheduling, billing, and clinical data into reports and dashboards your team can act on. Above all, a report is only as reliable as the data your team records at the desk and in the treatment room.
Below, we cover the main tool types, the KPIs worth tracking, how data moves through a practice, and a checklist for choosing a tool.

Healthcare reporting tools pull scheduling, billing, and clinical data into reports and dashboards that show trends a raw appointment log hides.
The five main tool types are BI platforms, native EHR analytics, dashboard tools, quality and compliance modules, and revenue cycle reporting.
Track three KPI groups, clinical, financial, and operational, and agree on how each metric is calculated before you report on it.
Most reporting errors start upstream, with unmarked no-shows, unsigned notes, or payments taken outside the system.
Before you buy, check data freshness, role-based views, native integrations, export formats, and filtering by practitioner and location.
Healthcare reporting tools sit on top of your scheduling, billing, clinical records, and communication systems. They turn those records into structured reports or visual dashboards. Unlike a raw EHR export, they surface patterns instead of rows.
Take a practice running 400 appointments a month. Nobody will spot a 12% drop in returning patients by scrolling the calendar. A reporting tool calculates retention automatically and flags the decline before it becomes a revenue problem.
The case for measuring is well established. The Agency for Healthcare Research and Quality (AHRQ) describes data-driven quality improvement as a way to improve care quality. For private practices and med spas, the same principle applies to money and operations. You can only improve what you measure.
There’s also a compliance driver in the US. Under the CMS Merit-based Incentive Payment System (MIPS), eligible clinicians submit quality measure data every year. Doing that by hand is slow and error-prone. Tools that export clinical quality measures (CQMs) turn MIPS reporting into a routine step instead of a year-end scramble.
Reporting tools fall into five broad categories. Each one serves a different audience and answers a different question.
Most small and mid-sized practices don’t need an enterprise BI platform or a dedicated data team. They need practice software that reports on its own data. Pabau, the all-in-one practice management system we build, follows that model. Its reporting and analytics covers appointments, revenue, staff, and retention data in one place.
Larger groups pulling data from several systems may still want a healthcare business intelligence layer on top. For a single-site or small multi-site practice, that usually adds cost before it adds insight.
The right tool starts with the right numbers. The KPIs that move practice performance fall into three groups, and each group answers a different question.
Clinical KPIs measure whether patients get appropriate, timely care. Practices in MIPS or value-based contracts also need these numbers ready for submission and audit.
Revenue health is invisible without structured financial reporting. A practice can be fully booked and still short of cash. That happens when package redemptions, refunds, and unpaid balances go untracked.
Operational metrics show whether the practice runs efficiently. A manager watching them can step in before small problems turn into staff burnout or lost revenue.
Every number in a report starts as a click by someone on your team. Follow one appointment through the day, and you can see where the data comes from and where it goes wrong.
The diagram below maps those five hand-offs and the slip that most often breaks each one.
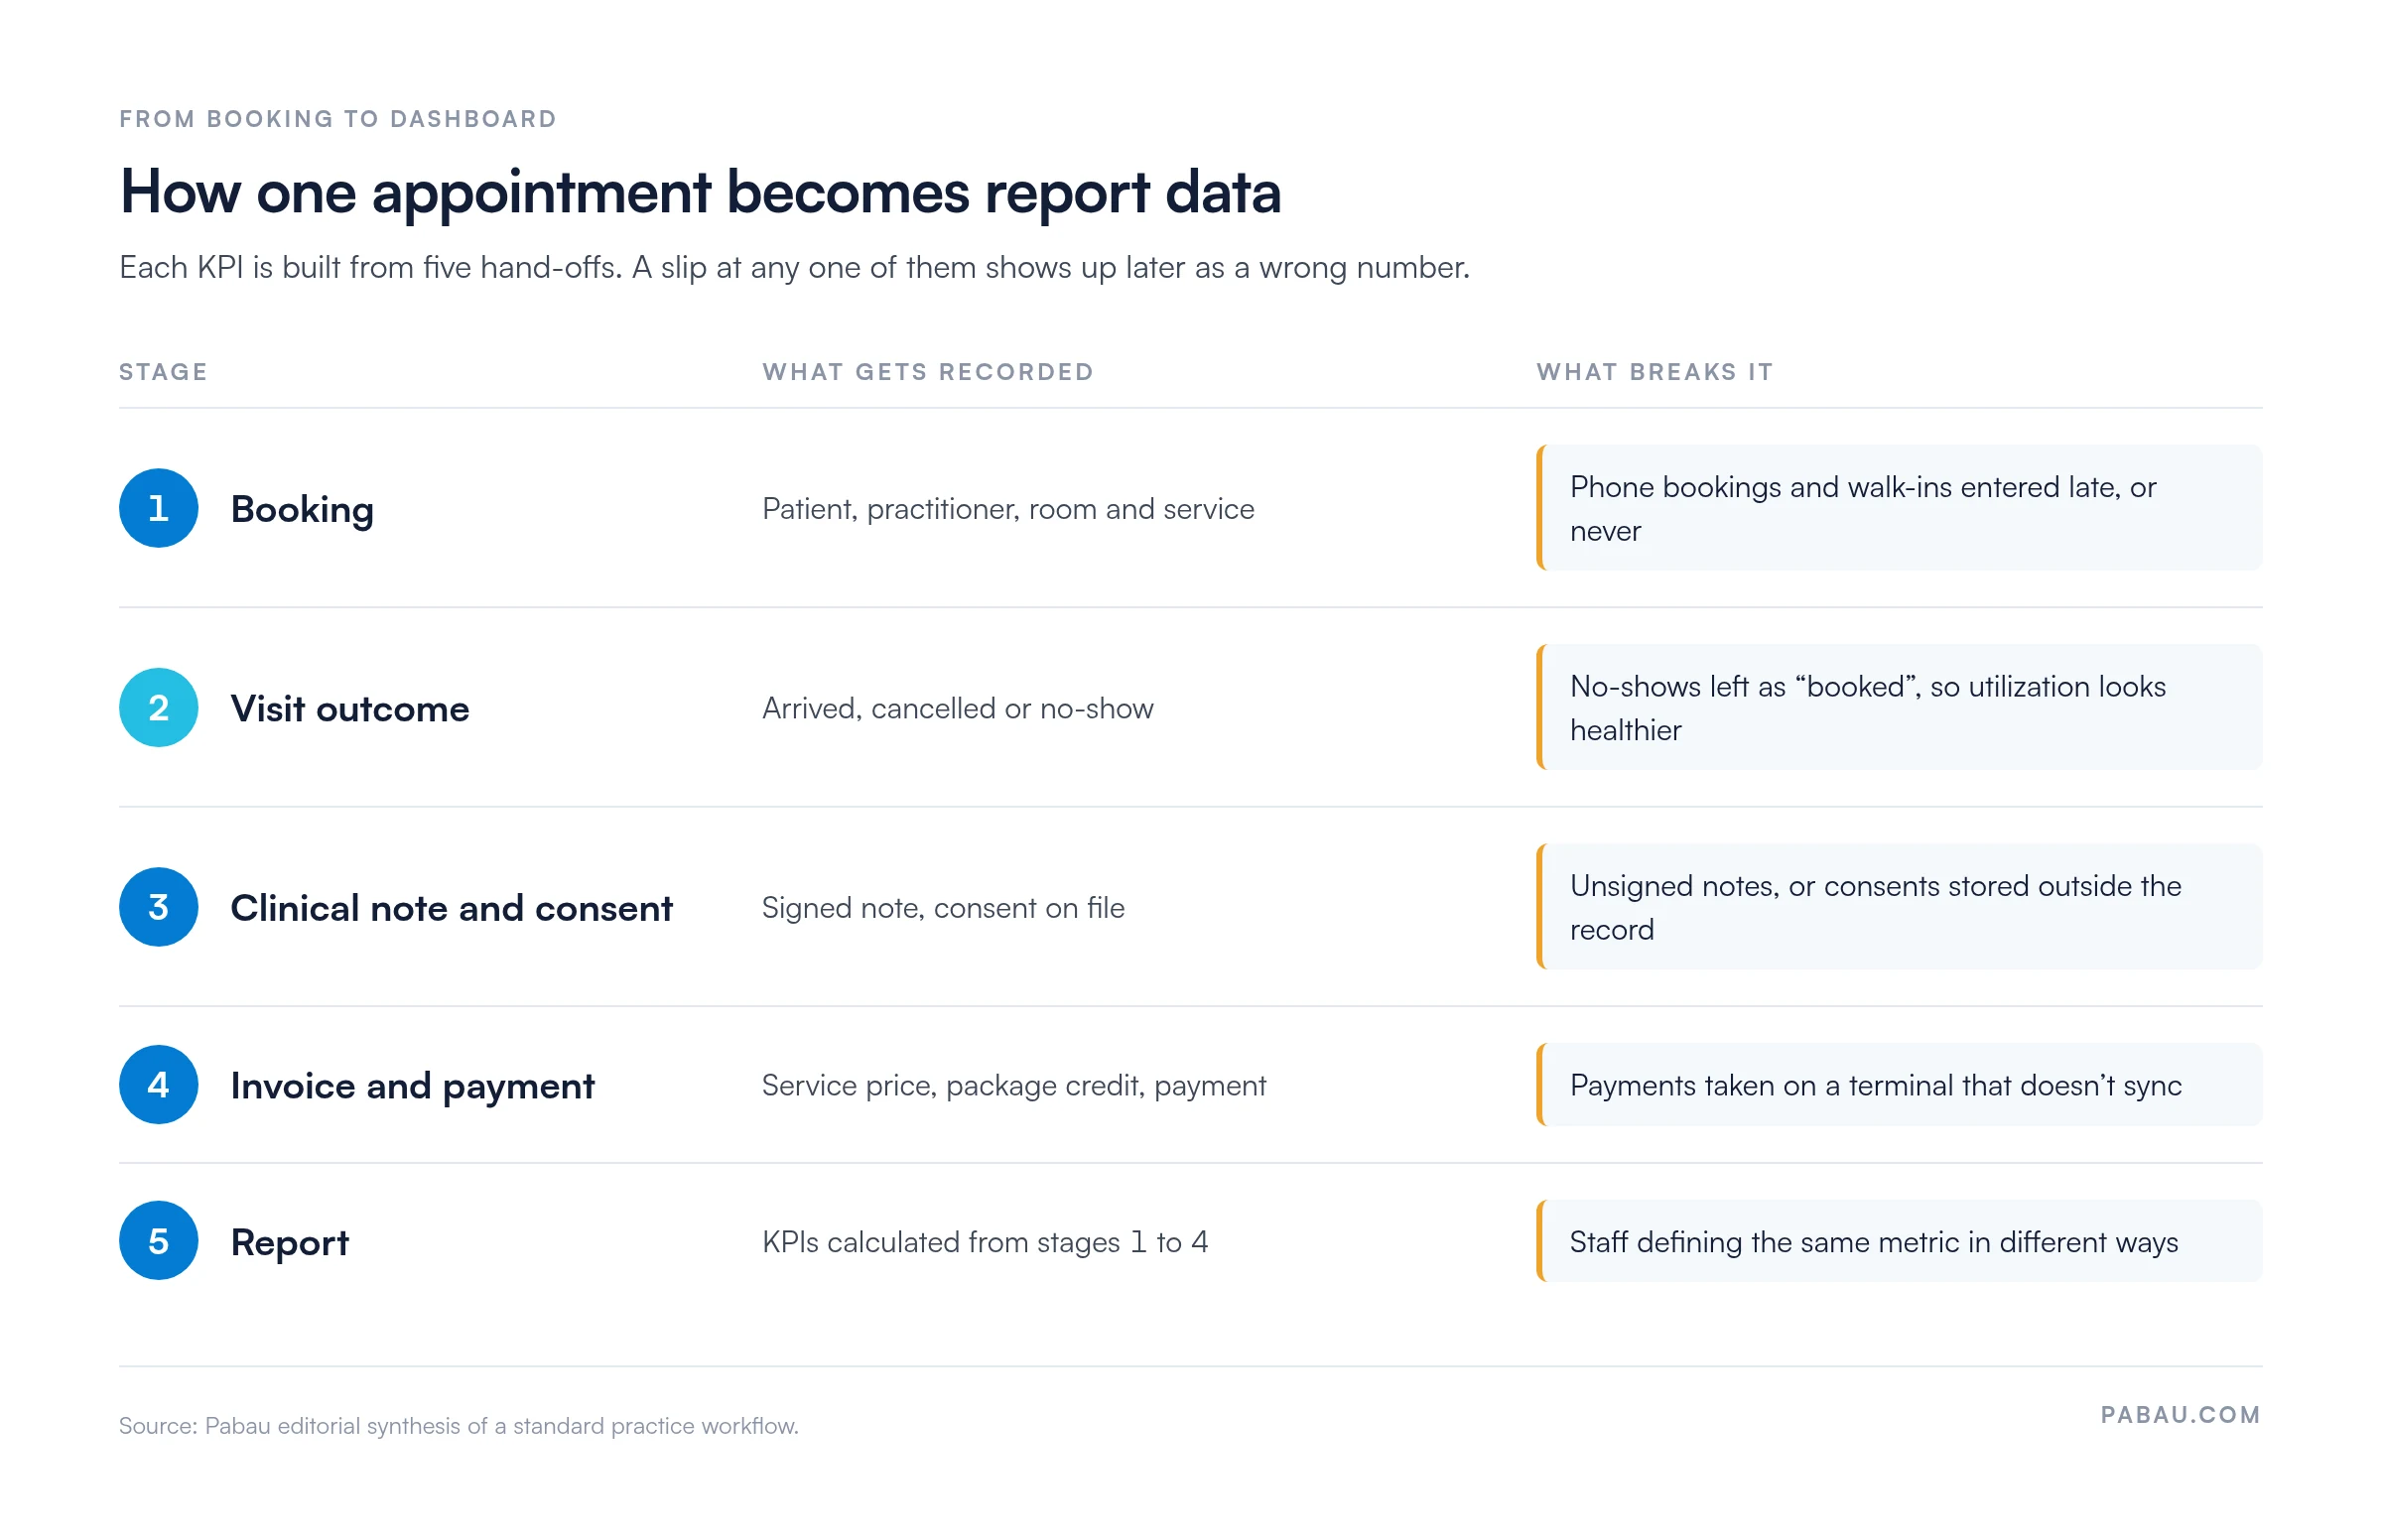
The fix is mostly habit. Close out every appointment before staff go home, so no visit stays in limbo overnight. Then write a one-line definition for each KPI and keep it with the report.
A healthcare dashboard is a live screen that combines several KPIs, usually arranged by role. A dashboard answers the question, what is happening right now? A report answers a different one: what happened last month?
Three dashboard types cover what most practices need:
Good clinic dashboard software gives each role the view that matches their decisions. The common failure is one dashboard for everyone. A practitioner who sees payer denial rates and inventory reorder points next to their schedule will ignore all three. Role-based views are the minimum requirement for adoption.
Build a separate dashboard view for each of three roles. The practice owner gets financial and growth KPIs. The practice manager gets throughput and staff productivity. The clinician gets completion rates and overdue recalls. Share one view across all three, and all three will likely ignore it.
A demo always looks good, because the vendor chooses the data. Ask these six questions before you sign, ideally with your own numbers on screen.
Next, test the connections. Platforms built on HL7 FHIR interoperability standards can exchange data with other certified systems without custom development. That matters when one vendor runs scheduling and another runs billing. If you already use one integrated platform, most of this concern disappears.
Your choice of practice management software decides how much of this checklist comes built in. If you’re comparing systems now, our roundup of the best medical practice software puts the leading options side by side.
EHR integration for reporting follows one of three patterns. The pattern your tool uses decides how timely and reliable your data will be.
Native EHR reporting is built into the EHR itself. It reads from the same database as the clinical records, so there’s no transfer lag and no reconciliation step. The catch is scope. Native reporting rarely reaches scheduling or financial records stored elsewhere.
API or FHIR-based integration connects an outside reporting tool to the EHR through structured data exchange. Federal rules require certified health IT to support FHIR R4 APIs. As a result, most modern EHRs can share patient and encounter data with authorized third-party tools. The trade-off is dependency, since both vendors must keep their APIs working. Our guide to EHR integration explains how these connections work day to day.
Scheduled exports (CSV or flat file) are the legacy fallback. The EHR drops a file on a set schedule, and the reporting tool builds reports from the latest one. The data is always at least one cycle old. Any format change on either side also breaks the pipeline, so avoid this pattern when a FHIR option exists.
Quality reporting means measuring and documenting clinical performance against defined standards. In the US, the main frameworks are CMS MIPS and the clinical quality measures built into certified EHR technology. Accreditation bodies such as the National Committee for Quality Assurance (NCQA) add their own requirements.
Manual quality reporting causes more trouble than extra admin. When staff calculate measures differently, audit results stop matching submitted data. Trends vanish too, because one quarter can’t be compared with the next. Automated tools apply the same measure logic to every encounter, whoever documents it.
For UK private practices, the picture is different. In England, Care Quality Commission (CQC) inspections check that practices monitor outcomes and act on what they find. Tools that log incidents, record corrective actions, and track improvement over time create the evidence inspectors look for.
The American Health Information Management Association (AHIMA) recommends treating data governance as a standing operational function. In practice, that comes down to three habits:
The software is rarely the weak link. These five habits cause most bad reports, and each one has a simple fix.
Many practices still build reports from three or four places: the calendar, the card terminal, a billing tool, and a spreadsheet. Someone exports each one, pastes them together, and spends hours making the appointment counts agree.
Pabau replaces that patchwork. Scheduling, payments, and patient records sit in one practice management app. So the appointment count in a revenue report matches the one in a staff report. Appointment analytics show use by room, practitioner, and service type.
Revenue reports break income down by service, track package redemption, and flag unpaid balances before they age past 30 days. Staff reports show revenue, completed appointments, and commission per team member, which simplifies payroll at multi-location practices.
Retention is where one system pays off most. Pabau tracks when each patient is due back, builds recall lists, and connects them to automated workflows that send rebooking reminders. Your retention report and your recall campaign then read from the same data.
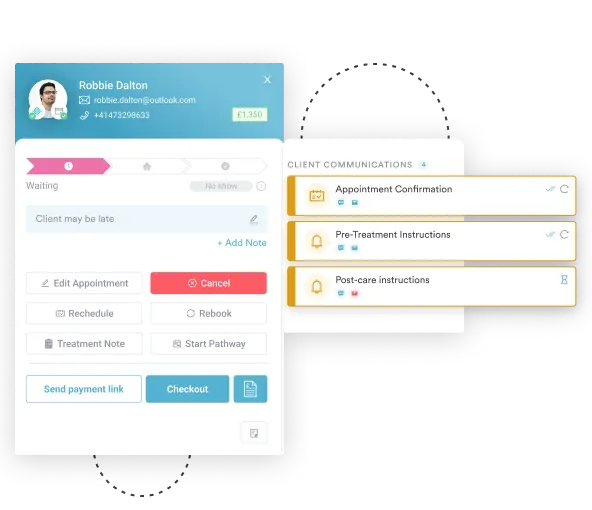

Appointment, revenue, staff, and retention reports built from the same patient records your team already uses. Book a demo to see how Pabau keeps the numbers in step.

Start with the data you already have. Pick the five or six KPIs that would change a decision this month, and define each one in a sentence. Then make sure the front desk closes out every appointment, every day.
After that, judge any reporting tool by one test. Does it read from the same records your team works in all day? A tool that does saves hours of reconciliation. One that doesn’t adds another export to manage, however good its charts look.
Book a demo to see Pabau’s appointment, revenue, staff, and retention reports running from one set of patient records.

Wondering which reports to run first? Important medical practice management reports walks through the reports that tell owners the most about performance.
Outgrowing built-in reporting? Healthcare business intelligence: what it is and where to start explains when a separate BI layer earns its cost.
Connecting reporting to your EHR? What is EHR integration and how to do it covers the integration options in more depth.
Comparing practice software? Essential practice management software features lists what to expect from a modern system, reporting included.
Review operational dashboards daily, financial reports weekly, and clinical quality KPIs monthly. Look at strategic trends, such as retention and revenue per patient, every quarter. Matching the cadence to how fast a number can change stops teams overreacting to one slow day.
Yes, at first. A spreadsheet works for a solo practitioner tracking a few KPIs. It breaks down once several people enter data, because formulas drift and exports go stale. Most practices switch when building the monthly report starts eating into clinical time.
Yes, whenever a report contains protected health information (PHI), such as names linked to treatments. Under HIPAA’s minimum necessary standard, staff should see only the PHI their role needs. Use summary or de-identified reports where you can, and limit who can export patient-level data.
Descriptive analytics reports what already happened, like last month’s no-show rate. Predictive analytics uses past patterns to estimate what comes next, like which patients may miss their next visit. Most practices get more value from reliable descriptive reports before they try prediction.