Surgical clearance form to download: What it is and who completes the form
A surgical clearance form is the document a surgeon uses to record whether a pat...

1
Last Updated: Oct 22, 2026

A blood pressure stroke risk chart maps systolic and diastolic readings to five risk tiers, from normal to hypertensive crisis at 180/120 mmHg.
High blood pressure accounts for roughly 54% of strokes worldwide, and it is the most treatable stroke risk factor a practice can act on.
Where the systolic and diastolic values fall in different rows, the higher category decides the risk tier and the follow-up interval.
A reading of 180/120 mmHg or above needs a repeat after five minutes of rest, then same-day care.
Practice management software like Pabau keeps each reading, its category and the next check date in one client record.
A printable one-page chart mapping all five blood pressure categories to their thresholds, a stroke risk tier and a recommended clinical action. It also carries the measurement steps, the escalation rules at 180/120 mmHg or above, and a serial reading log for the patient record.
Download templateA blood pressure stroke risk chart maps one reading to a stroke risk tier and the clinical action that tier calls for. The five categories start at normal, under 120/80 mmHg, and end at hypertensive crisis, 180/120 mmHg or above.
Hypertension is the most treatable stroke risk factor in primary care, and where a reading lands decides what happens next. That could be reassurance, a recheck in three months, or a same-day escalation.
The full chart sits below, with five steps for using it in the room and the errors that misclassify patients.
The chart is a one-page reference for turning a reading into a decision. It maps systolic and diastolic values, measured in millimeters of mercury (mmHg), to a stroke risk tier and a recommended action.
Five tiers cover the range. Normal sits under 120/80 mmHg, and hypertensive crisis starts at 180/120 mmHg. Elevated, stage 1 and stage 2 hypertension fill the space between, each with its own thresholds.
The American Heart Association calls hypertension the leading controllable stroke risk factor, behind roughly 54% of strokes worldwide.
Two rules keep the chart honest. Where the systolic and diastolic values sit in different rows, the higher category applies. A single raised reading is also not a diagnosis, so confirm it with a repeat or a home reading before you change treatment.
Acute care is the exception. After an ischemic stroke, AHA guidance supports tolerating a higher pressure, typically up to 220/120 mmHg where thrombolytics were not given.
That is permissive hypertension in acute stroke settings, and the chart’s usual actions do not apply there.
Five steps take you from cuff to documented decision. None of them takes long, and skipping the first one is what produces most of the wrong tiers.
Print the chart for the consultation room or keep it inside the record, whichever version gets looked at. Either way, the top tier is the one that has to be right first time.
The flow below is what a reading of 180/120 mmHg or above should trigger.
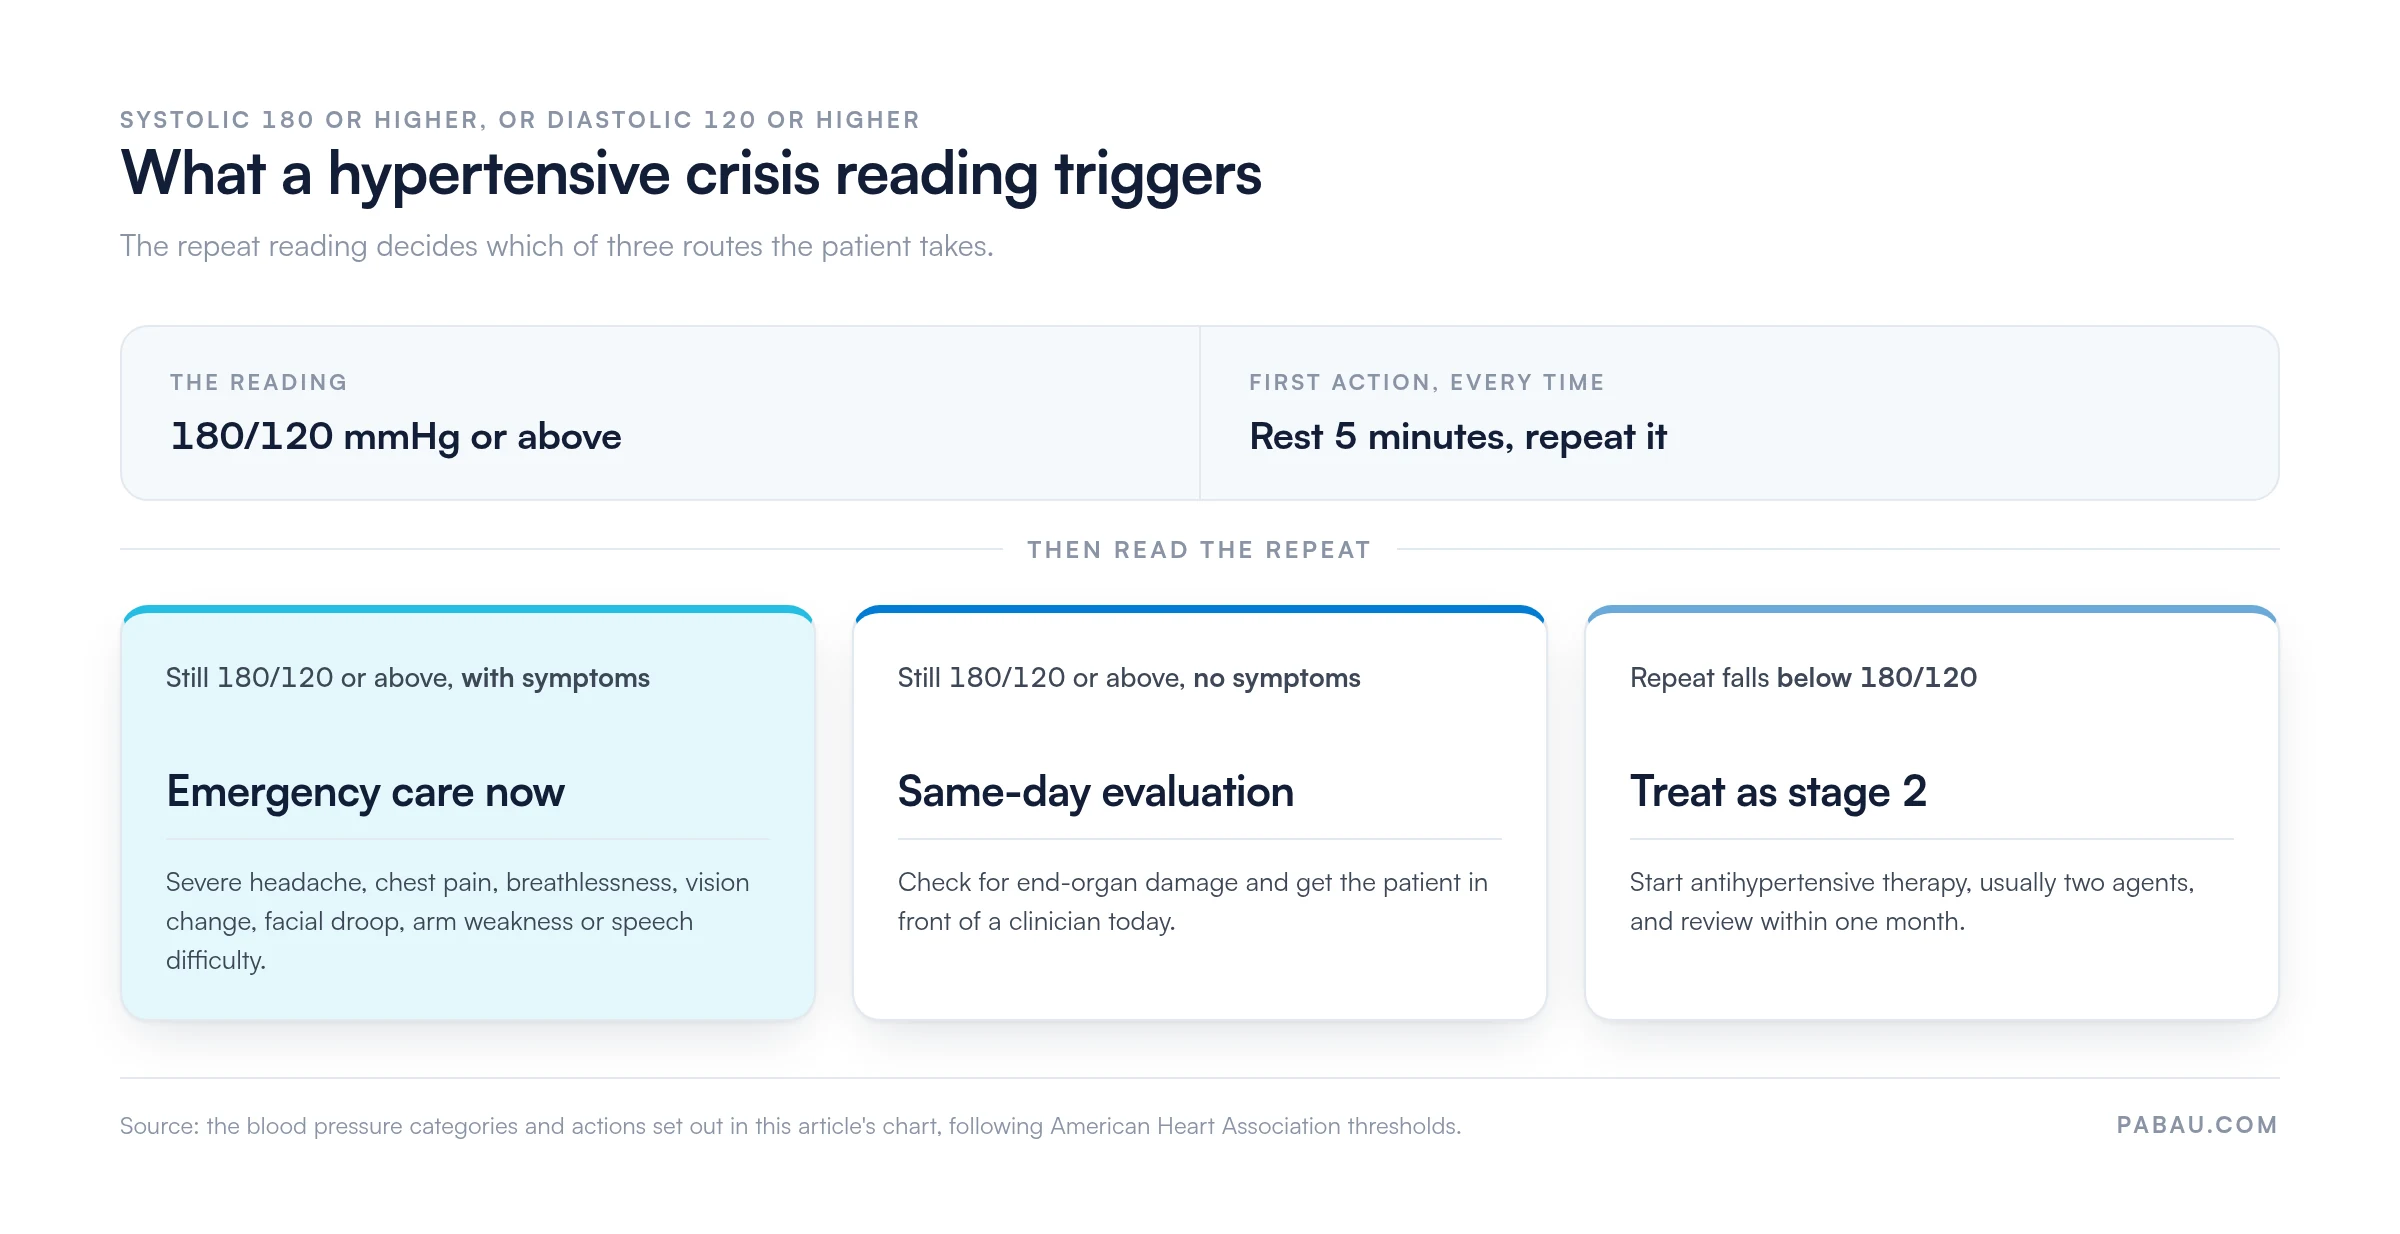
Any team that puts a cuff on an arm can use the chart, but a few settings lean on it hardest. Cardiology practices work through it during hypertension reviews, stratifying risk before they adjust a medication regimen. Internal medicine and primary care reach for it at routine health maintenance visits.
It earns its keep most in patients with diabetes, a prior cardiovascular event, or a family history of stroke. Nurses and physician assistants running pre-operative clearances use it to flag perioperative stroke risk, which then feeds anesthesia planning.
Specialist services push it further. Ambulatory blood pressure monitoring protocols read serial results against the chart, which is how neurology and hypertension services detect masked or white-coat hypertension.
Whether the chart lives on a printed sheet or inside your GP clinic software, the tier is what the rest of the plan hangs on.
Starting or adjusting an antihypertensive is also the moment to check that the product has not been recalled. Match the patient’s drug and lot number against known blood pressure drug recalls before the prescription goes out.
The pathophysiology explains why the tiers sit where they do. Chronically raised pressure damages the endothelium, the inner lining of the blood vessels.
That triggers inflammation and speeds up atherosclerosis, the buildup of fatty plaque in artery walls.
As plaque builds, the vessel narrows. In the cerebral circulation, that narrowing raises the risk of a thrombotic stroke, where a clot blocks a cerebral artery.
High pressure also weakens arterial walls, producing microaneurysms and small-vessel disease, which drive lacunar strokes deep in the brain.
At 180/120 mmHg and above, the pressure can rupture a vessel outright and bleed into the brain, an intracerebral hemorrhage. Hypertensive crisis thresholds mark the point where end-organ damage becomes imminent, which is why that row calls for same-day action.
Headache, vision changes, facial droop, arm weakness and speech difficulty are the stroke warning signs to recognize immediately.
Most misclassifications come from the same handful of habits. Each one is cheap to fix once you know to look for it.
Before you file the reading, check three things. The cuff was calibrated, the patient had rested five minutes, and the category you wrote matches the higher of the two values.
Most practices write the reading on a paper slip and copy it into the record later. The number gets captured twice, and the category behind it usually goes missing on the way. Practice management software like Pabau keeps the reading and the decision you made about it in one place.
A digital form captures both values at the point of care, so they land in the client record with no transcription step. Measurements and tracking charts those values across visits, which is how you separate one raised reading from sustained hypertension. Recalls then book the interval the chart calls for, whether that is six months or the same day.
The record then shows four things in one view. It carries the reading, the category you assigned, the action you took, and the date of the next check. That is what an audit asks for, and it is the history the next clinician needs.
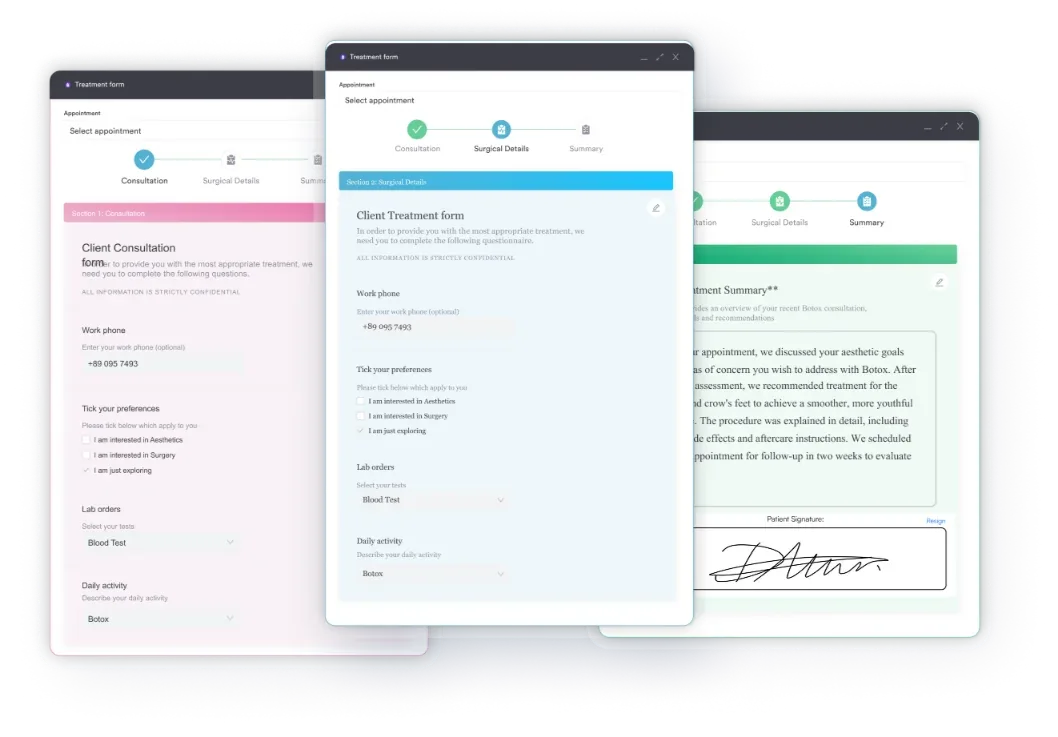

Pabau captures blood pressure readings in the client record and charts them across visits. Follow-up recalls go out on the interval the chart calls for.

The chart earns its place by removing the pause between a reading and a decision. Pin it up, and the same 148/92 mmHg gets the same response from every clinician in the practice.
The part worth remembering is that the tier is only useful once it is written down. A category in the record with a follow-up date attached turns a measurement into stroke prevention. It is also what an inspector can see.
Comprehensive stroke prevention strategies start with that habit. Book a demo to see how Pabau keeps every reading, category and follow-up date in one client record.

Need the baseline categories without the risk tiers? Normal blood pressure chart sets out the thresholds you compare every reading against.
Tracking readings across weeks rather than visits? Blood pressure log gives your practice a home recording sheet you can score at the next appointment.
Seeing pediatric patients too? Pediatric blood pressure chart carries the percentile thresholds that adult categories do not cover.
The interval follows the category. Normal readings wait for the next routine visit, and elevated readings get a recheck in three to six months. Stage 1 needs home readings to confirm it. Stage 2 needs a review within one month. A crisis reading needs same-day contact.
Yes. This chart follows the American Heart Association, which starts stage 2 hypertension at 140/90 mmHg. NICE in the UK calls that reading stage 1, and reaches stage 2 only at a clinic reading of 160/100 mmHg. Note which set you are working from.
Yes. When only the systolic value is raised, the chart still applies, because the higher of the two values sets the category. A reading of 152/78 mmHg falls in stage 2, even though the diastolic value looks fine. This pattern is common in older patients with stiffer arteries.
The American Heart Association recommends a systolic target below 130 mmHg for adults aged 65 and over. A higher target, up to 150 systolic, is reasonable where frailty makes tight control risky. Watch for dizziness and falls, which usually mean the target is too low.
Measure both arms at the first visit, then use the higher-reading arm from then on. A persistent difference above 10 mmHg between arms is worth investigating on its own. Recording which arm you used keeps later readings comparable.