Scapular assistance test: Procedure, interpretation and free template
The scapular assistance test is a manual examination in which the clinician supp...

1
Last Updated: Oct 19, 2026

An ECG quiz tests the same skills as ACLS, PALS, and clinical competency exams: rhythm, interval, and pattern recognition.
Work the same five steps every time: rate, rhythm, axis, intervals, and morphology.
Atrial fibrillation, STEMI, LBBB, and ventricular tachycardia are the highest-yield patterns for exams and for emergencies.
Practice management software like Pabau keeps cardiac investigations, results, and follow-up actions in one patient record.
An ECG quiz is a set of rhythm strips or 12-lead traces with questions attached, so you can practice interpretation with no patient waiting. That repetition is what makes pattern recognition fast. Reading a trace under exam conditions and reading one at 3 AM draw on the same reflex, and the reflex fades without use.
This guide covers the five-step method every quiz is built on. It works through the arrhythmia and 12-lead patterns that get tested most, then the free platforms worth your time. Finally it looks at what happens to your answer once the trace belongs to a patient rather than an examiner.
A good quiz does more than confirm you can name a rhythm. It trains the speed of pattern recognition. That speed is the difference between hesitating over a STEMI and calling the cath lab in under two minutes. Low-stakes practice is also one of the few ways to hold interpretive skill without adding clinical hours to your week.
Quiz formats vary considerably. Some present a single rhythm strip with a multiple-choice answer. Others open with clinical context and show the trace afterwards. The best platforms do both. A bare strip forces pure pattern recognition, while a case scenario forces you to weigh the trace against the patient in front of you.
ECG and EKG refer to exactly the same test. ECG comes from the English “electrocardiogram”, EKG from the German “Elektrokardiogramm”.
The German spelling took hold in North American practice partly to keep it distinct from EEG, the electroencephalogram. Both appear interchangeably in exam materials, certification courses, and clinical notes. This article uses ECG throughout.
From a first-year rhythm strip to an advanced 12-lead case, the underlying framework never changes. Learn the five steps below and you have the scaffold for every interpretation you will ever do.
Before you call anything abnormal, know what normal looks like. The table below is the baseline every quiz works from, per American Heart Association (AHA) standards. Children’s heart rates run higher, and their interval limits shift with age. Our normal ECG values chart covers adult and pediatric ranges in one free PDF.
Arrhythmias account for most questions at ACLS level. Know these patterns cold before you attempt timed strips.
Atrial fibrillation (AF) shows an irregularly irregular ventricular response with absent P waves, replaced by a chaotic fibrillatory baseline. Per the European Society of Cardiology (ESC) AF guidelines, AF is the most common sustained cardiac arrhythmia in clinical practice. Ventricular rate varies widely with AV node conduction and rate-controlling medication.
Ventricular tachycardia (VT) presents as a broad complex tachycardia, with a QRS above 120 ms and a rate usually between 100 and 250 bpm. P waves are often dissociated from the QRS.
The rule to carry into any quiz is simple: treat a broad complex tachycardia as VT until proven otherwise. Calling VT an SVT with aberrancy can be fatal if verapamil follows.
Ventricular fibrillation (VF) produces chaotic, disorganized waveforms with no identifiable P waves, QRS complexes, or T waves. It is a shockable arrest rhythm. Supraventricular tachycardia (SVT) is a narrow complex tachycardia, with a QRS below 120 ms, a regular rhythm, and no clear P waves between complexes.
Premature ventricular contractions (PVCs) appear as wide, bizarre QRS complexes arriving early, with no preceding P wave.
Two measurements do most of the sorting. Take the QRS width first, then decide whether the rhythm is regular, and four of the highest-yield strips separate out on their own.
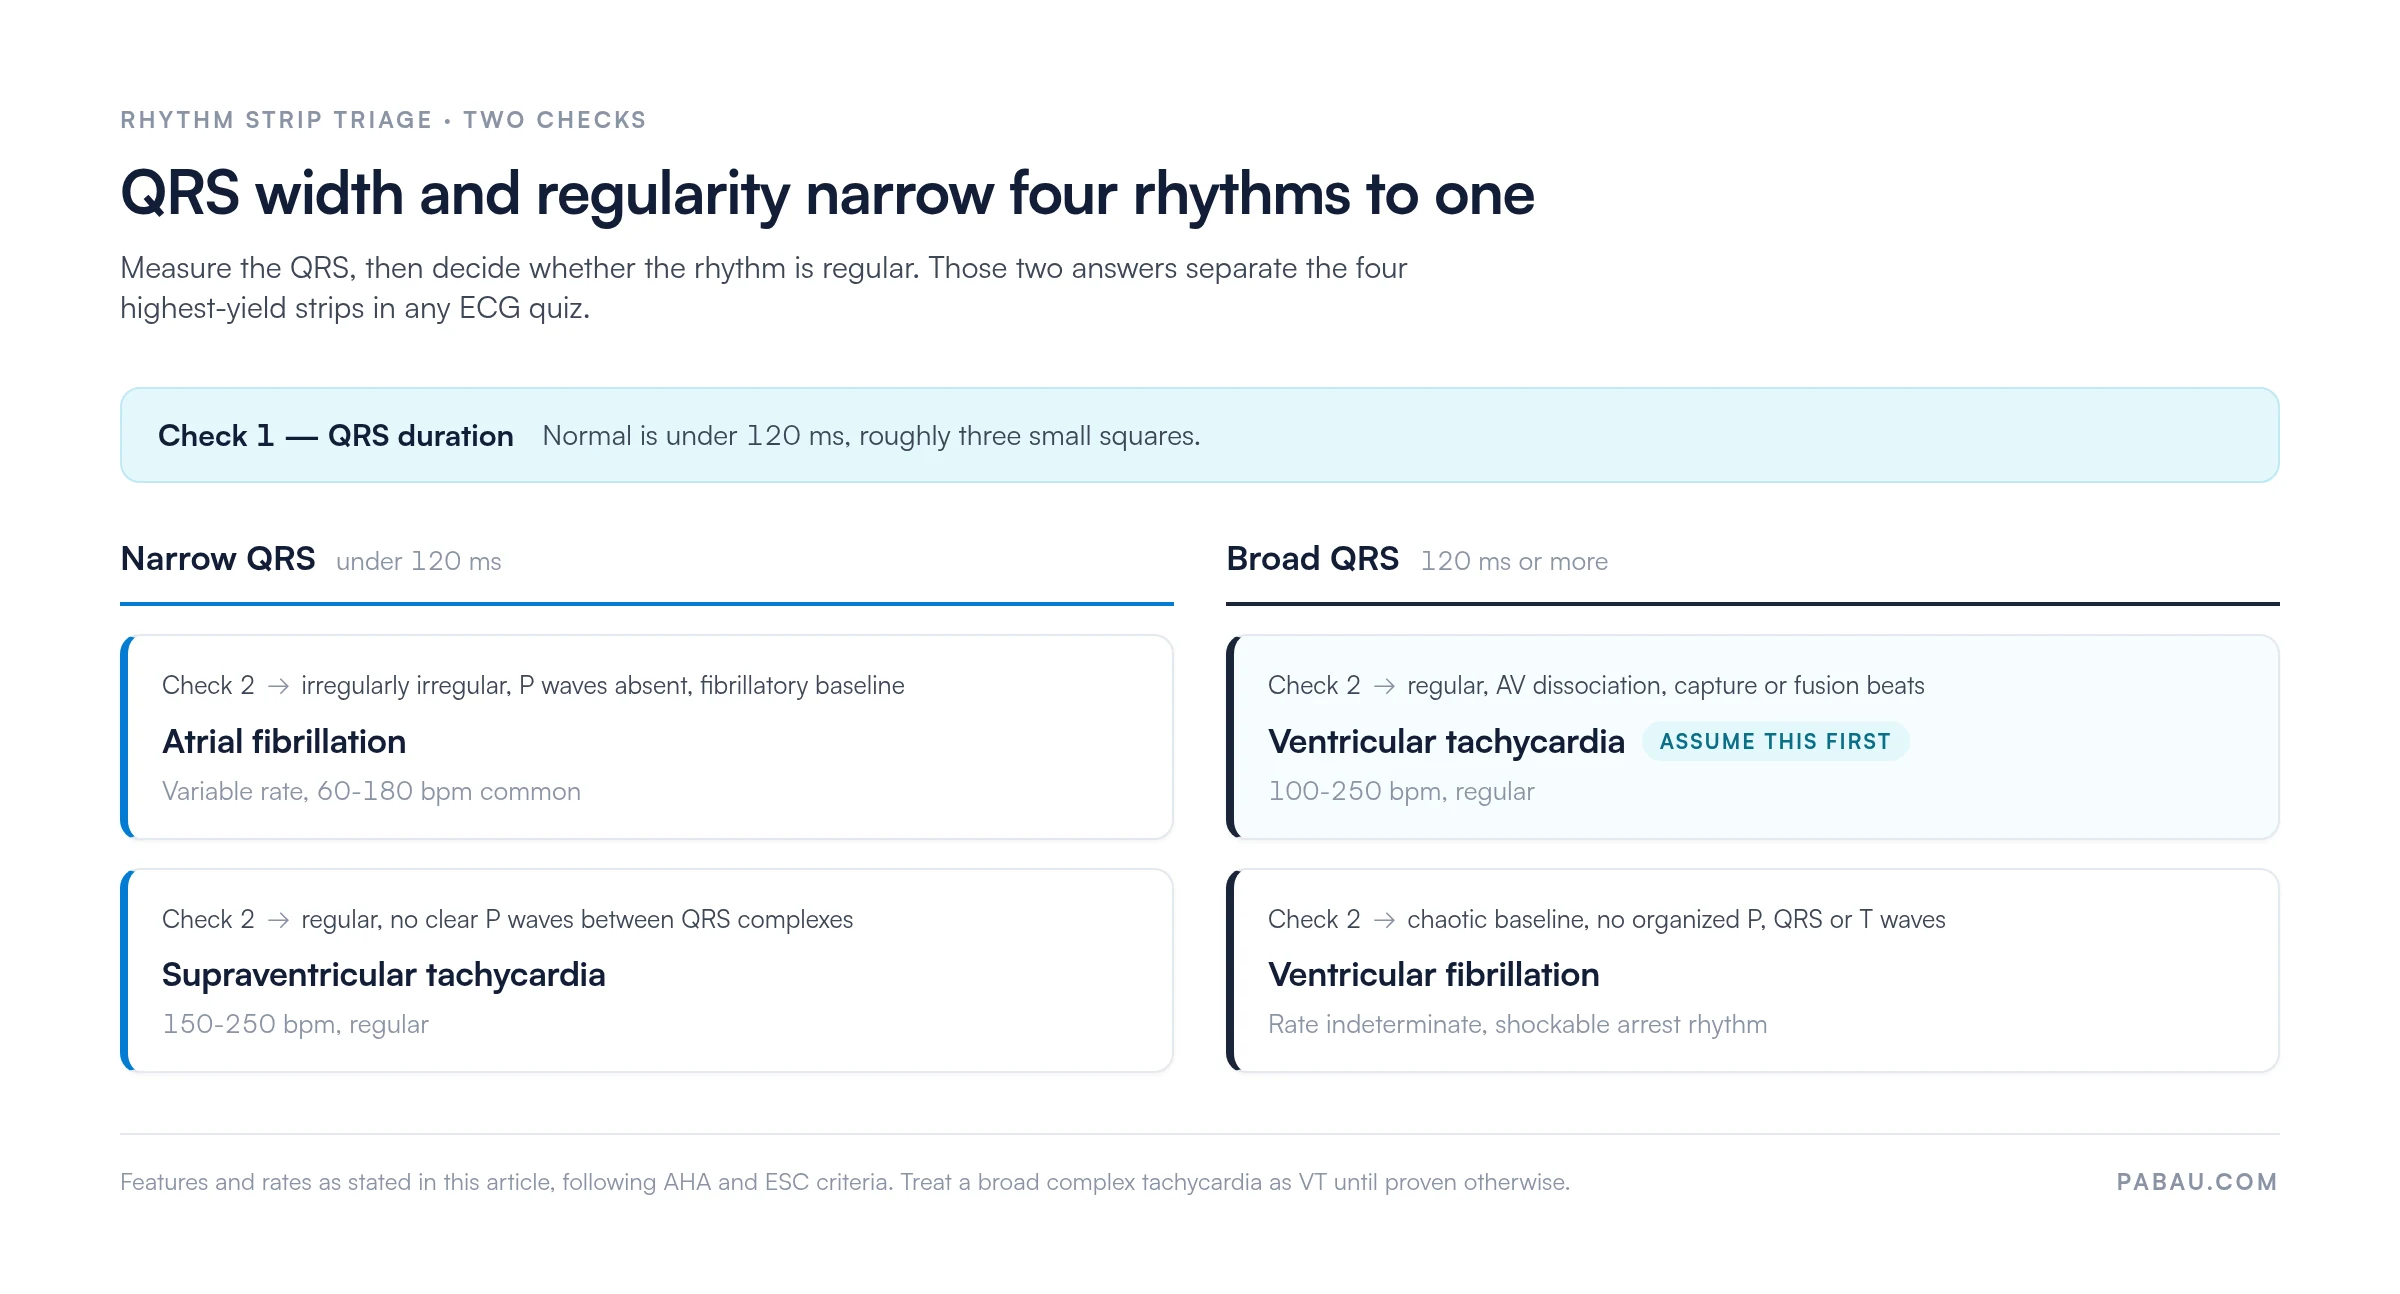
Judge regularity with a piece of paper, not by eye. Mark three consecutive R waves along the edge, then slide the paper down the strip. If the marks stop lining up with the R waves, the rhythm is irregular, and half the differential disappears with it.
Moving from rhythm strips to the full 12-lead is where most learners slow down. The patterns below carry the most weight in medical finals, MRCP, and emergency medicine competency assessments. They are also the ones a primary care clinician meets first, often on a trace recorded for something else entirely.
Under AHA/ACC and ESC STEMI criteria, ST elevation is diagnostic at 1 mm or more in two contiguous leads. Leads V2 and V3 are the single exception, and their threshold is adjusted for sex and age:
Every other lead uses the same 1 mm cutoff as the limb leads, including V1 and V4 to V6. Applying the V2 and V3 numbers across the whole precordium is the mistake that turns a normal trace into a false positive.
Reciprocal ST depression in leads facing the wall opposite the infarct territory confirms a STEMI and helps localize it. Alongside the trace, a troponin levels chart gives you the biochemical half of the picture at the timings that matter.
Pericarditis is the STEMI mimic worth knowing best. Look for saddle-shaped ST elevation, concave upward, across multiple leads with no reciprocal changes, plus PR depression that is clearest in lead II. Brugada pattern shows coved or saddleback ST elevation in V1 and V2 without the territorial distribution a STEMI produces.
Both LBBB and RBBB produce a broad QRS of 120 ms or more. The WiLLiaM MaRRoW mnemonic, consistent with ESC and AHA criteria, is still the fastest way to separate them under time pressure.
In LBBB, lead V1 shows a dominant S wave (a W shape) and V6 shows a dominant R wave (an M shape). In RBBB the pattern reverses: V1 shows an RSR’ pattern (M) and V6 shows a broad S wave (W).
LVH is called on voltage criteria. Sokolow-Lyon is the one most quizzes test: the S wave in V1 plus the R wave in V5 or V6 exceeding 35 mm. ECG has only moderate sensitivity here, so voltage criteria need clinical context beside them. In practice an echocardiogram test is what confirms or rules out the hypertrophy a trace suggests.
These platforms are the most clinically robust free options, and each suits a different learner. The comparison below covers format, level, and best use, so you can pick one instead of working through all six.
LITFL and ECG Wave-Maven are the two platforms cardiology and emergency medicine educators cite most. LITFL’s 150 cases each carry the trace, the clinical context, and an explanation written at senior registrar level.
ECG Wave-Maven, built at Beth Israel Deaconess Medical Center, tracks which cases you have completed, which makes it the better choice for structured self-assessment. For ACLS rhythm work, ACLS Algorithms stays narrowly on the shockable and non-shockable rhythms that certification scenarios use.
Interpretation is the clinical half of the job. The other half starts once the trace belongs to a patient. Ordering the ECG, receiving the result, and recording what you did about it are three separate steps in most practices. The handoffs between them are where results go missing. Practice management software like Pabau holds all three steps in one place.
Pabau’s patient record management keeps investigation results, clinical notes, and follow-up actions on the same file. Nobody has to remember which inbox a result landed in.
Digital intake forms collect cardiac history before the consultation starts. You spend the appointment reading the trace instead of re-collecting what the practice already holds.
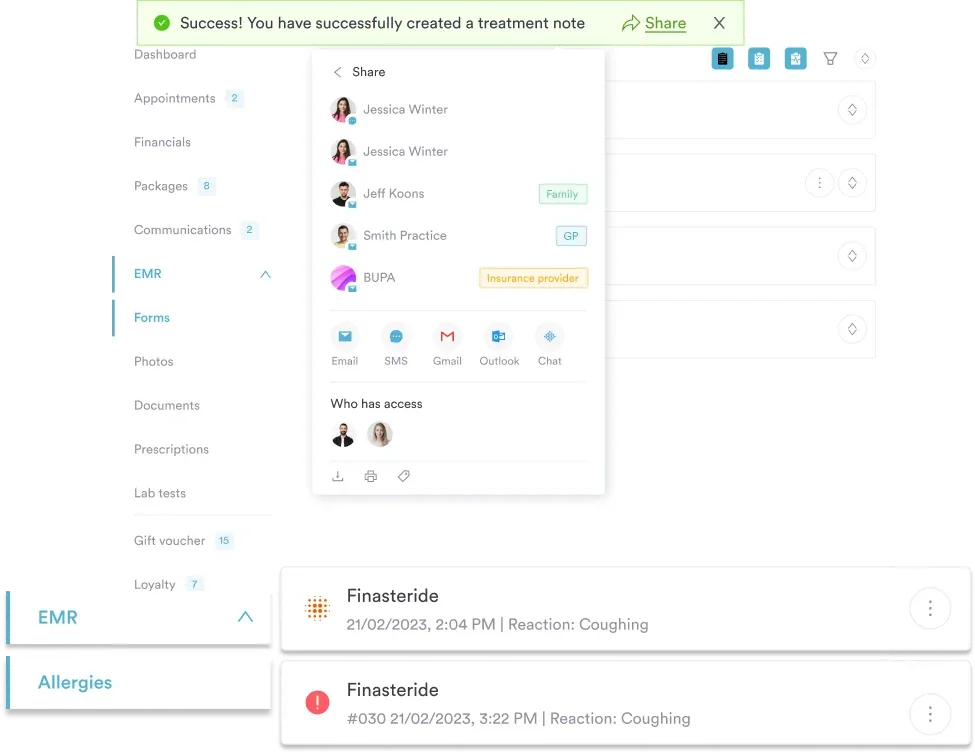
Pabau Scribe, our AI scribe, drafts the post-consultation note so you can write safer clinical notes that record your reasoning and not just your conclusion. That distinction earns its keep when a colleague reviews your reading, or when the trace and the note travel to a secondary care team together.
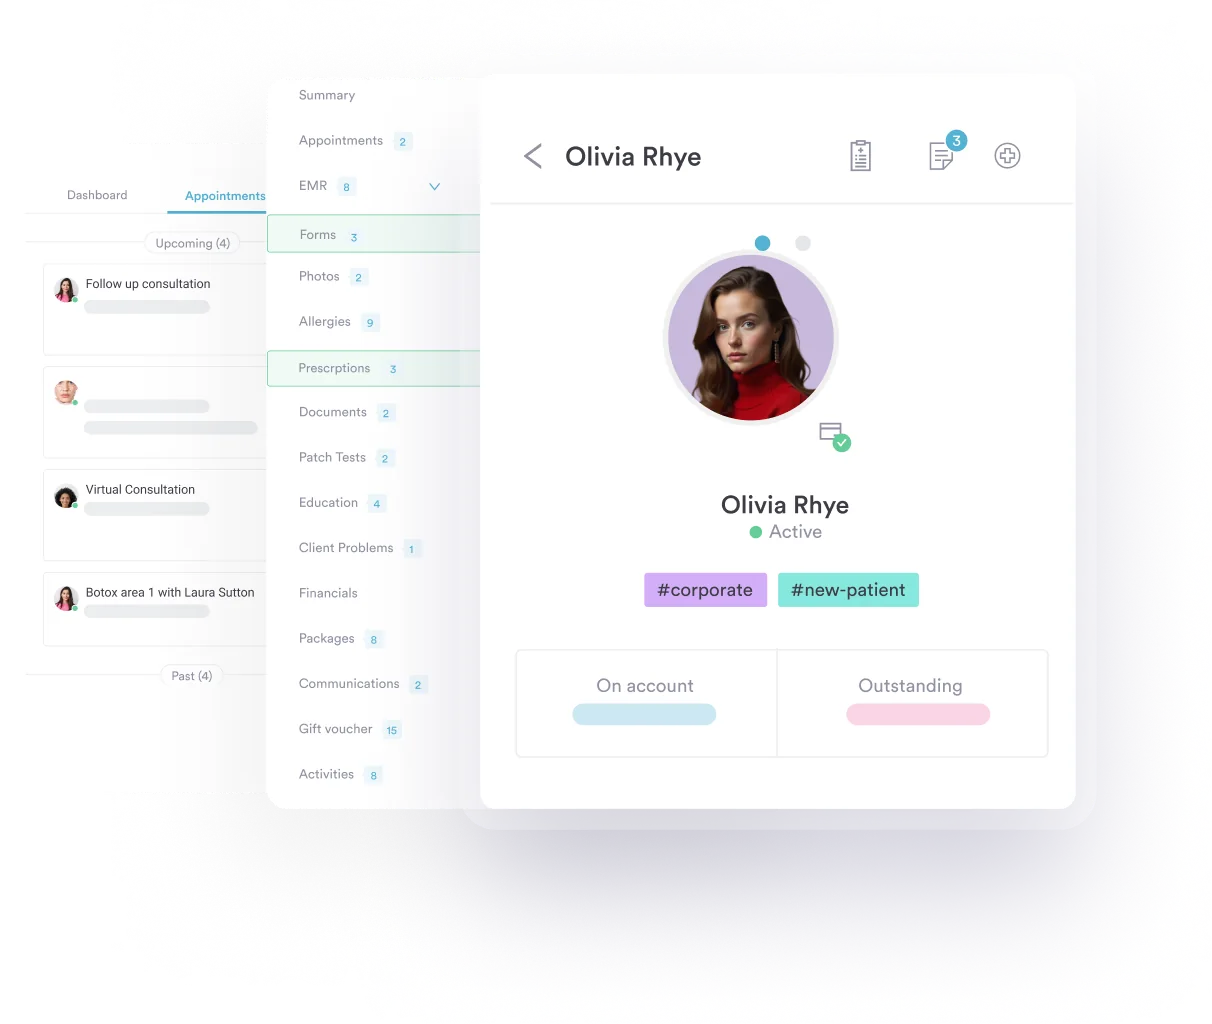
For software for GP practices, the outcome is one connected workflow instead of three disconnected ones. Ordering, result receipt, and documented follow-up sit in the same record, so the clinical skill you sharpen on practice strips has somewhere reliable to land.

Pabau holds the ECG order, the result, the clinical note, and the follow-up action on a single patient file. Your team stops chasing results between inboxes, and no investigation closes without a documented next step.

ECG interpretation decays when it is not used, and no amount of reading replaces the repetition of working strips. Twenty minutes a week on LITFL or ECG Wave-Maven will hold the skill better than a weekend course once a year. Start with normal values, add arrhythmia recognition, then layer the 12-lead patterns on top.
The trade-off worth remembering is that speed and safety pull in different directions. Quizzes reward the fast call, and clinical work rewards the one you can defend afterwards. Practice for speed, then write the note that shows how you got there.
The documentation side of that is where a practice either supports its clinicians or quietly works against them. Book a demo to see how Pabau keeps ECG orders, results, and follow-up actions on one patient record.

Working up chest pain rather than a rhythm? Heart attack test walks through the investigations that sit either side of the ECG in a suspected infarct.
Assessing cardiac risk before surgery? RCRI cardiac risk index calculator guide scores perioperative risk from findings you already collect.
Need the hemodynamics behind the rhythm? Cardiac output formula shows how rate and stroke volume combine, and why a fast rhythm can still perfuse badly.
Recording observations alongside the trace? Abnormal vital signs chart gives you the thresholds and a chart to document them against.
An ECG quiz is a structured practice exercise built from electrocardiogram traces, usually rhythm strips or 12-lead ECGs. The questions test your ability to identify rhythms, measure intervals, and recognize pathological patterns. Formats run from a single multiple-choice strip to case-based scenarios with clinical context. Medical students, nurses, paramedics, and clinicians use them to build and hold interpretation skill outside live clinical encounters.
ECG and EKG refer to exactly the same test. ECG comes from the English word “electrocardiogram”, and EKG from the German “Elektrokardiogramm”. Both are used interchangeably in clinical settings, textbooks, and exam materials. There is no clinical difference between the two abbreviations.
Two features carry the diagnosis. P waves are absent, replaced by a chaotic fibrillatory baseline, and the ventricular response is irregularly irregular with no consistent RR interval. Rate is variable. Even a short run of regularity inside what looks like AF should make you reconsider the diagnosis. Per ESC AF guidelines, those two features together are enough for an ECG diagnosis.
Work the same five steps in the same order. First the rate, calculated from the RR interval. Second the rhythm, judging regularity and P wave presence. Third the axis, from leads I and aVF. Fourth the intervals: PR, QRS, and QTc. Fifth the morphology, assessing ST segments, T waves, and QRS shape in every lead. Holding that order is what stops you missing findings.
ECG Wave-Maven from Harvard Medical School is the top pick for medical students. It covers beginner through advanced cases, tracks your progress, and carries faculty-written explanations. LITFL ECG Cases, with 150 cases and full clinical context, is better once you are past the basics and preparing for finals or postgraduate exams. The University of Utah ECG Learning Center sorts quizzes by category and difficulty, which suits systematic learning from the ground up.
Several platforms provide downloadable practice materials. Practical Clinical Skills and ACLS Algorithms both offer printable strips and reference guides. LITFL case write-ups can be saved as PDFs through your browser’s print function. ACLS certification prep sites often bundle strips with answer keys in their free study materials. Check each platform’s download or print options, because availability varies.