


Mental Health & Therapy Speech Therapy
Penetration Aspiration Scale Template
Penetration Aspiration Scale Template Overview The Penetration Aspiration Scale ...
March 17, 2026

Buy now, pay later is now available in Pabau

Download our free quick-reference worksheet with quadrant definitions, classification ranges, and a fillable patient scoring record.
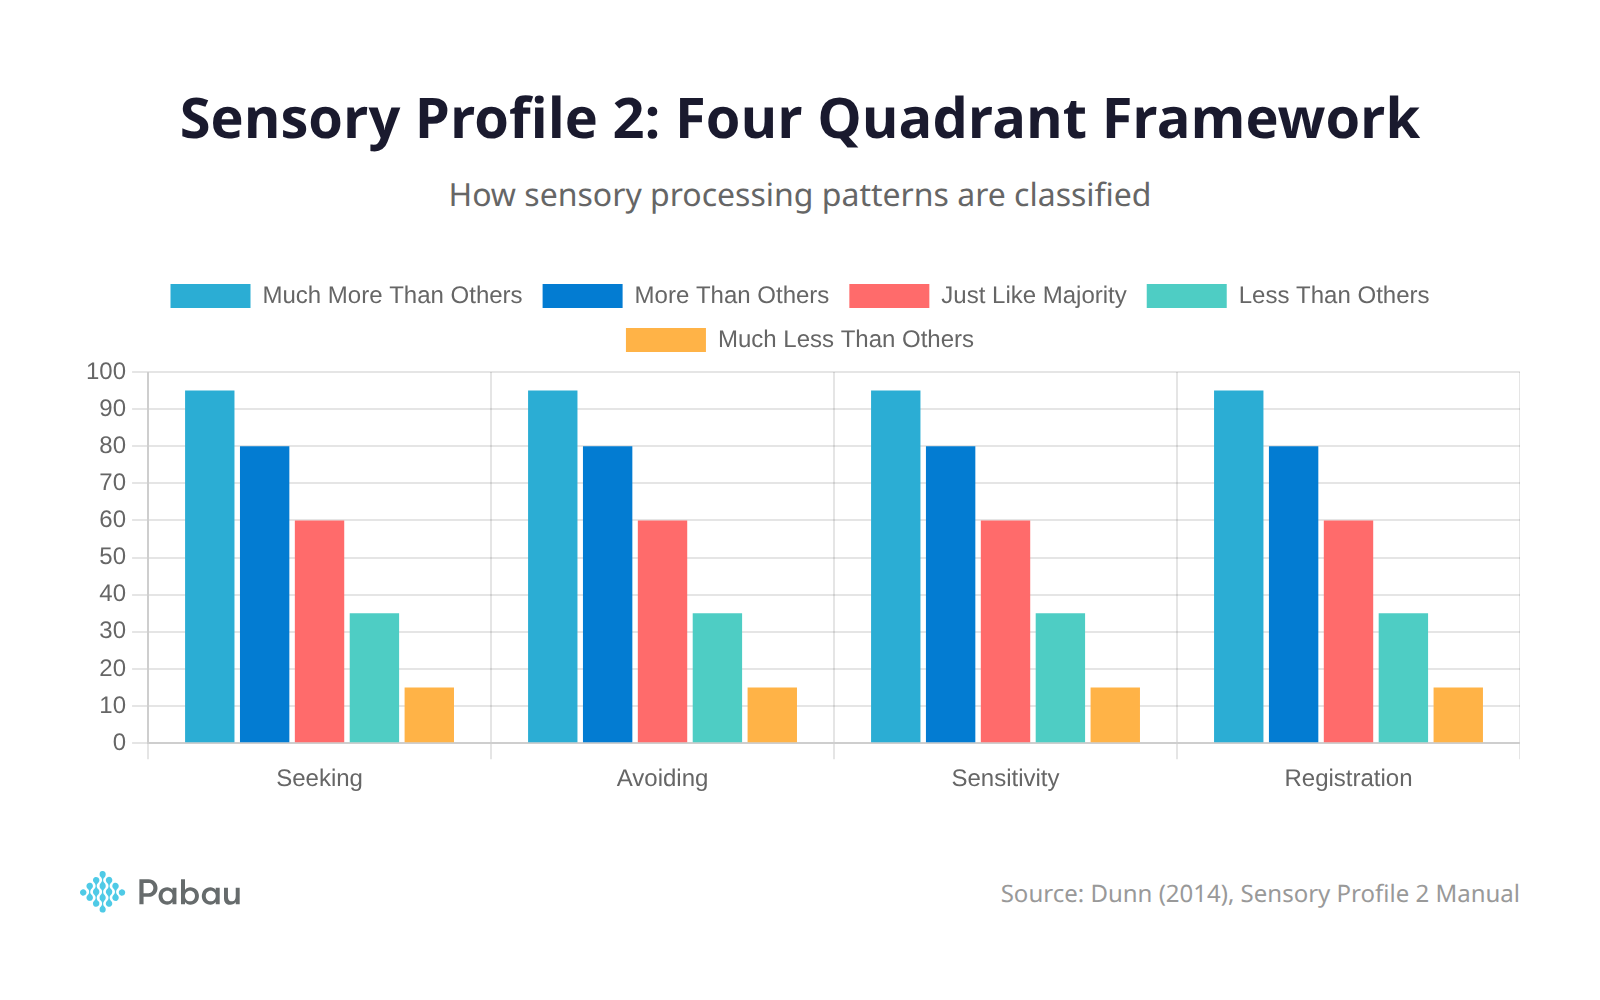
The Sensory Profile 2 measures four quadrants: Seeking, Avoiding, Sensitivity, and Registration
Scores are classified into five categories from Much Less to Much More Than Others based on normative data
Accurate interpretation requires comparing raw scores against age-matched norms, not using fixed cut-offs
Combining quadrant scores with caregiver observations gives the most clinically useful picture
Regular reassessment tracks progress and guides intervention adjustments over time
Sensory Profile 2 scoring interpretation is one of the most practical skills an occupational therapist can master. Developed by Winnie Dunn and published by Pearson Clinical, this standardised assessment helps clinicians understand how a person processes sensory information in daily life. However, translating raw numbers into meaningful clinical recommendations requires more than reading a score sheet.
In this guide, you will learn how each quadrant works, what the five classification levels mean, and how to turn Sensory Profile 2 results into targeted intervention plans. Whether you work with children, adolescents, or adults, the interpretation framework remains consistent across all age-based forms.
The Sensory Profile 2 is a caregiver or self-report questionnaire that evaluates sensory processing patterns. First published in 1999 and revised in 2014, the assessment is grounded in Dunn's Model of Sensory Processing, which organises responses along two continua: neurological threshold (high to low) and behavioural response (passive to active).
In practical terms, this means the tool captures how much sensory input a person notices and what they do about it. The assessment comes in several forms depending on age:
Each form uses a five-point Likert scale where respondents rate how frequently specific behaviours occur: Almost Never, Seldom, Occasionally, Frequently, or Almost Always. The resulting scores feed into four sensory processing quadrants.
The heart of Sensory Profile 2 scoring interpretation lies in understanding these four quadrants. Each represents a distinct combination of neurological threshold and behavioural response.
Seeking reflects how actively a person pursues additional sensory input. Individuals who score high on Seeking crave movement, touch, sound, and intense sensory experiences. For example, a child might constantly spin, hum, chew on objects, or seek out strong flavours.
In clinical practice, high Seeking scores suggest the person's nervous system requires more stimulation to maintain an optimal level of arousal. Consequently, intervention often involves structured sensory diets that provide regular access to movement breaks, proprioceptive activities, and tactile experiences.
Avoiding measures the degree to which a person actively limits or controls sensory input. High Avoiding scores indicate a person who resists new textures, withdraws from loud environments, or becomes distressed by unexpected touch.
For instance, a patient who insists on wearing only soft clothing, covers their ears in crowded spaces, or follows rigid routines to control sensory input would typically score high on Avoiding. Therefore, interventions focus on gradually expanding tolerance, providing advance warning of sensory changes, and creating predictable environments.
Sensitivity captures how readily a person detects and reacts to sensory stimuli without actively trying to manage the input. High Sensitivity scores mean the person notices subtle environmental changes that others miss entirely.
As a result, someone with elevated Sensitivity might be distracted by background noise, notice faint smells, or become overwhelmed by visual clutter. The key distinction from Avoiding is that sensitive individuals do not necessarily take action to escape the stimulus. Instead, they simply notice it more and may become distracted or irritable.
When interpreting Sensitivity versus Avoiding scores, pay close attention to the behavioural response. Both involve low neurological thresholds, but Avoiding shows active escape behaviours while Sensitivity shows passive detection without deliberate action.
Registration reflects how much sensory input a person misses or fails to notice. High Registration scores suggest the person needs more intense or prolonged stimulation before they respond.
Similarly, a child who does not respond when their name is called, seems unaware of pain, or misses visual cues may score high on Registration. In practice, these individuals benefit from enhanced sensory input, such as firmer touch, louder verbal cues, and more visually distinct materials.
Understanding the raw scoring process is essential for accurate Sensory Profile 2 scoring interpretation. Each item on the questionnaire receives a score from 1 (Almost Never) to 5 (Almost Always). Items are grouped by quadrant, and the raw scores within each quadrant are summed.
The process is straightforward. For each quadrant, add together all item scores assigned to that category. The Child Sensory Profile 2, for example, contains 86 items distributed across the four quadrants plus sensory processing sections (Auditory, Visual, Touch, Movement, Body Position, and Oral).
Additionally, section-level scores provide more granular insight into which specific sensory systems contribute most to the overall quadrant pattern.
Raw scores alone carry limited meaning. The Sensory Profile 2 converts raw scores into classifications by comparing them against normative data collected from a large, demographically representative sample. This comparison places each individual into one of five categories:
| Classification | Meaning |
|---|---|
| Much Less Than Others | Scores fall well below the normative mean (bottom ~2%) |
| Less Than Others | Scores are below the normative mean (~2-16%) |
| Just Like the Majority | Scores fall within the typical range (~16-84%) |
| More Than Others | Scores are above the normative mean (~84-98%) |
| Much More Than Others | Scores fall well above the normative mean (top ~2%) |
These percentile ranges are approximate and vary slightly by age group and form. Always reference the scoring tables in the official manual for precise cut-off values.
Never rely on memory for classification cut-offs. The normative tables differ across age bands and forms. Keep the Sensory Profile 2 manual open during scoring to ensure you reference the correct age-matched norms.
Once you have calculated quadrant scores and assigned classifications, the real clinical work begins. Follow this systematic approach to extract meaningful insights from the data.
Start by examining all four quadrant classifications together. A single elevated quadrant tells a different story than multiple elevated quadrants. For example, high Seeking combined with high Avoiding suggests a sensory-conflicted profile where the person simultaneously craves and resists stimulation.
In contrast, isolated high Registration with all other quadrants in the typical range may point to a more straightforward sensory underresponsivity pattern.
After reviewing quadrant-level data, drill into the sensory section scores (Auditory, Visual, Touch, Movement, Body Position, Oral). These reveal which specific sensory systems drive the quadrant-level pattern.
For instance, a child with high overall Sensitivity might show elevated scores only in Auditory and Visual sections, while Touch and Movement remain typical. This specificity directly informs intervention planning because you can target auditory and visual accommodations rather than applying a broad sensory approach.
When multiple caregivers or settings complete the assessment, compare their results. A child who scores as “More Than Others” on Avoiding at school but “Just Like the Majority” at home may be experiencing environment-specific sensory challenges. This comparison highlights the importance of context in Sensory Profile 2 scoring interpretation.
Standardised scores provide a structured foundation, but clinical observation adds depth. During your assessment sessions, note whether the person’s observed behaviours align with caregiver-reported scores. Discrepancies may indicate caregiver reporting bias, environmental factors, or behaviours that emerge only in specific contexts.
“Since switching to Pabau, our documentation workflow has become far more efficient. Having assessment results, clinical notes, and treatment plans all in one system means we spend less time on paperwork and more time with our patients.”

Certain quadrant combinations appear frequently in clinical practice. Recognising these patterns accelerates your interpretation and treatment planning.
This combination suggests a person who both misses sensory input and actively seeks it when they do notice a deficit. These individuals may appear inconsistent, sometimes seeming disengaged and other times displaying intense sensory-seeking behaviours. Consequently, structured sensory diets with scheduled proprioceptive and vestibular input work well for this profile.
When both low-threshold quadrants are elevated, the person detects sensory input easily and actively works to limit exposure. This pattern often presents as rigid routines, emotional meltdowns in overstimulating environments, and resistance to transitions. Environmental modifications and gradual exposure strategies are typically the most effective interventions.
A flat profile does not necessarily mean the person has no sensory challenges. It may indicate that sensory processing difficulties are subtle, context-dependent, or compensated for by learned strategies. In these cases, section-level scores and qualitative observations become especially important.
When three or four quadrants show atypical scores, the sensory processing profile is complex. These individuals often benefit from comprehensive health coaching CPT codes that address multiple sensory systems simultaneously.
Effective Sensory Profile 2 scoring interpretation always leads to actionable recommendations. Here is how each classification level informs your clinical approach.
Individuals who score at this level demonstrate significantly fewer behaviours in that quadrant than their peers. For Seeking, this might mean a child who is unusually passive and rarely initiates sensory exploration. Interventions should gently introduce varied sensory experiences and monitor tolerance.
Scores at this level warrant monitoring rather than intensive intervention. Keep the pattern in mind during treatment planning and reassess periodically to determine whether the profile shifts over time.
No sensory-specific intervention is typically needed for quadrants scoring in this range. However, document these scores as a baseline for future comparison.
This classification indicates a pattern worth addressing through targeted strategies. For example, a child scoring “More Than Others” on Avoiding may benefit from pre and post care instructions that prepare them for sensory aspects of upcoming appointments.
This level requires priority intervention. The individual’s sensory processing significantly differs from peers, and accommodations should be integrated across home, school, and clinical environments. Consider developing written sensory strategies that caregivers and teachers can implement consistently.
Managing Sensory Profile 2 assessments alongside other clinical documentation can be time-consuming. Modern practice management software helps clinicians reduce administrative burden by centralising assessment records, treatment notes, and care plans in one system.
For instance, digital forms can collect caregiver questionnaire responses before appointments, saving valuable face-to-face time for clinical observation and interpretation. Additionally, automated workflows can trigger reassessment reminders based on treatment milestones.
Set up automated reminders for Sensory Profile 2 reassessments every 3 to 6 months. Tracking score changes over time provides objective evidence of intervention effectiveness and helps justify continued services to insurers.
Tracking patient measurements over time also allows you to visualise how quadrant scores shift as interventions take effect. This data-driven approach strengthens clinical decision-making and provides clear evidence for progress reports.
Even experienced clinicians sometimes fall into these traps when interpreting Sensory Profile 2 results.
The normative data differs by age band. A raw score of 45 on the Seeking quadrant might classify as "More Than Others" for a four-year-old but "Just Like the Majority" for a seven-year-old. Always use the correct age-matched normative table.
Sensory processing is not static. A child may present very differently at home versus school, during structured versus unstructured activities, or when well-rested versus fatigued. Therefore, a single administration captures only one snapshot.
Scores that fall at the boundary between two classifications should be interpreted cautiously. A borderline score between "Just Like the Majority" and "More Than Others" warrants monitoring rather than immediate intervention.
High scores on Seeking do not automatically require a sensory diet. The intervention should address functional challenges, not normalise scores. Focus on whether the sensory pattern creates barriers to participation in daily occupations.
Regular reassessment is fundamental to evidence-based practice. Consider readministering the Sensory Profile 2 in these situations:
Comparing scores across timepoints through client management systems provides objective evidence of progress that supports treatment justification and discharge planning.
Scoring the Vanderbilt ADHD scale? Our step-by-step Vanderbilt scoring guide walks you through the process.
Need CPT codes for OT billing? See our coaching CPT code guide for 2026.
Struggling with therapist burnout? Read our guide on recognising and preventing therapist burnout before it affects your clinical work.
The full Child Sensory Profile 2 contains 86 items and provides detailed section-level and quadrant-level scores. The Short Sensory Profile 2 uses 34 items for a quicker screening that still covers all four quadrants. Use the short form for initial screening and the full form for comprehensive assessment and intervention planning.
No. The Sensory Profile 2 is not a diagnostic tool. It measures sensory processing patterns that may co-occur with conditions such as autism spectrum disorder or ADHD, but it cannot confirm or rule out any diagnosis. Use it alongside diagnostic assessments as part of a comprehensive evaluation.
Caregivers typically complete the full Child Sensory Profile 2 in 15 to 20 minutes. The Short Sensory Profile 2 takes approximately 5 to 10 minutes. Scoring and interpretation by a qualified clinician usually adds another 20 to 30 minutes depending on profile complexity.
The Sensory Profile 2 is designed for use by occupational therapists and other qualified professionals with training in sensory processing assessment. While caregivers and teachers complete the questionnaire, interpretation should always be performed by a clinician who understands Dunn’s model and can translate results into meaningful recommendations.
A classification of Just Like the Majority indicates that the individual’s sensory processing behaviours in that quadrant fall within the typical range compared to same-age peers. It does not mean the person has zero sensory preferences, only that their pattern is statistically similar to most people in their age group.
For patients receiving active intervention, reassess every three to six months to track progress. Additionally, readminister after significant life changes, environmental modifications, or when caregivers report noticeable behavioural shifts. Regular reassessment provides objective evidence of treatment effectiveness.
Accurate Sensory Profile 2 scoring interpretation is only as useful as the systems that support it. If you are still juggling paper forms, scattered spreadsheets, and disconnected assessment records, your clinical insights risk getting lost in the admin.
Pabau brings your assessments, treatment notes, scheduling, and patient communications into one platform built for healthcare professionals. From digital intake forms that collect caregiver questionnaires before appointments to automated reminders that keep reassessments on track, every part of your workflow connects.
Watch a FREE demo to see how Pabau can streamline your occupational therapy practice today.