


Mental Health & Therapy Therapy & Counseling
Cognitive Defusion
Clients often arrive in therapy locked in a struggle with their own thinking, co...
May 27, 2026
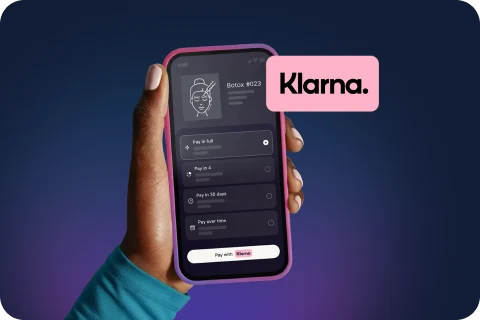
Buy now, pay later is now available in Pabau
The iceberg chart template is a visual therapeutic tool that reveals hidden emotions and beliefs beneath surface behaviours.
Therapists use iceberg charts to distinguish visible symptoms from underlying root causes, particularly effective in anger management and emotion regulation.
The iceberg model originated in systems thinking and is now a core CBT and psychoeducation technique used across mental health, therapy, and coaching practices.
Pabau’s digital forms feature lets practitioners deploy customizable iceberg chart templates in-session or as patient homework.
Most therapists rely on generic worksheets that don’t match their clinical workflow. The iceberg chart template is a proven therapeutic tool that helps clients visualize the gap between visible emotions and underlying drivers-but finding one designed for your practice is often harder than it should be. Pabau’s ready-made iceberg chart template bridges this gap, giving therapists a printable, customizable resource they can deploy in-session or assign as homework.
This guide covers what iceberg charts are, how to use them in clinical practice, and why they’re essential for mental health, therapy, coaching, and wellness practices seeking evidence-based tools for psychoeducation and root cause analysis.
A visual assessment tool that helps clinicians and patients explore conscious thoughts and presenting symptoms alongside unconscious emotions, beliefs, and experiences that influence mental health and behaviour.
Download templateAn iceberg chart template uses a visual metaphor to help clients understand their own behaviour and emotions. The top of the iceberg represents what is visible-the presenting symptom, emotion, or behaviour a client reports. Below the waterline lie the deeper layers: underlying thoughts, beliefs, past experiences, trauma, and core values that actually drive the surface reaction.
The iceberg model originated in systems thinking literature, particularly in cognitive behavioural therapy (CBT) and trauma-informed practice. It’s now a foundational psychoeducation tool used by therapists, counsellors, coaches, and mental health practitioners to build client insight. When a client struggles with anger outbursts, anxiety, or avoidance, the iceberg chart helps them see that the surface emotion is a symptom of something deeper-unmet needs, core beliefs, or unprocessed experiences.
From a regulatory and clinical safety perspective, iceberg charts are informed consent tools. They help practitioners explain treatment rationale and build client understanding of their own mental health, improving compliance and therapeutic alliance. Since these worksheets may contain sensitive patient information, they must be stored securely in compliance with HIPAA (US) and GDPR (UK/EU) when printed or saved digitally.
The iceberg chart template works best when guided by a trained clinician. Here’s how to deploy it in your sessions:
Deploy the iceberg chart template via Pabau’s digital forms to send it to clients before the session, use it interactively on your screen during the appointment, or assign it as structured homework between sessions.
Builds client insight. Clients see their own patterns and root causes, not just symptoms. This “aha moment” increases engagement and motivation for change.
Structures documentation. The iceberg model creates a clear narrative in clinical notes: presenting problem → underlying beliefs → treatment targets. This clarity supports audit, supervision, and continuity of care.
Improves psychoeducation. Rather than telling clients why they react the way they do, the chart lets them discover it themselves. Self-discovery is more powerful than instruction.
Supports informed consent. When a client understands their own iceberg, they understand why the treatment approach (CBT, trauma therapy, behaviour change) is relevant. Compliance improves.
Facilitates root cause analysis. Essential for systems thinking in clinic management-understanding why staff burnout happens, why no-show rates climb, or why specific patient groups disengage. The iceberg model applies beyond the therapy room.
Pabau's digital forms and clinical templates let you deploy iceberg charts, intake assessments, and treatment plans seamlessly. See how therapists and clinics automate paperwork and focus on what matters-patient care.
Pabau’s AI-powered documentation tools and digital forms work together to make the iceberg chart template a core part of your intake and assessment workflow. Upload the template to your forms library, assign it to clients at the first appointment, and retrieve completed charts directly into their clinical record. Customise the template for specific presenting problems-anger, anxiety, relationship patterns-or keep it generic for use across all clients.
The anger iceberg worksheet is perhaps the most widely used variant. Therapists working with anger management, domestic violence prevention, and impulse control use it to help clients see that anger is often a secondary emotion masking fear, shame, or powerlessness. The iceberg template makes this distinction concrete and visible.
Beyond anger, the iceberg model applies to anxiety, depression, avoidance, perfectionism, and people-pleasing. For instance, social anxiety at the surface often masks a deeper belief: “If I’m awkward, people will reject me.” The iceberg chart reveals that belief, and therapy targets it directly.
The National Institute of Mental Health (NIMH) and APA endorse root cause analysis as a best practice in mental health treatment. The iceberg chart template operationalizes this principle-it’s not just diagnosis and symptom management, but understanding the architecture of a person’s behaviour and belief system so treatment can address the foundation, not just the surface.
The iceberg model isn’t just a therapy tool-it’s a systems thinking framework. When clinic productivity dips, staff turnover rises, or patient satisfaction falls, practitioners can map the iceberg: visible problem at the top, underlying systemic issues (staffing model, workflow design, compensation structure) below. This approach helps clinic owners and managers identify root causes rather than treating symptoms.
Pabau’s practice management software includes reporting and analytics that reveal these patterns. Combined with the iceberg thinking model, clinic leaders can see the visible metrics (no-shows, cancellations, patient complaints) and then use root cause frameworks to investigate systemic drivers.
Need structured clinical assessment tools? Psychiatric Evaluation Template provides a comprehensive assessment framework for psychiatrists and mental health practitioners.
Looking to automate clinical note-taking? Pabau Scribe transcribes and structures your clinical sessions automatically, complementing assessment tools like the iceberg chart.
Want to streamline patient intake workflows? Mental Health EMR integrates intake forms, consent documents, and assessment templates into one practice platform.
The iceberg chart template is one of the most practical, evidence-based tools a therapist can use to build client insight and structure treatment. Rather than telling clients why they react the way they do, the iceberg diagram lets them discover their own root causes. This self-discovery drives engagement, compliance, and faster therapeutic progress.
Pabau’s digital forms feature makes deploying your iceberg chart template seamless-send it to clients before the session, use it interactively in-room, or assign it as homework. All completed charts flow directly into secure clinical records, supporting documentation and audit. Book a demo today to see how Pabau simplifies clinical templates and practice workflows for mental health professionals.
An iceberg chart helps therapists and clients visualize the difference between visible emotions or behaviours (the tip above water) and the underlying beliefs, experiences, and root causes that drive them (the mass below). It’s used for psychoeducation, building insight, anger management, and root cause analysis in treatment planning.
Start with a blank template (available in Pabau’s forms library) or download a generic iceberg diagram template. Add section labels: visible symptom at the top, then layers for thoughts, beliefs, past experiences, and core values below. Customize it for your client population or clinical focus.
The iceberg model in mental health is a frameworks that explains how presenting symptoms (anxiety, anger, avoidance) are the visible part of deeper psychological structures (core beliefs, trauma, unmet needs). It comes from systems thinking and cognitive behavioural therapy and is widely used in therapy, coaching, and counselling.
The visible tip represents the presenting emotion or behaviour. Below the waterline sit layers: immediate thoughts, secondary emotions, core beliefs, past experiences and memories, and basic needs or values. The depth and number of layers depend on the client’s complexity and the clinician’s assessment model.
Yes. Pabau and other practice management platforms let you deploy iceberg chart templates as digital forms. Clients complete them on tablet, phone, or computer before or during sessions. Digital templates auto-save into clinical records, reducing paperwork and improving documentation quality.