


Psychosexual Evaluation Form
What is a Psychosexual Evaluation Form? A psychosexual evaluation form is a stan...
April 22, 2026

Buy now, pay later is now available in Pabau
Beery VMI measures visual-motor integration through 30 increasingly complex geometric designs for ages 2-100
Standard scores range 55-145 with average performance at 85-115 (Mean = 100, SD = 15)
Percentile ranks provide practical context: scores below the 16th percentile indicate potential concerns
Age equivalents reveal developmental level but should never replace standard scores in clinical interpretation
Three subtests work together: VMI (integration), Visual Perception, and Motor Coordination to isolate skill deficits
Clinical patterns matter more than single scores: look for discrepancies between subtests to guide intervention
Context drives interpretation: consider attention, impulsivity, motor fatigue, and behavioral observations during testing

A comprehensive beery vmi quick reference guide. Download and use it in your practice.
When a child struggles with handwriting, copying from the board, or organizing written work on paper, clinicians often turn to the Beery-Buktenica Developmental Test of Visual-Motor Integration (Beery VMI) for answers. But raw scores and standard scores can feel abstract without proper context: and misinterpretation can lead to misguided interventions or missed diagnoses.
Understanding Beery VMI scoring interpretation isn’t just about converting numbers on a table. It’s about translating those numbers into actionable insights that inform treatment planning, educational accommodations, and family communication through secure client portals. Whether you’re a clinical psychologist, occupational therapist, or educational psychologist, mastering this interpretation process is essential for evidence-based practice.
The Beery VMI has been used clinically for over 50 years and remains one of the most widely administered assessments for visual-motor integration in children and adults. With proper interpretation, it reveals not just whether a client struggles, but why: separating visual perception deficits from motor coordination problems from true integration difficulties.
This guide walks you through the complete Beery VMI scoring interpretation process, from understanding the scoring system to recognizing clinical patterns that drive intervention decisions.
The Beery-Buktenica Developmental Test of Visual-Motor Integration (Beery VMI) assesses how well individuals integrate their visual perceptual abilities with motor coordination skills. It’s used across the lifespan: from age 2 to 100: though most clinical applications focus on children aged 3-18.
The Beery VMI consists of three distinct assessments:
This three-part structure is diagnostically powerful: it separates visual skills, motor skills, and integration skills, helping clinicians pinpoint exactly where breakdowns occur.
Visual-motor integration is the ability to coordinate visual information processing with fine motor output. In practical terms, it’s what allows us to:
Poor VMI performance often correlates with academic difficulties, particularly in handwriting, mathematics (copying problems), and organizational tasks.
Raw scores are the foundation of Beery VMI scoring. Clients receive one point for each correctly copied design, with testing continuing until three consecutive failures occur. The maximum raw score is 30 (one point per design).
Scoring criteria are strict: each design has specific scoring guidelines in the manual, with detailed examples of acceptable and unacceptable reproductions. Common errors include:
Raw scores alone have limited clinical value because they don’t account for age. A raw score of 15 might be excellent for a 4-year-old but concerning for a 10-year-old.
Standard scores transform raw scores into age-adjusted performance metrics with a mean of 100 and standard deviation of 15. This allows for meaningful comparison across ages and aligns with other standardized assessments (like IQ tests).
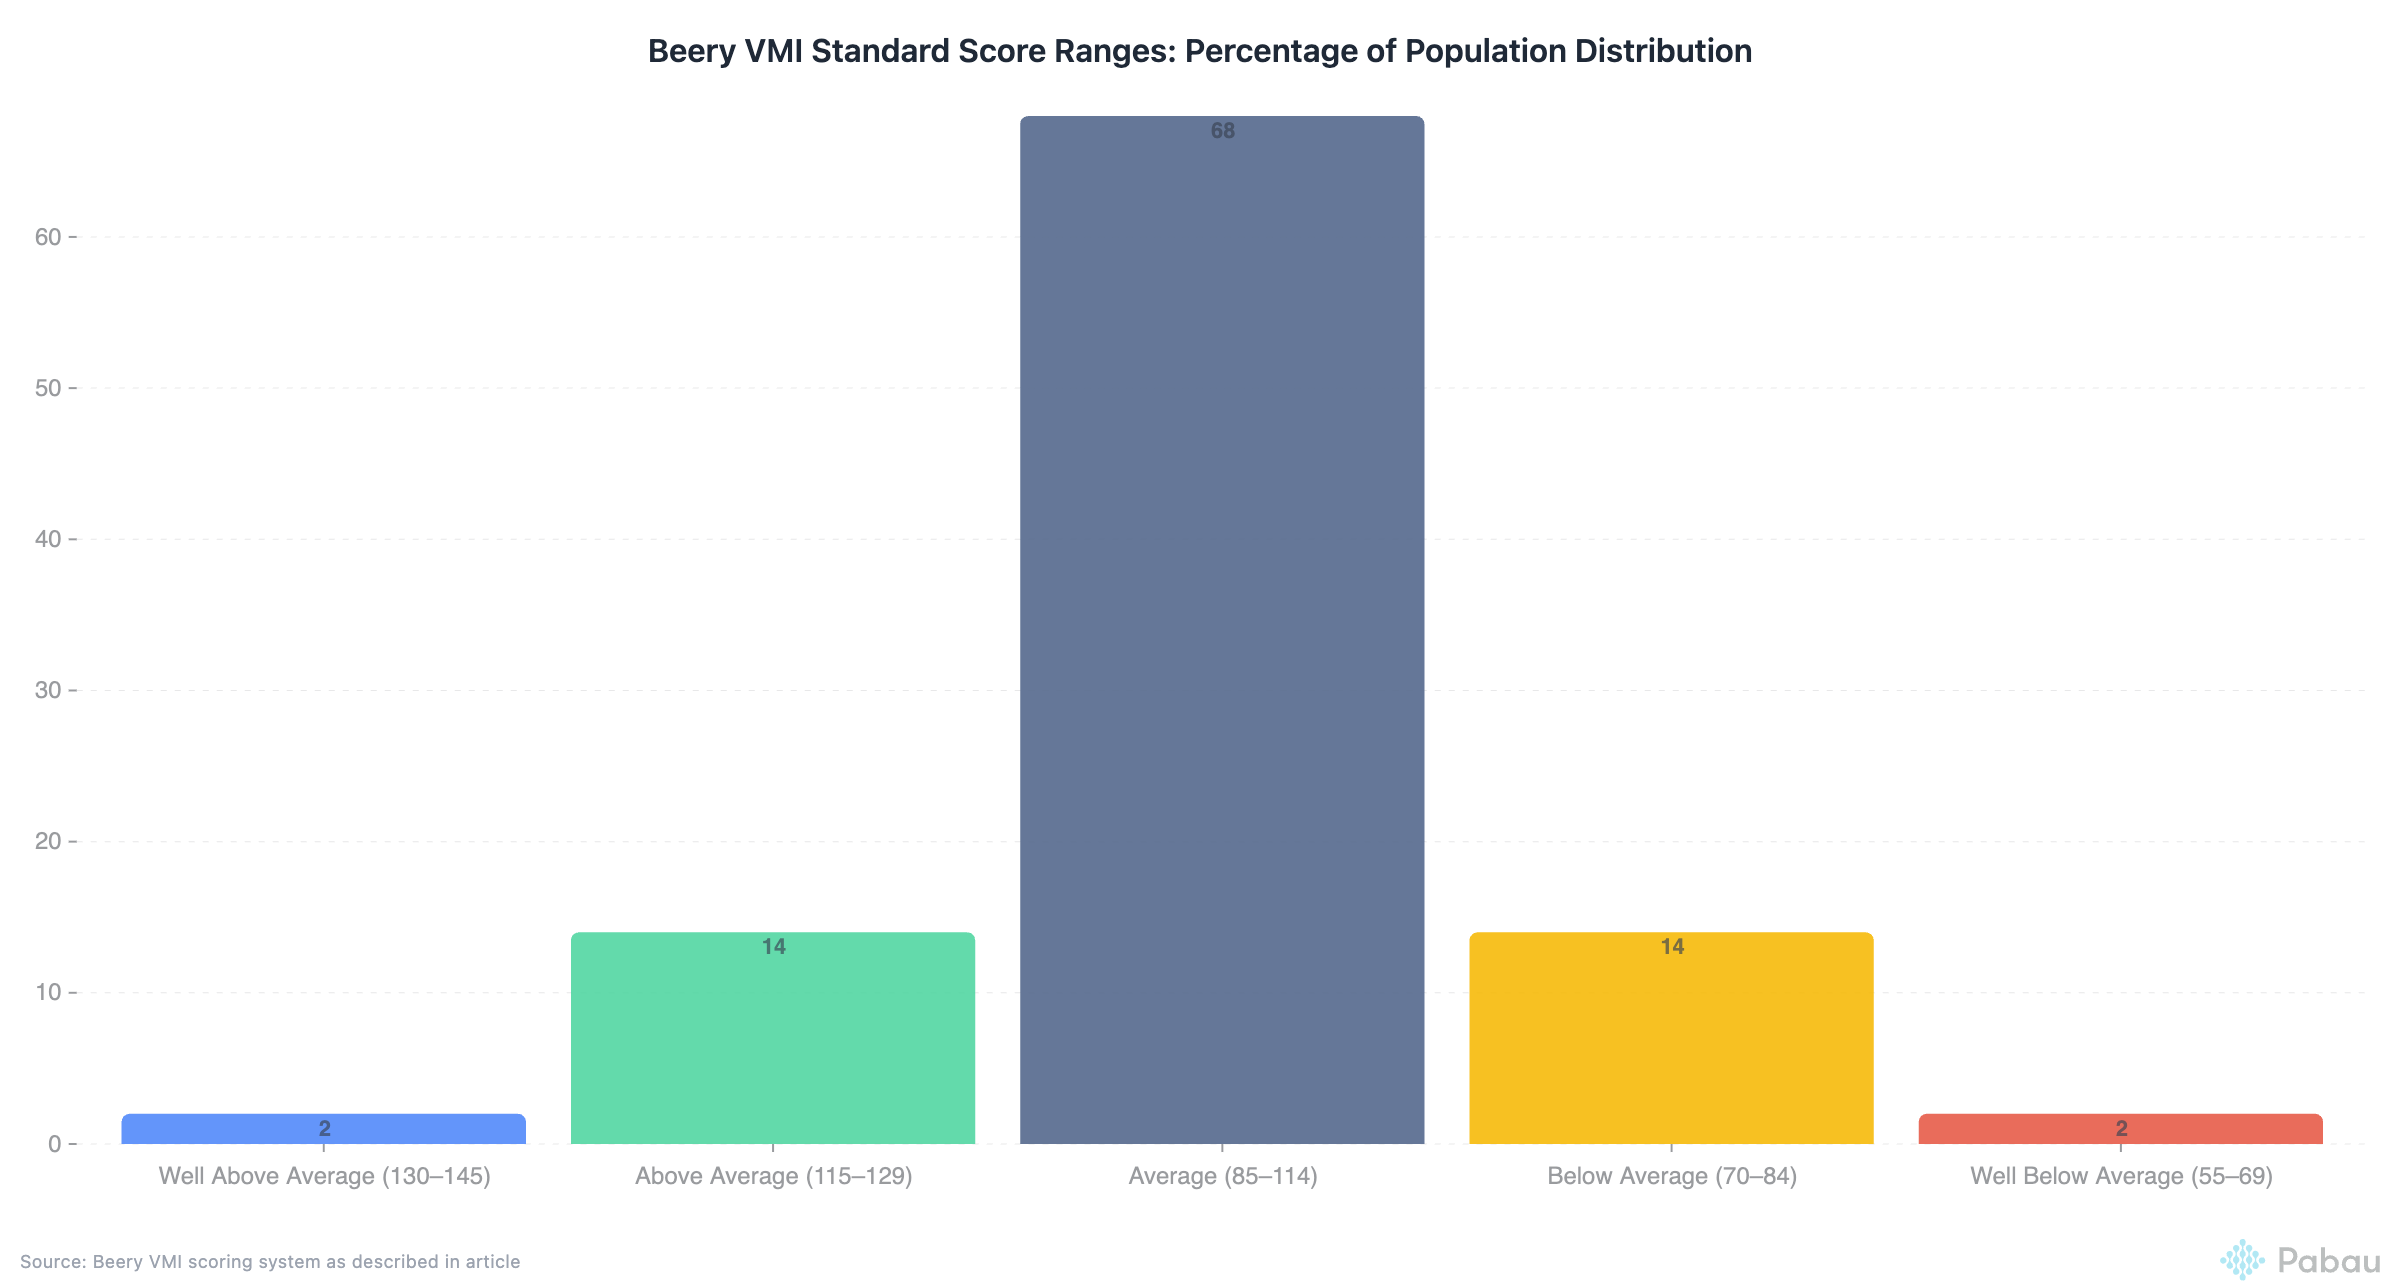
The Beery VMI uses the following standard score ranges:
| Standard Score Range | Performance Level | Percentage of Population |
|---|---|---|
| 130-145 | Well Above Average | ~2% |
| 115-129 | Above Average | ~14% |
| 85-114 | Average | ~68% |
| 70-84 | Below Average | ~14% |
| 55-69 | Well Below Average | ~2% |
Clinical Significance: Standard scores are the gold standard for clinical interpretation. Use them: not age equivalents or raw scores: as your primary interpretive metric.
Percentile ranks indicate the percentage of same-aged peers scoring at or below a given score. They’re often more intuitive for parents and educators than standard scores.
Key percentile thresholds for clinical decision-making:
Important Note: A child at the 5th percentile isn’t failing: they’re performing better than 5% of peers. However, they’re struggling compared to 95% of same-aged children, which typically warrants intervention.
Age equivalents indicate the age group for which a raw score represents average performance. For example, if a 10-year-old achieves a raw score typical of 7-year-olds, their age equivalent is 7 years.
Critical Caution: Age equivalents are useful for explaining developmental delays to families but should never be the primary interpretive score. They:
Use age equivalents as a supplementary communication tool, not a diagnostic metric.
Each of the three subtests (VMI, VP, MC) provides distinct diagnostic information:
This is your primary score. It reflects the integrated ability to perceive visual information and coordinate motor output. Low VMI scores suggest difficulty with the combination of visual and motor demands, even if each skill in isolation is adequate.
Clinical implications of low VMI:
This isolates visual analysis skills without motor demands. Low VP scores indicate difficulty processing visual information, recognizing spatial relationships, or discriminating forms.
Clinical implications of low VP:
This isolates fine motor control and pencil skills. Low MC scores suggest motor planning or execution problems independent of visual processing.
Clinical implications of low MC:
The real diagnostic power comes from comparing scores across subtests. Significant discrepancies (typically ≥12 standard score points or 1 SD) reveal specific deficit patterns:
Interpretation: True visual-motor integration deficit. Visual and motor skills are intact in isolation, but the client struggles to coordinate them together.
Intervention Focus: Integration activities (copying tasks, construction activities, bilateral coordination)
Interpretation: Visual perception deficit is driving VMI difficulties. Motor skills are adequate.
Intervention Focus: Visual perceptual training (form discrimination, spatial relations, figure-ground)
Interpretation: Motor coordination deficit is limiting VMI performance. Visual processing is adequate.
Intervention Focus: Fine motor skill development, handwriting interventions, motor planning
Interpretation: Global developmental delay or multiple deficit areas. Consider broader neurodevelopmental assessment.
Intervention Focus: Comprehensive multidisciplinary approach
Interpretation: Visual-motor skills are not contributing to presenting concerns. Look elsewhere (attention, executive function, language).
Action: Consider alternative assessments based on referral question
Different diagnostic populations tend to show characteristic Beery VMI patterns:
Autism Spectrum Disorder: Often shows relative strength in VP compared to VMI and MC. Motor coordination tends to be the primary area of difficulty.
ADHD: Scores may be artificially lowered by impulsivity and inattention rather than true skill deficits. Qualitative observations during testing are critical.
Developmental Coordination Disorder (DCD): Typically shows low MC with relatively better VP, and VMI scores falling between them.
Learning Disabilities: Variable patterns depending on the specific LD. Dysgraphia often shows MC < VMI < VP. Non-verbal learning disability may show VP < VMI < MC.
Intellectual Disability: Generally shows proportional delays across all three measures relative to overall cognitive functioning.
Standard scores don’t capture how a client performed, only what they achieved. Modern client records systems allow you to document these critical observations alongside standardized scores:
Attention and Persistence:
Motor Behaviors:
Visual Behaviors:
Approach Strategies:
These observations often explain score patterns and guide intervention planning more than numbers alone.
Not all test scores are valid. Consider these validity threats:
Attention/Effort: A child with ADHD who rushes may score lower than their true ability. Consider readministration under optimal conditions or medication.
Motivation: Oppositional behavior or task refusal can artificially suppress scores.
Motor Fatigue: Testing order matters. If MC is administered after VMI and VP, fatigue may lower MC scores.
Cultural Factors: While the Beery VMI has diverse normative samples, some geometric forms may be less familiar in certain cultural contexts.
Previous Exposure: Repeated administrations within 6-12 months may show practice effects, particularly on VP.
Integrating assessment results into practice management systems ensures consistent documentation across your clinical team.
Beery VMI results should directly inform intervention goals and strategies:
For Low VMI with Average VP and MC:
For Low VP:
For Low MC:
For Global Low Scores:
When reporting Beery VMI results:
To Parents: Use percentile ranks and age equivalents as supplementary explanations alongside standard scores. Avoid jargon. Relate scores to real-world tasks (e.g., “This means Jordan may struggle with copying math problems from the board”).
To Teachers: Emphasize practical classroom implications and specific accommodations. Include examples of what struggles might look like in academic tasks.
To Other Professionals: Use standard scores as primary metrics. Include subtest scatter analysis and behavioral observations. Discuss diagnostic implications and differential diagnoses.
Documentation Best Practices:
The Beery VMI identifies what is impaired but not necessarily why or how to fix it. Effective intervention requires:
Important Research Finding: Studies show VMI scores may not be sensitive to handwriting intervention progress. Don’t rely solely on Beery VMI for progress monitoring: supplement with functional handwriting measures.
“Understanding the difference between standard scores and percentiles completely changed how I communicate Beery VMI results to parents. When I explain that a standard score of 85 means their child is performing better than 16% of peers but that it’s still considered the low end of average, suddenly the numbers make sense. And analyzing the subtest patterns: like seeing that motor coordination is dragging down VMI while visual perception is solid: gives me such clear direction for treatment planning. It’s not just about the numbers; it’s about the story those numbers tell.”
: Sarah K., Pediatric Occupational Therapist, 12 years experience
Clinical Documentation Best Practices – Learn how to integrate assessment results into comprehensive client records for evidence-based treatment planning.
Streamline Assessment Scheduling – Automate appointment reminders and track assessment intervals to optimize your clinical workflow.
Secure Report Sharing – Share assessment reports with families and educators through HIPAA-compliant client portals.
Digital Assessment Forms – Modernize your intake process with customizable digital forms that integrate with clinical records.
See how clinics reduce admin, improve clinical outcomes, and increase revenue with Pabau.

The Beery VMI doesn’t have a strict pass/fail threshold, but standard scores of 85-115 (16th-84th percentiles) are considered average. Scores below 85 suggest below-average performance, with scores below 70 (2nd percentile) indicating significant impairment. Clinical concern typically begins around the 16th percentile (standard score 85), especially if accompanied by functional difficulties in school or daily tasks.
Best practice suggests waiting at least 6-12 months between administrations to minimize practice effects and allow sufficient time for developmental change or intervention response. For progress monitoring, consider using curriculum-based handwriting measures or functional task analysis rather than frequent Beery VMI readministration.
The Beery VMI is one component of a dysgraphia assessment but cannot diagnose dysgraphia alone. Dysgraphia diagnosis requires comprehensive evaluation including handwriting samples, writing speed/fluency measures, fine motor assessments, orthographic coding, and language-based writing skills. Low Beery VMI scores (particularly MC) support a dysgraphia diagnosis but aren’t sufficient by themselves.
This pattern suggests handwriting difficulties stem from factors beyond visual-motor integration: such as executive function (planning, organization), working memory, language-based writing difficulties, attention, or lack of instructional exposure. Consider broader assessment of writing skills, including compositional writing, spelling, and written expression. The Beery VMI measures copying geometric forms, not functional handwriting or written language.
Always report both. Standard scores are the primary clinical metric and allow for statistical comparison across tests (IQ, achievement, other assessments). Percentiles are more intuitive for parents and educators who may not understand standard deviation-based scores. Include age equivalents as supplementary information for families, but never as the primary interpretive score.
Significant discrepancies (≥12 standard score points or 1 SD) are diagnostically meaningful. VMI much lower than VP and MC suggests a true integration deficit. VMI lower than VP but similar to MC suggests motor issues are limiting performance. VMI lower than MC but similar to VP suggests visual perception problems. These patterns guide intervention focus: integration activities, motor skill development, or visual-perceptual training, respectively.
Yes, but scores must be interpreted cautiously. Children with ADHD often score lower due to impulsivity, inattention, and poor sustained effort rather than true visual-motor deficits. Qualitative observations during testing are critical: Did the child rush? Self-correct? Give up easily? Consider testing under optimal conditions (after medication, with breaks) or using a “second chance” protocol qualitatively to estimate potential vs. typical performance.
Mastering Beery VMI scoring interpretation transforms raw test data into actionable clinical insights. Standard scores and percentiles provide the statistical foundation, but true interpretation requires analyzing score patterns across subtests, integrating behavioral observations, and connecting findings to real-world functional impacts.
The most effective clinicians don’t just report scores: they tell the story behind the scores. They explain why a child with a standard score of 78 struggles to copy math problems from the board, why intervention should target motor coordination rather than visual perception, and how progress will be measured over time.
As you refine your Beery VMI interpretation skills, remember: scores are the beginning of the clinical process, not the end. They guide hypothesis formation, treatment planning, and outcome measurement: but always in service of helping children and families navigate real-world challenges with visual-motor demands.
Whether you’re writing an IEP goal, explaining results to a worried parent, or designing a treatment plan, let the Beery VMI scores illuminate the path forward with precision, context, and clinical wisdom.