GLP-1 diet plan
A GLP-1 diet plan is a structured eating framework for patients taking semagluti...

2
Last Updated: Oct 13, 2026

BMI is a height-weight calculation (weight ÷ height²) used to screen for weight categories. A healthy range for women is 18.5-24.9.
Age doesn’t change the healthy BMI range, but women over 50 should interpret BMI alongside menopause-related metabolic shifts.
BMI does not distinguish muscle from fat. Waist circumference and body-fat percentage are essential complementary measurements in clinical practice.
Digital intake forms in practice management software like Pabau auto-calculate BMI from patient data and flag values outside healthy ranges, streamlining assessment workflows in weight loss and wellness practices.
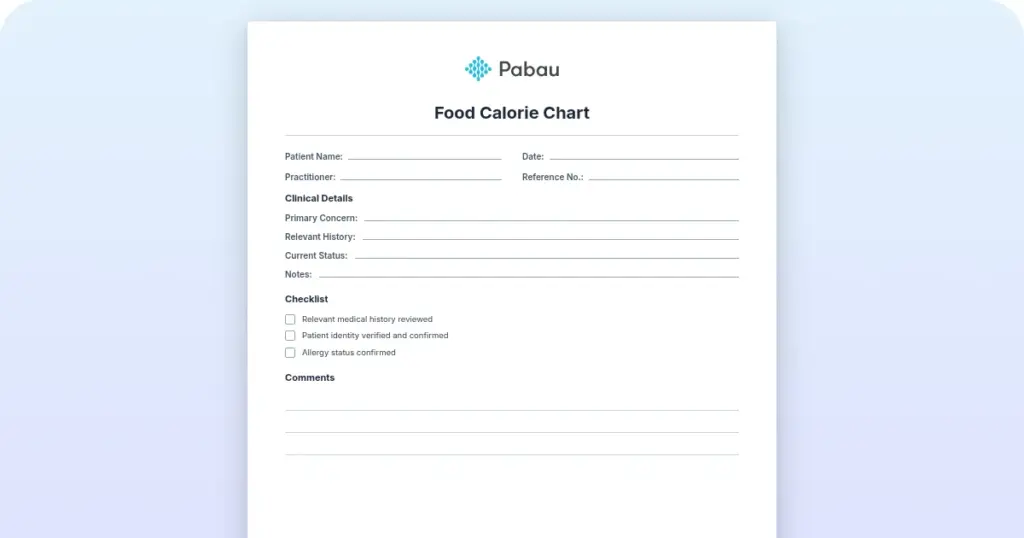
A simple intake form for recording a patient’s height, weight, and BMI at each visit, with fields for date of birth and clinician notes. Print it for paper charts, or drop it into your practice’s digital intake workflow so BMI is captured consistently every time.
Download templateA women’s BMI chart is a practical clinical tool that helps practitioners assess weight status and initiate conversations about metabolic health. Unlike generic BMI references, a women’s BMI chart accounts for age-related metabolic shifts, pregnancy contexts, and the unique physiological factors that influence body composition in female patients.
Healthcare professionals in weight loss and metabolic health practices, primary care, and wellness centers rely on a women’s BMI chart as part of routine patient intake and health screening workflows.
This guide explains what a women’s BMI chart is, how to interpret BMI categories, when to use age-adjusted ranges, and why BMI alone is insufficient without complementary measurements like waist circumference and body fat percentage. You’ll learn how to integrate BMI assessment into your practice’s digital intake process and when to refer patients for additional evaluation.
A women’s BMI chart is a reference table that maps height and weight to BMI categories, with ranges tailored to female physiology. BMI itself is calculated by dividing weight in kilograms by height in meters squared, producing a number used to classify weight status as underweight, healthy, overweight, or obese.
For women, a healthy BMI falls between 18.5 and 24.9 according to WHO guidelines. Women-specific charts account for hormonal factors, bone density differences, and age-related metabolic changes that generic BMI tables miss.
A chart designed for women’s health provides clinicians with a consistent, evidence-based reference that supports objective weight-status screening and helps identify patients who may benefit from lifestyle intervention or further metabolic assessment.
Practice teams use a women’s BMI chart during intake to establish a baseline, track weight trends over time. For practitioners delivering weight loss programs, aesthetic treatments, or preventive health services, a women’s BMI chart is a foundational screening tool.
The BMI formula is the same for all adults. BMI is calculated in two ways depending on whether you use metric or imperial measurements.
Most practices use CDC BMI calculators to compute values automatically from patient-entered height and weight during intake. Manual calculation is straightforward but time-consuming at scale. Many practice management systems now auto-calculate BMI from demographic data, reducing data-entry errors and flagging out-of-range values for practitioner review.
Below is a searchable women’s BMI chart covering heights from 4’10” (147 cm) to 6’2″ (188 cm) and weight ranges from 90 lbs to 250 lbs.
Cells are color-coded by BMI category: green for healthy weight, yellow for overweight, and red for obese. Use this table to locate a patient’s BMI quickly during intake or to explain weight-status categories in consultation.
Color guide: Green (healthy weight, BMI 18.5-24.9), yellow (overweight, BMI 25-29.9), red (obese, BMI 30+). For heights and weights outside this range, use the BMI formula or an online calculator.
Turning this scale into a digital form with form capture software removes double entry and keeps every score legible.
BMI values fall into four standard categories established by the National Heart, Lung, and Blood Institute. The NHLBI BMI calculator can help confirm category placement, and understanding these categories helps clinicians frame weight-status conversations and identify when further assessment is needed.
Patients newly classified as overweight or obese often need a concrete starting point beyond the category label. A structured diabetes diet plan gives practices something specific to hand over when family history or elevated glucose adds urgency to the conversation.
BMI interpretation changes subtly with age. Women in their 50s and 60s experience metabolic shifts due to menopause that alter how BMI should be evaluated.
Some research suggests older women with BMI values slightly above 25 may have lower mortality risk than younger women at the same BMI. This does not mean the standard categories change. Clinicians should consider age context when counseling patients.
Practices supporting perimenopausal patients often pair BMI tracking with a structured plan, such as a 5-day menopause diet plan, to address menopause’s visceral-fat shift.
Standard BMI charts and categories do NOT apply during pregnancy. Instead, clinicians use pre-pregnancy BMI to guide gestational weight gain recommendations. The American College of Obstetricians and Gynecologists (ACOG guidance) provides trimester-specific weight gain targets based on pre-pregnancy BMI.
Post-partum weight loss varies. Some weight is shed immediately (baby, placenta, amniotic fluid), but residual fat may persist. Clinicians should reassess BMI at 6 weeks post-partum and use standard charts at that point.
Excessive gestational weight gain is linked to long-term overweight risk.
BMI is a screening tool, not a diagnostic measure. It has well-documented limitations, particularly for women.
For these reasons, clinicians should always use complementary measurements alongside BMI.
Waist circumference, body fat percentage, and waist-to-hip ratio provide additional health information that BMI alone cannot convey. These measurements are especially useful in metabolic health practices.
Gold-standard body composition measurement is dual-energy X-ray absorptiometry (DEXA scan), but this is expensive and not routine in primary care. Bioelectrical impedance analysis (BIA) is more accessible and suitable for practice settings. Many modern patient record systems allow practitioners to input these measurements alongside BMI for longitudinal tracking.
Practices standardizing this process sometimes compare options such as the best weight loss clinic EMR to connect these measurements directly into daily workflows.

A women’s BMI chart fits into practice workflows at three key touchpoints: intake screening, pre-surgical assessment, and weight management program enrollment. Clinicians use the chart to standardize assessment, communicate risk clearly to patients, and document baseline status in medical records.
Intake screening: BMI is calculated from height and weight during initial patient registration. The chart allows quick visual interpretation of whether the patient falls into a risk category that warrants additional counseling or referral.
Pre-surgical or procedural screening: Weight loss practices, aesthetic practices, and surgical centers use BMI as a safety threshold before certain procedures. A women’s BMI chart enables consistent decision-making across staff and provides documentation of risk assessment in case notes.
Weight management programs: Practices offering weight loss services use a women’s BMI chart as a motivational tool, helping patients set realistic weight targets and track progress. Regular BMI measurement during follow-up visits creates accountability and helps identify whether interventions are effective.
Many programs translate BMI trends into daily choices with practical resources. A portion size chart helps with measuring servings, and a three-day diet menu plan gives patients a ready template to follow.

Some patients want more structure than a chart alone provides. A paleo meal plan delivery template gives practices a ready framework to send home. Reviewing GLP-1 statistics helps set realistic expectations when medication supports the plan.
BMI alone should not drive clinical decisions. Refer patients for further metabolic, endocrine, or psychological assessment when BMI indicates risk (overweight or obese) and one or more of the following also applies:
When disordered eating is suspected, standardized psychological questionnaires give practitioners a consistent way to screen before referral, rather than relying on BMI alone.

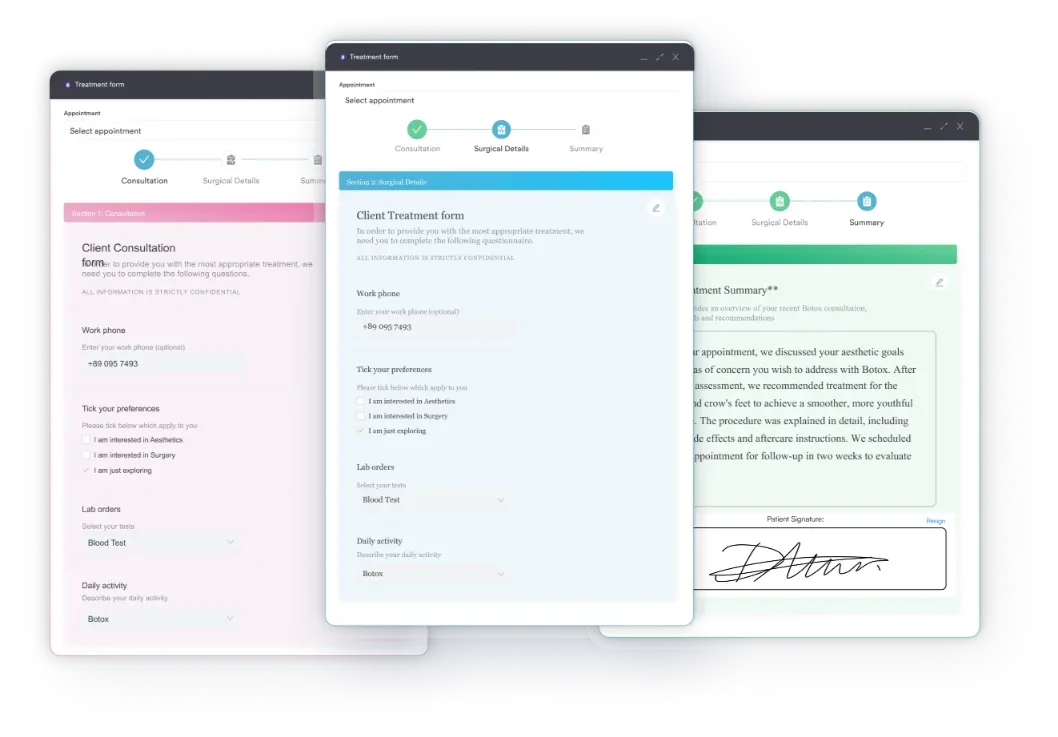
Pabau’s integrated intake forms, patient records, and automated workflows help you calculate BMI, store measurement history, and trigger follow-up reminders automatically. Reduce manual data entry and improve consistency across your team.

A women’s BMI chart is a foundational assessment tool that helps clinicians screen for weight-related health risks and initiate evidence-based interventions. While BMI has limitations, combining it with waist circumference, body fat percentage, and other complementary measurements creates a more complete picture of metabolic health.
Use the downloadable chart provided here during patient intake, pre-procedural screening, and weight management follow-up. Digital integration via practice management software ensures consistency, reduces errors, and supports longitudinal tracking of patient progress.
When BMI indicates risk, always investigate further with alternative metrics and refer for specialist evaluation when needed. See how Pabau supports weight management workflows with a quick demo.

Evaluating a patient for metabolic acidosis? metabolic acidosis template guides practitioners through a structured evaluation with ABG parameters, electrolyte panels, and anion gap calculations.
Tracking BMI as part of diabetes risk management? A diabetes nursing care plan helps standardize monitoring and intervention planning for at-risk patients.
Teaching patients to read nutrition labels? nutrition label worksheet gives a field-by-field reference table plus a fillable two-product comparison grid and answer sheet.
A healthy BMI for women is 18.5 to 24.9, according to WHO and CDC guidelines. This range is associated with lower risk of weight-related chronic diseases like type 2 diabetes and cardiovascular disease, though health outcomes depend on many factors beyond BMI.
The BMI formula and categories are the same for all adults, but women’s BMI interpretation requires context. Women have naturally higher body fat percentages than men at the same BMI, and hormonal factors (menopause, pregnancy) affect how BMI should be evaluated over the lifespan.
Divide your weight in kilograms by your height in meters squared (weight ÷ height²). For imperial: multiply weight in pounds by 703, then divide by height in inches squared. Most practices use online calculators or practice software that auto-calculates BMI from patient data.
The standard healthy BMI range (18.5-24.9) applies across all adult ages. However, interpretation shifts slightly with age: women over 50 may benefit from considering complementary metrics like waist circumference, since menopause increases visceral fat risk even if BMI remains stable.
BMI is a useful screening tool but not a perfect measure. It does not distinguish muscle from fat, ignores fat distribution, and misses hormonal context. Always use BMI alongside waist circumference, body fat percentage, or other complementary measurements for complete health assessment.
A BMI of 30 or above is classified as obese for all adults, including women. Obesity carries substantially elevated risk for type 2 diabetes, hypertension, and cardiovascular disease and usually warrants comprehensive weight management and medical supervision.