GLP-1 diet plan
A GLP-1 diet plan is a structured eating framework for patients taking semagluti...

2
Last Updated: Oct 13, 2026

A body mass index assessment divides weight in kilograms by height in meters squared, then reads the result against set categories.
For adults, 18.5 to 24.9 is the healthy range, overweight starts at 25, and obesity starts at 30.
Children are scored on age- and sex-specific percentiles, so the same raw BMI can land in a different category at a different age.
BMI cannot separate muscle from fat, so pair it with waist circumference and the patient’s history before acting on it.
Recording BMI, waist circumference, and the clinical note in one system is what makes the trend readable at follow-up.
Two patients weigh the same and stand the same height. One is a powerlifter. The other has been sedentary for a decade. A body mass index assessment hands both of them the same number, and the same category.
BMI divides a patient’s weight in kilograms by their height in meters squared, and the result maps to a weight category. The CDC treats that category as a screening signal, not a diagnosis of body fatness. It flags who needs a closer look, and nothing more.
So the number takes ten seconds to produce. Getting something useful out of it takes a little more care, starting with how it is measured and calculated.
BMI is weight in kilograms divided by height in meters squared. That is the whole calculation. Two unit systems are in common clinical use:
Worked through in metric, a patient weighing 80 kg at 1.75 m tall gives 80 ÷ (1.75 × 1.75). That is 80 ÷ 3.0625, which comes out at 26.1. The patient sits in the overweight category, one point over the line.
Most practice management systems and electronic records calculate this for you the moment height and weight are entered. Knowing the formula anyway is what lets you catch a bad result. A misplaced decimal in a height field can turn a healthy adult into a Class III flag.
A BMI is only as good as the two figures behind it. Five habits keep those figures clean:
Four categories cover adults. Underweight sits below 18.5, healthy weight runs from 18.5 to 24.9, overweight covers 25 to 29.9, and obesity starts at 30.
The CDC and the World Health Organization use the same numeric ranges for men and women, at every adult age.
Logging which category a patient falls into at each visit gives you a simple progress marker. For practices tracking patient compliance with a lifestyle program, that single field often tells the story faster than the raw number does.
Obesity is not one band. Guidelines and surgical eligibility criteria both work from the three sub-classes below, and each one shifts how intensive the plan needs to be.
Thresholds for surgery and medication still vary by country and by payer. Check the local rule rather than treating the class alone as an eligibility test. The class tells you how much structure a patient’s personalized treatment plan is likely to need.
GLP-1 medications have become common enough in that conversation that a quick read of current GLP-1 statistics helps set realistic expectations before the visit.
Adult thresholds do not apply to anyone under 20. From age 2 to 20, BMI is read as a percentile against children of the same age and sex, using the categories below.
CDC growth charts are the standard US reference. Body fat shifts as children grow, and it differs between boys and girls of the same age. That is why the same raw BMI lands on a different percentile, and sometimes a different category, at different ages.
A BMI of 21 sits around the obesity cutoff for a 10-year-old boy. The same 21 is mid-range for a 16-year-old. Plot every result on the chart that matches the patient’s age and sex.
BMI works from two numbers, so it cannot see body composition, fat distribution, or the population differences that change what a given figure means. Five limitations come up often enough to be worth a line in the note:
These limits matter most in the room, when you explain a result to the patient in front of you. Our guide on interpreting biomarkers covers how to do that without denting their confidence in the screen.
The clinical guide to managing metabolic health picks up the harder question of what to do when BMI alone cannot decide a treatment path.
Document the clinical context next to the BMI, not somewhere else in the file. Note that a patient is a competitive athlete, or that they have significant edema, or that they are pregnant. The next clinician to open that record then knows how to read the number instead of guessing.
BMI is where the assessment starts. Waist circumference, waist-to-hip ratio, body fat percentage, and DEXA each capture something the ratio of height to weight cannot.
Few practices need all four. A tape measure delivers most of the added value, for the price of a tape measure. Add a fuller body composition test when muscle mass makes the BMI hard to read.
Once a patient’s BMI lands in the overweight or obese range, many practices order a glucose tolerance test to screen for insulin resistance early.
Waist circumference is the one supplement almost every outpatient setting can add today. NHLBI guidance puts the action thresholds here:
Picture two patients at a BMI of 27. One measures 96 cm at the waist, the other 110 cm. Both sit in the same category. Their cardiometabolic risk is not the same, and only the tape measure shows you which is which. Record both figures together and the picture holds up.
No. Metabolic age compares a person’s basal metabolic rate with population averages for their chronological age. If a 35-year-old’s resting metabolism matches the average 45-year-old, the tool reports a metabolic age of 45.
It is worth framing that carefully with patients. No tier-one guideline from the CDC, WHO, or NHLBI recognizes metabolic age as a diagnostic measure.
Commercial body composition scanners use it as a motivator, which is a fair job for it. For metabolic health EMR documentation, BMI and body fat percentage are the defensible entries.
Consumer guides stop at the individual reader. In a weight management or metabolic service, the assessment is a workflow, and its value depends on how consistently that workflow runs. Five steps cover it:
The take-home resource should match that same category. A 7-day nutrition plan gives a lower-risk patient a general starting structure. A 1000-calorie diet plan for supervised weight loss suits someone already in a higher-risk class.
Two documentation details decide whether that record holds up later. Obesity is coded from the provider’s own documented diagnosis, so E66.01 needs a note behind it. The Z68 body mass index codes go in as secondary. Medicare’s intensive behavioral therapy benefit, billed under G0447, also depends on a documented BMI of 30 or above.
Between appointments the record needs something to compare against. A food diary and a set of goal setting worksheets give the next consultation something concrete to work from. The review then rests on more than a single number and a guess.
Some patients arrive already following a specific diet, and the record should reflect that. An Atkins Phase 1 list suits a lower-carb start. An acid alkaline food chart works for a patient tracking PRAL values instead.
Patients following an alkaline diet eating plan need the same tracking, even though the evidence behind pH-based weight claims stays limited.
Weight management is largely a service for self-pay patients, which makes the trend line commercial as well as clinical. A patient who can see their own six-month curve is far easier to keep on the program.
Digital intake forms move the whole first step before the appointment. Height and weight arrive electronically, BMI is calculated and filed, and the consultation starts with the number already on screen. That also removes the transcription errors that paper forms invite.
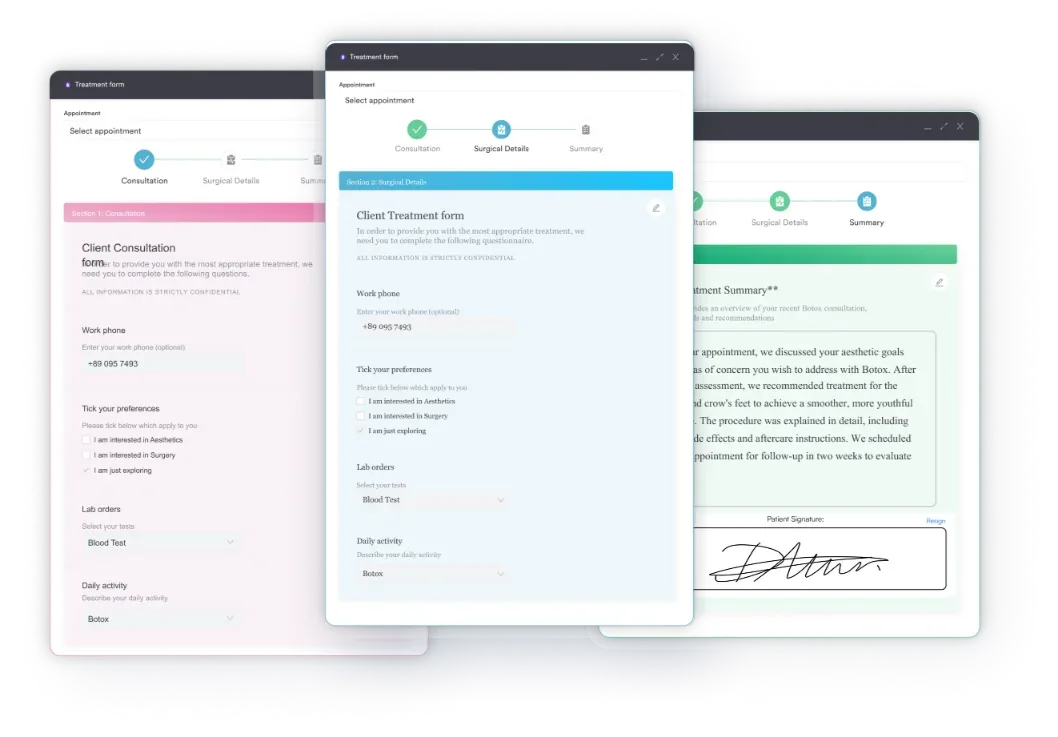
In plenty of practices a single BMI ends up in three places. The number is on a paper intake form, the context is in a note elsewhere, and the follow-up reminder lives in someone’s spreadsheet. Whichever way it splits, the trend is the first thing to break, usually right when a patient asks how they are doing.
Practice management software like Pabau keeps the three together. Its measurements tracking software stores BMI, waist circumference, and body composition against each appointment, sitting next to the clinical note from that same visit. Nothing has to be re-entered or exported to be read later.
For a practice running weight loss clinic software, that means the six-month review takes two minutes instead of a hunt through three systems. You open the patient, read the curve, and see the note that explains any outlier on it.

Record BMI, waist circumference, and body composition against every appointment, right next to the clinical note. Weight management and metabolic health practices get one readable trend per patient.

BMI keeps its place in clinical practice because it costs nothing and takes seconds. The trade-off is that it answers a narrower question than most patients assume it does.
So treat the result as the opening of a conversation. Add the tape measure, add the patient’s history, and write down what the number cannot see. A BMI with context still makes sense months later, when someone else opens the record and has a decision to make.
If you run weight management or metabolic health programs, the documentation workflow decides how much that measurement is worth to you. Book a demo to see how Pabau keeps BMI, waist circumference, and clinical notes in one patient record.

Comparing systems for a weight service? EMR for weight loss clinics compares seven platforms on documentation, scheduling, and patient tracking.
Screening for liver disease without a biopsy? elastography test catches liver disease progression early without a needle, sedation, or biopsy sampling errors.
Deciding between lifestyle work and medication? Managing metabolic health interventions weighs both routes for clinical decision-making.
Writing up an obesity care plan? Obesity nursing care plan sets out current NANDA-I diagnoses with goals and interventions.
Building your intake paperwork? Weight loss intake form captures height, weight, and history in one pass.
Labels for FDA-approved weight-management drugs start at a BMI of 30. They also allow 27 or above when the patient has a weight-related condition, such as hypertension or type 2 diabetes. Payer rules can be stricter, so check the plan before promising coverage.
No. The standard categories are not validated for pregnant patients. Weight-gain guidance works from pre-pregnancy BMI, so record that figure at the first visit and plan from it.
At intake for every patient, then at each visit where weight is part of the plan. Weight management programs often re-check monthly. In general primary care, once a year is the common cadence.
Yes. The Z68 series in ICD-10-CM records the value itself. It is always secondary, added after the provider’s own documented diagnosis of overweight or obesity.
The American Medical Association adopted a policy in 2023 describing BMI as an imperfect measure. It asked clinicians to use it alongside other measures, including visceral fat, body composition, and waist circumference.