List of vitamins: All 13 with RDAs and deficiency signs
A list of vitamins names the 13 essential vitamins the body needs from food or s...

8
Last Updated: Oct 8, 2026
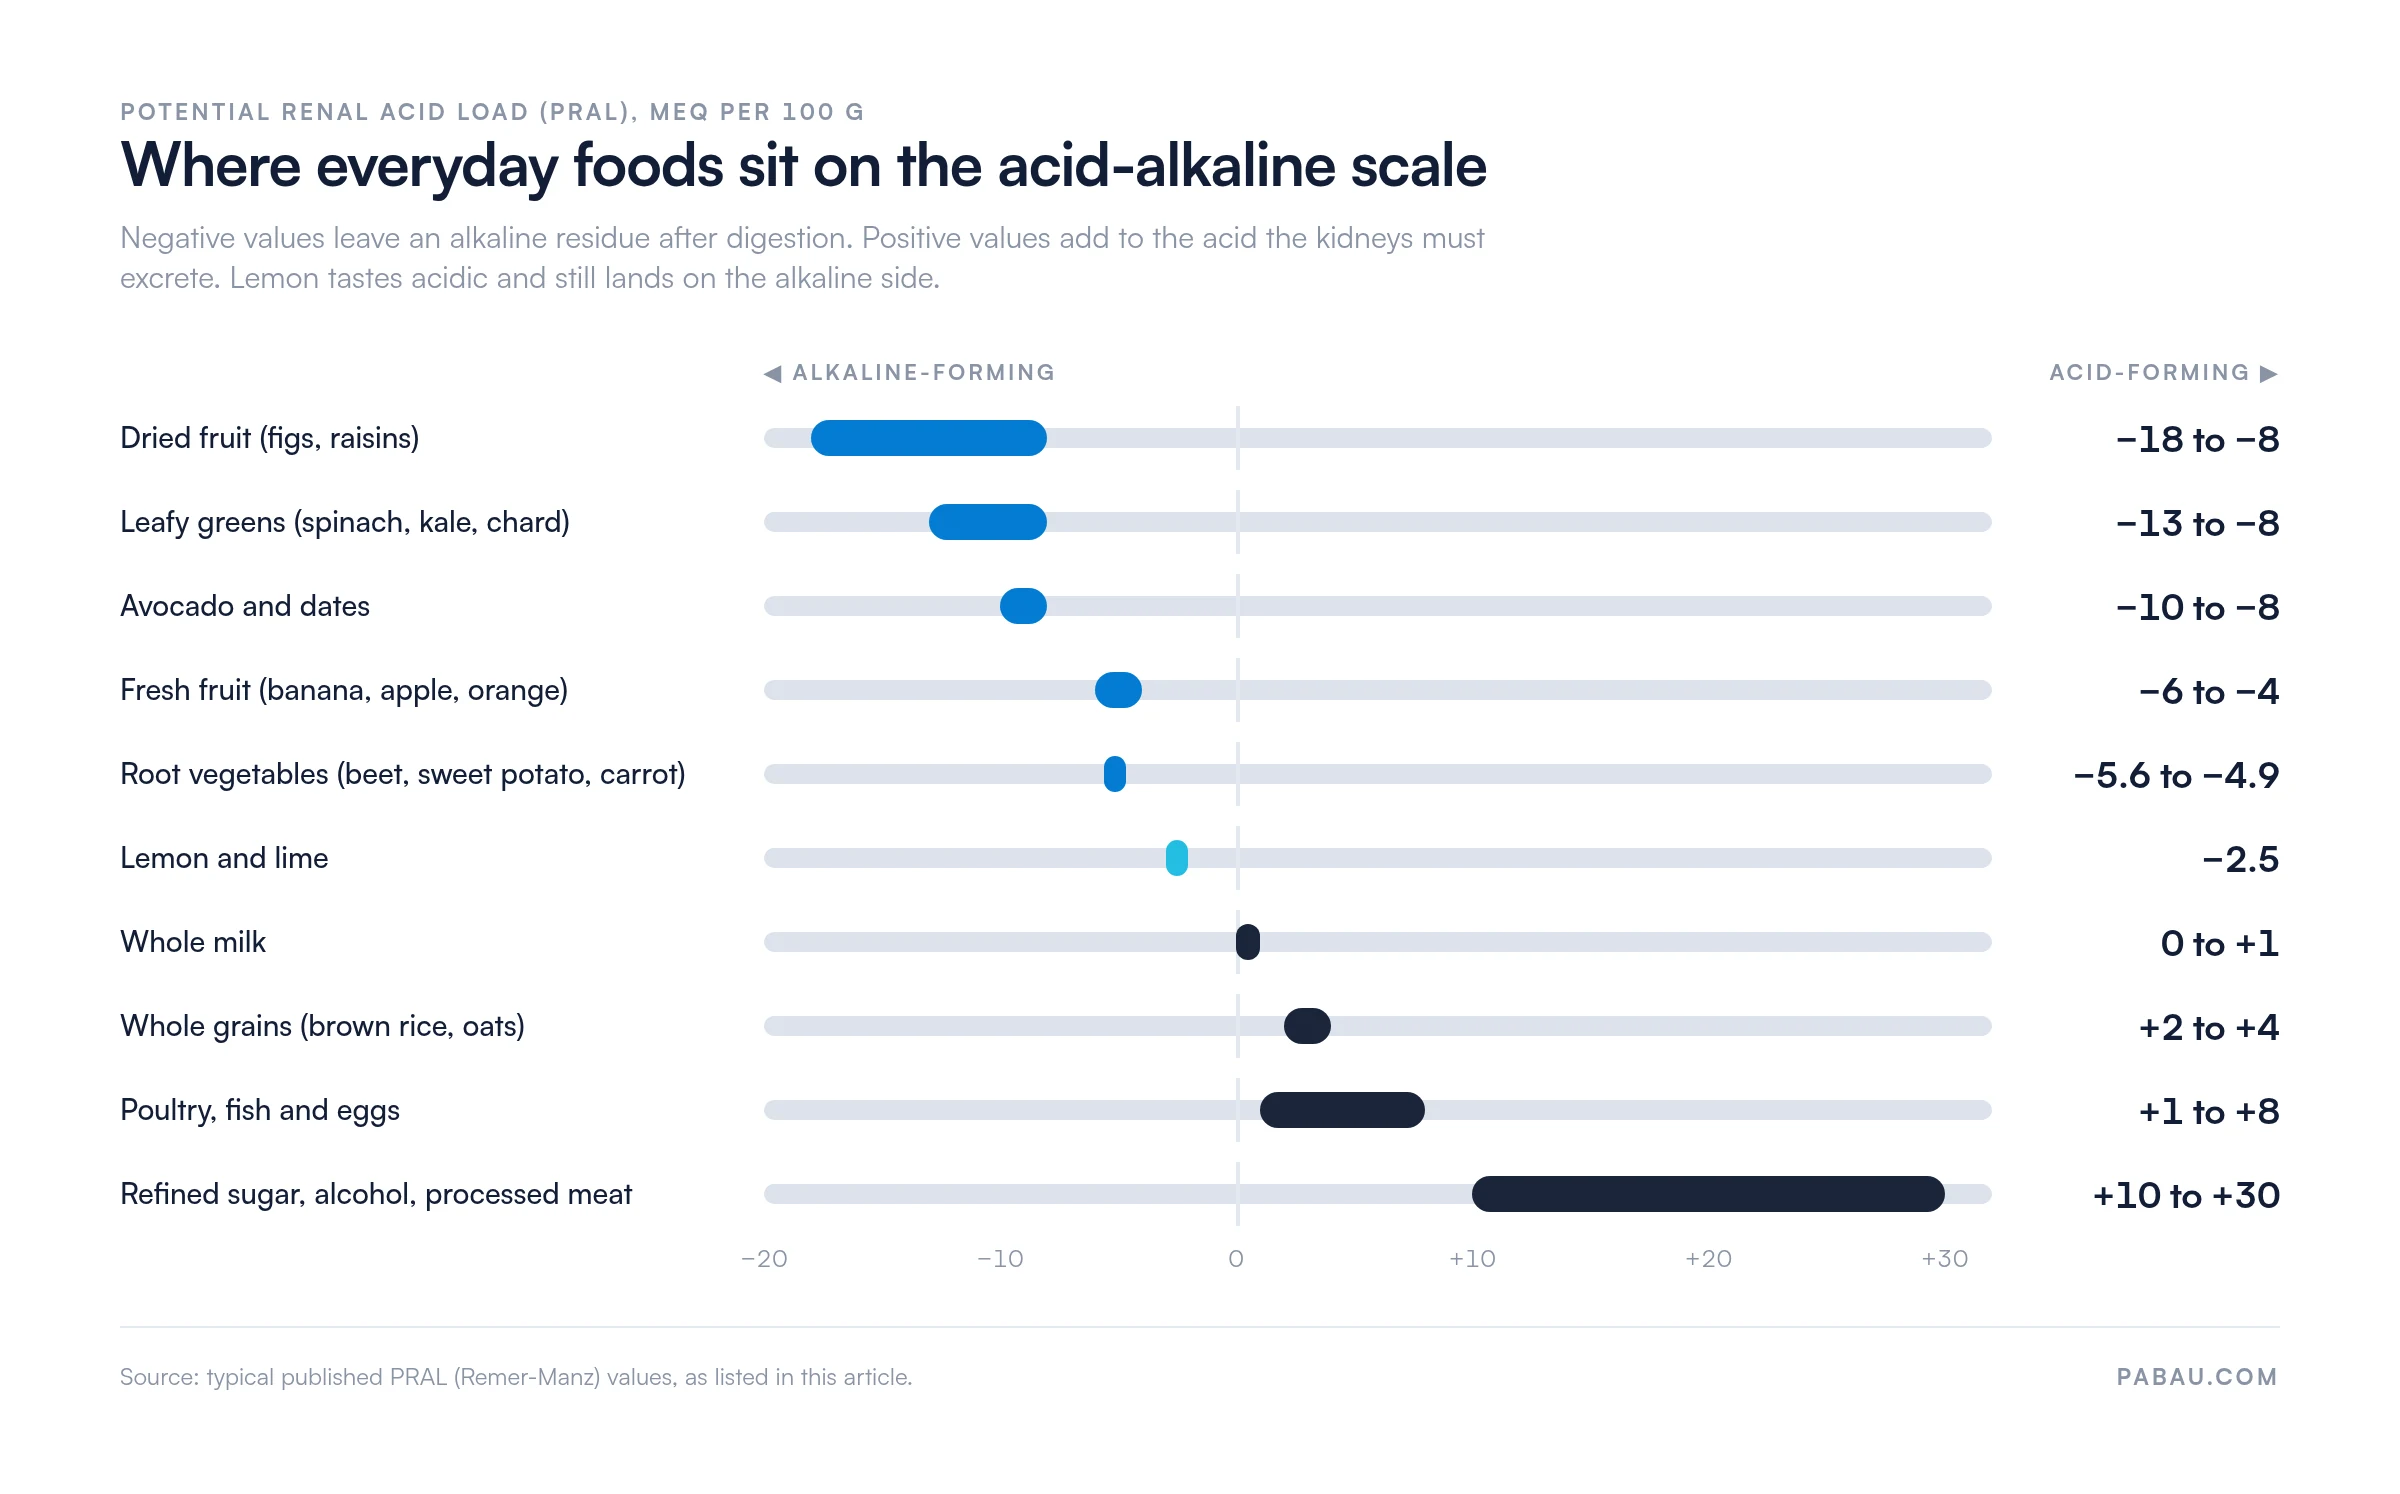
An acid alkaline food chart ranks foods by the residue they leave after digestion, measured as potential renal acid load (PRAL). Leafy greens, fresh fruit and dried fruit fall on the alkaline side, roughly -18 to -4. Refined sugar, alcohol and processed meat sit at the acid end, from +10 to +30.
The chart will not move blood pH, which holds between 7.35 and 7.45 whatever a patient eats. It gives you a structured way to discuss dietary patterns, urinary pH and net acid load instead. Download the printable version below and use it in your next consultation.
A printable reference that sorts common foods by PRAL value across five bands. It leaves space for the patient’s baseline diet, the swaps you agree on, and follow-up prompts.
Download template
The chart sorts foods by the residue they leave after digestion, not by how acidic they taste in the mouth.
PRAL values run from about -18 for dried figs to +30 for refined sugar, alcohol and processed meat.
Lemon measures pH 2 to 3 in the glass and still scores -2.5, which puts it on the alkaline side.
Blood pH holds between 7.35 and 7.45 whatever a patient eats, so counsel on dietary patterns rather than pH claims.
Practice management software like Pabau keeps the chart, the counseling note and the follow-up in one patient record.
An acid alkaline food chart is a reference tool that sorts common foods by their metabolic effect on acid-base balance. It separates a food’s raw pH, meaning how acidic it tastes, from its post-digestive effect, meaning whether it leaves an acid or alkaline residue.
The chart works from PRAL, potential renal acid load, rather than from taste or folklore. PRAL estimates how much acid the kidneys must excrete once a food has been metabolized. Practitioners running structured nutritional programs usually pair the chart with functional medicine software, so the assessment and the plan sit in one record.
The human body holds blood pH between 7.35 and 7.45 under tight physiological control. Mineral content and metabolic breakdown still influence urine pH and net acid excretion over time. That is the ground practitioners stand on when they use the chart for bone health, kidney stone risk or reflux counseling.
A well-built chart groups foods into five bands. The bands matter more than the individual numbers, because patients change meals rather than milligrams.
When you review the chart with a patient, focus on the overall pattern rather than single foods. Capturing baseline dietary habits in patient intake software tells you whether they lean acid-forming, and where one swap would do the most work.

Vegetables carry the alkaline side of the diet, and leafy greens sit furthest from zero.
The lemon paradox is the single most useful teaching point on the whole chart. Lemon is sharply acidic in the glass and alkaline-forming once metabolized, and patients need that distinction spelled out before anything else makes sense.
Acid-forming foods belong in a balanced diet. The goal is moderation and awareness rather than elimination, and several of them carry nutrients nothing else on the chart supplies.
PRAL does not suggest that these foods cause acidosis, because blood pH stays where it is. The model explains why certain eating patterns raise urinary acidity or push mineral loss over years. That matters most for patients with a kidney stone history or falling bone density.
A handful of foods land near PRAL 0 and barely move net acid load either way. They give a patient room to maneuver while the rest of the diet shifts, and two of them are commonly filed in the wrong band.
PRAL, the model Remer and Manz first published in 1995, estimates how much acid the kidneys must excrete after a food is metabolized. Foods with negative values prompt bicarbonate excretion, which is the alkaline side of the ledger. Positive values require acid excretion, and that shows up as measurably lower urine pH. The chart below plots the bands the article has just described.
Lower net acid excretion may ease the load on the kidneys and support mineral retention. That is why some patients report feeling better on an alkaline-leaning diet. The effect is modest, and diet is one lever among genetics, hydration, activity and supplement status. Preventive programs run in software for longevity clinics usually track all of those together rather than pH alone.
The chart earns its keep in specific clinical contexts, not as a wellness prop. Five of them come up often enough to be worth naming.
Dictating into an AI medical scribe puts the counseling discussion straight into the note, with the foods you named and the target you set. Follow-up then starts from what was actually agreed.

A printed chart on the fridge is where most dietary counseling ends. Write down which two swaps the patient agreed to, and check those two at the next visit rather than reviewing the whole chart again.
Where symptoms rather than pH are the target, pair it with an elimination diet reintroduction chart. That combination separates a trigger food from a merely acid-forming one, which the PRAL bands alone cannot do.
In most practices the chart is handed over as a printout and summarized in two lines of the note. The patient’s targets live on paper, the follow-up sits in somebody’s diary, and the next clinician sees none of it.
Practice management software like Pabau holds the same workflow in one place. You can build the five PRAL bands into a digital intake form, so a patient’s baseline diet is captured before they arrive. Pabau Scribe, our AI scribe, then writes the counseling discussion into the patient record as you have it.
Automated follow-ups go out on the schedule you set, and every reply lands against the same record. At the next appointment you can see what the patient changed, not only what you recommended. Every Pabau subscription includes all of this, so nothing here depends on the plan you are on.

Pabau’s digital intake forms, AI scribe and automated follow-ups capture a patient’s baseline diet and the swaps you agree on. Your counseling and your records stay in step.

The chart works best as a tool for comparing bands, not for policing individual foods. Two meals a week moved from the +10 end toward the -8 end will do more than memorizing the lemon rule.
Keep the claims where the evidence sits. Net acid load is measurable in urine, and blood pH is not a number you are moving. Saying that plainly in the consultation turns the chart into a teaching aid rather than a promise.
Download the chart, hand it out, and record what each patient agreed to change. Book a demo to see how Pabau keeps dietary counseling, follow-up and patient records in one system.

Need the intake side of the same consultation? Functional medicine intake form captures diet, symptoms and history before the patient sits down.
Chasing a trigger food rather than a pH band? Elimination diet reintroduction chart gives you a structured way to reintroduce foods one at a time.
Building a longer-term nutrition plan? Longevity diet plan sets out weekly structure for patients working on healthspan rather than a single symptom.
Working with autoimmune presentations? AIP diet plan template covers the elimination and reintroduction phases of the autoimmune protocol.
Reporting test results without overselling them? Interpreting biomarkers without overpromising sets out how to frame a marker the evidence only partly supports.
Dried figs top the scale at roughly PRAL -18, ahead of leafy greens such as spinach, kale and chard at -13 to -8. Lemon tastes sharply acidic and still scores -2.5, so it lands on the alkaline side after digestion.
Lemon juice measures pH 2 to 3 when tested raw. It becomes alkaline-forming after digestion because its potassium and other minerals are metabolized into alkaline compounds. This is the first point worth making when you introduce a patient to the chart.
No. The alkaline diet does not cure disease and does not alter blood pH, which the body holds between 7.35 and 7.45. Shifting toward alkaline-forming foods does raise vegetable and nutrient intake, which may support goals such as kidney stone prevention or bone density alongside conventional care.
Urine pH can be tested with pH paper or a digital meter, and typical readings run from 4.5 to 8 depending on diet and hydration. Blood pH needs laboratory analysis and is rarely checked, because the body regulates it tightly. Agree any testing plan with the patient’s own provider first.
It maps common foods by PRAL, a measure of how much acid or alkaline residue a food leaves once it has been metabolized. Practitioners use it to structure dietary counseling, and patients use it to see which foods shift urinary pH and net acid excretion.
Eggs are mildly acid-forming, at a PRAL value of around +8, because of their phosphorus and sulfur content. They suit an alkaline-balanced diet in moderation, but they are not one of the foods doing the alkaline work.