GLP-1 diet plan
A GLP-1 diet plan is a structured eating framework for patients taking semagluti...

2
Last Updated: Oct 13, 2026
The Yerkes-Dodson law states that performance improves as arousal rises, but only up to an optimal point, after which more stress makes performance worse. Robert Yerkes and John Dodson described the pattern in 1908. The peak sits lower for complex or unfamiliar tasks and higher for simple, well-practiced ones.
This guide goes further than the textbook curve. You’ll see what the 1908 dancing-mouse study measured, why it never mentions arousal, and how clinicians use the curve with anxious patients. We also map the curve onto a practice team’s working day with the practice task-load map.

The Yerkes-Dodson law describes an inverted U, where performance rises with arousal to an optimal level and falls as stress keeps climbing.
Complex or new tasks peak at lower arousal, while simple or well-rehearsed tasks tolerate more pressure before performance drops.
The 1908 study tested shock strength and learning speed in dancing mice, and the arousal reading only arrived with Hebb in 1955.
Clinicians can use the curve to show anxious patients why some stress helps, then track anxiety scores to see them move toward the peak.
The practice task-load map applies the same rule to a practice team, protecting complex clinical work and letting routine admin run on deadlines.
The Yerkes-Dodson law is a psychology principle stating that performance improves with arousal only up to an optimal level, after which more stress lowers performance. The optimal level is lower for difficult tasks and higher for easy ones, so the same pressure can sharpen one job and wreck another.
In psychology, arousal means how activated your body and mind are, on a scale from drowsy to panicked. The Yerkes-Dodson law of arousal and performance links that activation to how well you handle a task. You’ll also see it called the Yerkes-Dodson model, the Yerkes-Dodson principle or Yerkes-Dodson theory.
Pop versions often stop at “some stress is good.” The full Yerkes-Dodson law psychology definition adds the condition that makes it useful, which is task difficulty. Without that condition, the curve can’t tell a surgeon and a data-entry clerk apart.
Most textbooks teach the Yerkes-Dodson law in psychology as part of arousal theory. In arousal theory, the Yerkes-Dodson law is the best-known prediction about performance, while the wider theory deals with motivation.
Hans Selye’s terms eustress and distress map neatly onto the two slopes. Eustress is the pressure on the rising side that sharpens focus. Distress is the pressure past the peak, where stress starts to cost accuracy, memory and sleep.
The Yerkes-Dodson curve plots arousal against performance as an inverted U, and the peak shifts left for difficult tasks, so they need calmer conditions.
On the left sits under-arousal. The task feels dull, attention drifts and errors come from carelessness. In the middle, attention is alert but still flexible. On the right, over-arousal narrows attention and turns small slips into bigger mistakes.
Most versions of the Yerkes-Dodson law graph show a single symmetrical hump. That simplification hides the law’s most useful idea. Easy and hard tasks behave differently, which is why the chart below draws two curves instead of one.
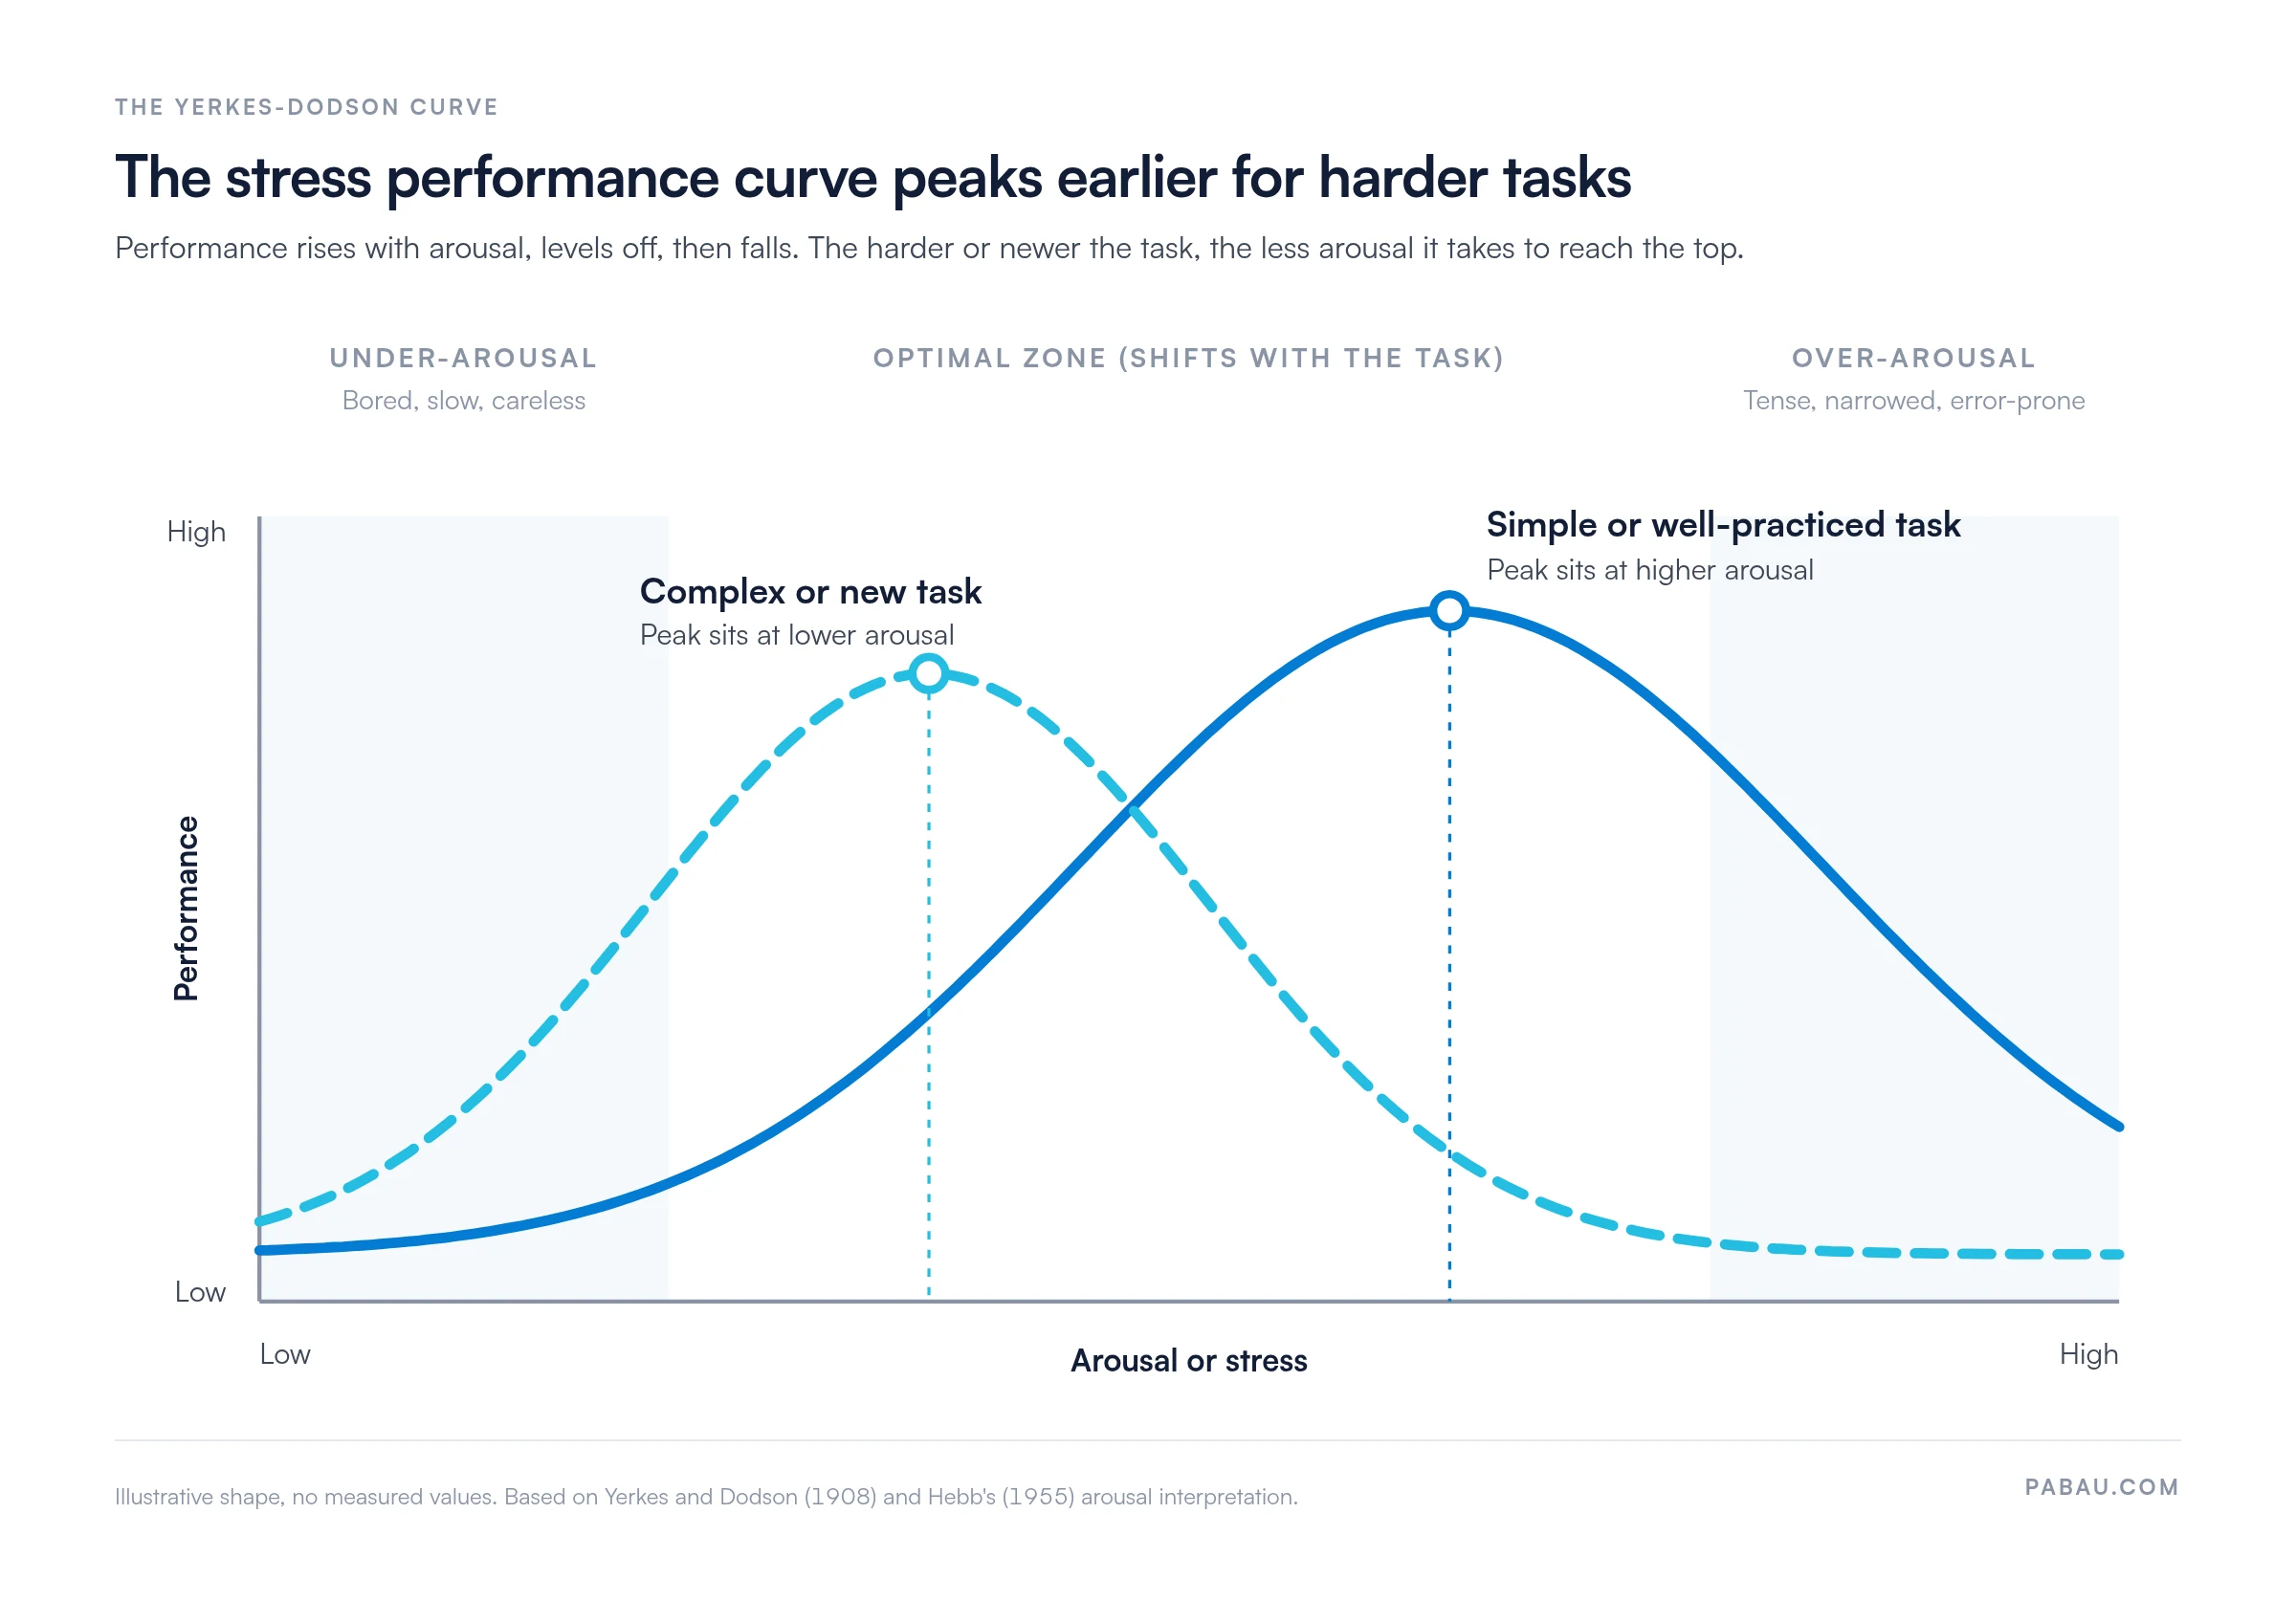
Read the Yerkes-Dodson stress curve as a stress curve model, not a measurement. Nobody can put a number on your optimum. What the curve predicts is direction, so lower the pressure for hard, new work and raise it for dull, routine work.
The stress performance curve has three zones, under-arousal, optimal arousal and over-arousal, and each one has its own physical and mental signs.
Physiological arousal is the body’s side of the story. Heart rate, breathing rate, sweating, muscle tension and cortisol all rise as the sympathetic nervous system gears up. A pounding heart before a presentation is a textbook example of physiological arousal.
Why do complex tasks suffer first? Easterbrook’s cue-utilization hypothesis from 1959 offers a mechanism. As arousal rises, attention narrows onto the most central cues. On a simple task, losing peripheral details costs little. On a complex task, those details often decide the outcome.
That narrowing is how the Yerkes-Dodson law stress effect plays out in clinical work. A hurried clinician still takes the blood pressure but misses the medication the patient mentioned in passing.
Yerkes and Dodson found that dancing mice learned an easy discrimination fastest under strong shocks, but a difficult one fastest under weaker shocks.
The Yerkes-Dodson law original paper is “The relation of strength of stimulus to rapidity of habit-formation.” It appeared in 1908 in the Journal of Comparative Neurology and Psychology, volume 18, pages 459 to 482. You can read the full text free at Classics in the History of Psychology.
The setup was simple. Each mouse chose between two boxes, one marked white and one marked black, and entering the black box earned an electric shock. The researchers made the task easy, medium or hard by changing how different the two boxes looked in brightness.
They then varied the shock strength and counted how many trials each group needed to learn to pick the white box every time.
Note what the paper did not say. The word arousal never appears, and Yerkes and Dodson measured learning speed rather than performance. A 2024 review in Trends in Cognitive Sciences points out that the easy condition showed a straight-line effect. The curved pattern belonged to the harder tasks.
That review’s author, Sander Nieuwenhuis, suggests “Hebb’s curve” would be a more accurate name. The timeline below shows how a mouse-learning result became a universal stress rule.
The Yerkes-Dodson law and optimal arousal theory overlap but aren’t the same, because the law predicts performance and the theory explains motivation.
Optimal arousal theory grew out of Hebb’s work in the 1950s. It says people are motivated to keep their arousal near a comfortable middle level. Bored people seek stimulation, and overwhelmed people seek calm. The Yerkes-Dodson law is narrower, describing how arousal and task difficulty together shape performance.
Yerkes-Dodson law examples show up wherever pressure meets skill, from a therapy session to an exam hall to a practice front desk.
Take a patient with social anxiety preparing for a job interview. Their arousal already sits on the falling slope, so advice to “get pumped up” pushes them further past the peak. The useful move is to bring arousal down to the peak.
The opposite case is common too. A patient recovering from burnout may aim for a life with no pressure at all, then feel flat and unmotivated. A small, chosen challenge moves them back up the rising slope.
Therapists we speak with often sketch the curve in an early session. Patients quickly grasp that the goal is a sweet spot, which makes later exposure or activation work feel less arbitrary. A window of tolerance worksheet gives patients a similar picture of their own range.
Here is a Yerkes-Dodson law example from the front desk. A receptionist checking in a full waiting room copes well, because the task is rehearsed. Ask the same person to learn a new billing system during that rush, and errors climb.
Under-stimulation hurts too. Staff who spend afternoons on repetitive work with no deadline drift, and small errors creep in. Chronic overload sits at the other extreme, and the signs of therapist burnout often start as slower decisions and shorter tempers.

Test anxiety is the classic case. A student who knows the material can still blank on complex questions when arousal spikes, because recall and reasoning are the first to suffer.
Sport shows the task-difficulty rule clearly. A basketball free throw is simple and heavily rehearsed, so experienced players can handle a loud arena. A complex play that depends on reading the defense needs a calmer head.
The practice task-load map applies the Yerkes-Dodson rule to a practice team’s day, sorting tasks by difficulty and setting the right pressure for each.
The map is a framework we built from the literature’s task-difficulty finding, not a measured study. Use it to decide where deadlines help your team and where they hurt.
Three decision rules turn the map into daily choices.
The cheapest change on the map is usually the consult slot. Protecting it costs some calendar space and guards against the most expensive kind of error.
For patients with chronic anxiety or burnout, the clinical job is to find where they sit on the curve and move them toward the peak.

The optimal point differs because personality, trait anxiety, skill, trauma history and conditions such as GAD or ADHD all shift each patient’s peak.
A patient with high trait anxiety often starts the day close to the peak, so a small stressor tips them over. Some patients with ADHD describe needing more stimulation to engage, which fits the under-arousal side. Practice matters too, because rehearsal moves a task toward the simple end.
Screening helps separate these profiles. A generalized anxiety disorder checklist is a quick first step before a fuller assessment.
Four validated scales cover most needs, from self-reported stress to clinician-rated anxiety severity.
Score the same tool at intake and every few sessions. A falling BAI or STAI state score, alongside better day-to-day functioning, suggests the patient is moving back toward the peak.
The Yerkes-Dodson law’s main strength is its well-supported task-difficulty idea, and its main weakness is a “law” label that oversells thin original evidence.
Here are the strengths and weaknesses of the Yerkes-Dodson law, claim by claim.
Treat the curve as a direction-finder, not a formula. Lower the pressure for hard work, raise it for dull work, and measure the result rather than assuming it.
Many therapists already score anxiety scales, but the scores end up scattered across paper forms, PDFs and session notes. That scatter makes it hard to see whether a patient is moving along the curve.
Pabau, the practice management platform we build for therapy and healthcare practices, keeps those measures in one patient record. Send the STAI, BAI or PSS as digital questionnaires before a session, and the answers land in the patient’s file automatically.
Because each score sits beside the session note, you can compare intake with week eight at a glance. Pabau stores records with HIPAA-compliant security and GDPR-compliant handling. Consent forms are signed digitally and filed in the same record.
The same therapy practice management platform covers scheduling, reminders and billing, so admin eats less of your session prep time.
Comparing tools first? Our guide to the best therapy practice software sets Pabau beside the main alternatives.


Pabau sends STAI, BAI and PSS questionnaires as digital forms and files every score in the patient record. You see progress over sessions at a glance, without chasing paper.

The Yerkes-Dodson law is most useful once you stop treating it as one curve. Ask how hard the task is for this person today, then set the pressure to match.
For patients, that means calming the anxious and gently challenging the flat. For your team, it means protecting complex clinical work and letting routine admin run against a clock. The trade-off is that you’ll need to measure, because the peak moves.
Book a demo to see how Pabau keeps anxiety scores, session notes and consent in one record for your therapy practice.

Need a quick stress screen? Stress assessment questionnaire gives you a ready-made form for intake.
Measuring stress alongside mood? The DASS-21 scale scores depression, anxiety and stress in one short questionnaire.
Helping patients lower arousal fast? Breathing exercises handout walks patients through techniques they can use between sessions.
Working with patients at the far end of the curve? Panic disorder treatment covers the main therapy and medication options.
Curious how arousal and emotion connect? The Cannon-Bard theory explains another classic model of emotion and physiology.
The Yerkes-Dodson principle holds that performance rises with arousal up to a moderate peak, then declines as stress keeps rising. The peak arrives sooner on difficult tasks than on easy ones.
No, but the two are closely related. The theory of optimal arousal explains why people seek a comfortable middle level of stimulation. The Yerkes-Dodson law predicts how arousal and task difficulty affect performance.
A moderate level of arousal is best for most tasks. Complex or unfamiliar tasks need a lower level, while simple, well-practiced tasks can handle higher arousal before performance drops.
The arousal theory of motivation says people try to keep their physical and mental activation at an optimal level. Bored people seek stimulation, overwhelmed people seek calm, and performance tends to peak in between.