GLP-1 diet plan
A GLP-1 diet plan is a structured eating framework for patients taking semagluti...

2
Last Updated: Oct 13, 2026

A BMP measures eight blood chemistry markers: glucose, calcium, sodium, potassium, bicarbonate, chloride, BUN, and creatinine.
Reference ranges vary slightly by lab. Creatinine also differs by sex, at about 0.7 to 1.3 mg/dL in men and 0.6 to 1.1 mg/dL in women.
Abnormal results point to kidney impairment, electrolyte imbalance, glucose dysregulation, or metabolic acidosis, and each finding needs clinical correlation.
Collection problems such as hemolysis or a long tourniquet time can make potassium read high when the patient is fine.
Practice management software like Pabau files lab results straight into the patient record, so the numbers stay with the visit they belong to.
A one-page reference chart covering all eight basic metabolic panel components, their normal ranges, interpretation guidance, and the fishbone layout. Print it for the exam room or use it in patient education.
Download templateA BMP chart lists the eight markers in a basic metabolic panel next to their normal reference ranges and what an out-of-range value usually means. Clinicians reach for it at three moments: ordering the panel, reading the result, and explaining it to the patient.
This guide covers the reference ranges and how to read a panel as a system. It also covers the collection errors that create false abnormalities, and when a CMP is the better order.
A BMP chart displays the eight substances measured in a basic metabolic panel blood test. Those markers cover kidney function, electrolyte balance, glucose control, and acid-base status.
The panel is ordered in primary care, before surgery, during chronic disease management, and whenever a clinician needs a quick read on metabolic stability. Each marker tells a different clinical story, and an out-of-range value usually triggers follow-up testing.
The eight components are glucose, calcium, sodium, potassium, bicarbonate (CO2), chloride, blood urea nitrogen (BUN), and creatinine. Most practices attach the order to a lab request form that records the indication and the patient’s fasting status.
Reference ranges vary slightly between labs because of testing methods, equipment, and reagents. The values below are the standard adult ranges used in most US clinical settings, and they match the intervals published by MedlinePlus. Verify your own lab’s interval before you act on a result.
Creatinine is the one component where sex changes the range routinely, because the value tracks muscle mass. Reading a woman’s creatinine against a male range hides early kidney impairment.
Print the table for the exam room or save it to your EMR template folder. Bicarbonate appears on most panels as total CO2.

Interpretation starts with the reference range and ends with the patient in front of you. Most labs flag the abnormal values, and the clinical context decides what they mean.
Turning this scale into a digital form with form capture software removes double entry and keeps every score legible.
Out-of-range values point to metabolic, renal, or electrolyte disturbance. The table maps high and low findings to the causes worth considering first.
Diet moves two of these markers on its own. BUN rises on a high protein diet plan with no kidney disease present, which is why the BUN-to-creatinine ratio matters more than BUN alone.
A raised BUN alongside a raised creatinine may reflect volume depletion or an acute kidney injury, and the distinction changes management.
Before working up an abnormal value, rule out the draw itself. Six pre-analytical problems account for most results that look pathological on paper and normal on repeat.
A repeat draw answers most of these questions faster than a workup does. Note the collection details on the chart, so the next clinician reading the result knows what to trust.
The fishbone is a visual shorthand clinicians and students use to lay out BMP values. It arranges the eight results so that related markers sit together.
The layout: sodium, potassium, and chloride sit on one spine for the electrolytes. Bicarbonate sits on another for acid-base. BUN and creatinine form the kidney spine, and glucose and calcium complete the pattern. Grouping them this way makes a shared cause easier to spot than eight separate flags. Treatment photos attached to the note make the progression readable without hunting through a phone gallery.
The fasting glucose range has a second use outside the blood panel. Normal pleural fluid glucose mirrors serum glucose, and a reading below 60 mg/dL narrows the differential sharply.
Keeping the same order in the patient record means each new panel can be read against the last one at a glance.
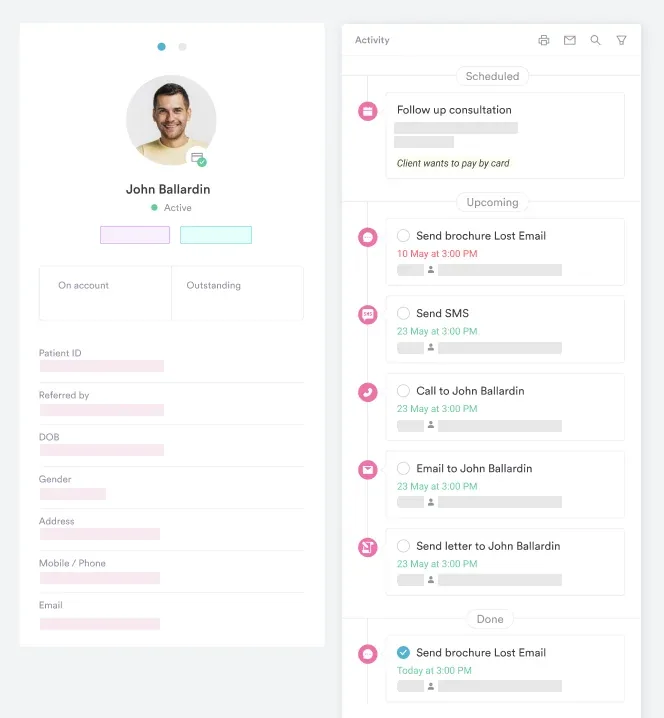
Save the chart in your EMR template library and attach it to your standard metabolic workup order. Many clinicians also keep a laminated pocket copy, which beats scrolling for a reference mid-visit.
The comprehensive metabolic panel includes all eight BMP components plus six liver and protein markers: albumin, total protein, ALT, AST, alkaline phosphatase, and bilirubin. The choice between them comes down to clinical indication.
Order a BMP when you need speed and a metabolic screen. Order a CMP when liver disease, malnutrition, or a broader systemic illness is in question. The CMP is billed under 80053, so the two are not interchangeable on a claim. What each one costs the patient depends on the payer and the lab.
Clinical scenarios that warrant a BMP include:
ARBs act on the renin-angiotensin pathway as well, so potassium and creatinine still need watching. An ARB dosing reference sets the baseline check and the recheck one to two weeks after the first dose.
Conventional DMARDs belong in the same group. Creatinine is rechecked every four to twelve weeks, and the DMARD monitoring requirements are easiest to track when they sit beside each prescription.
Induction therapy for systemic lupus erythematosus (SLE) runs on a tighter schedule. A complete blood count and a metabolic panel are ordered every four to eight weeks. An SLE drug monitoring list ties that interval to each drug class.
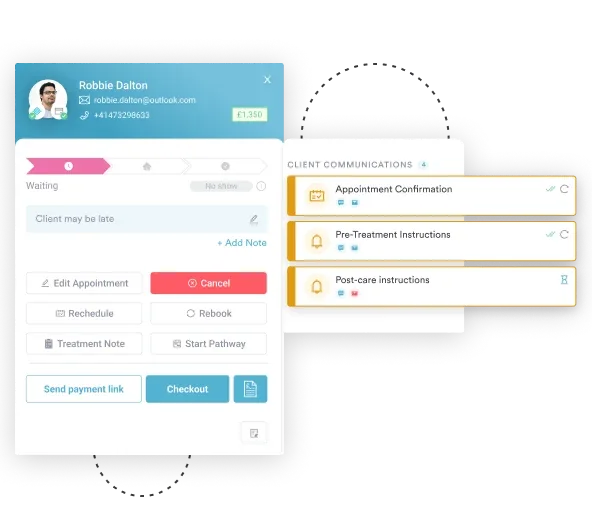
In most practices a BMP result still moves by hand. It arrives by fax or portal, someone types the values into the note, and the comparison with the last panel happens from memory.
Practice management software like Pabau files the result against the patient instead. Its lab management features land the values in the record and highlight what sits outside range.
That also settles the paperwork. Every result stays attached to the visit it belongs to. Practices running several locations get one record to look in rather than three.
The outcome is less typing and fewer transcription errors, so your clinical time goes to the patient rather than the chart.
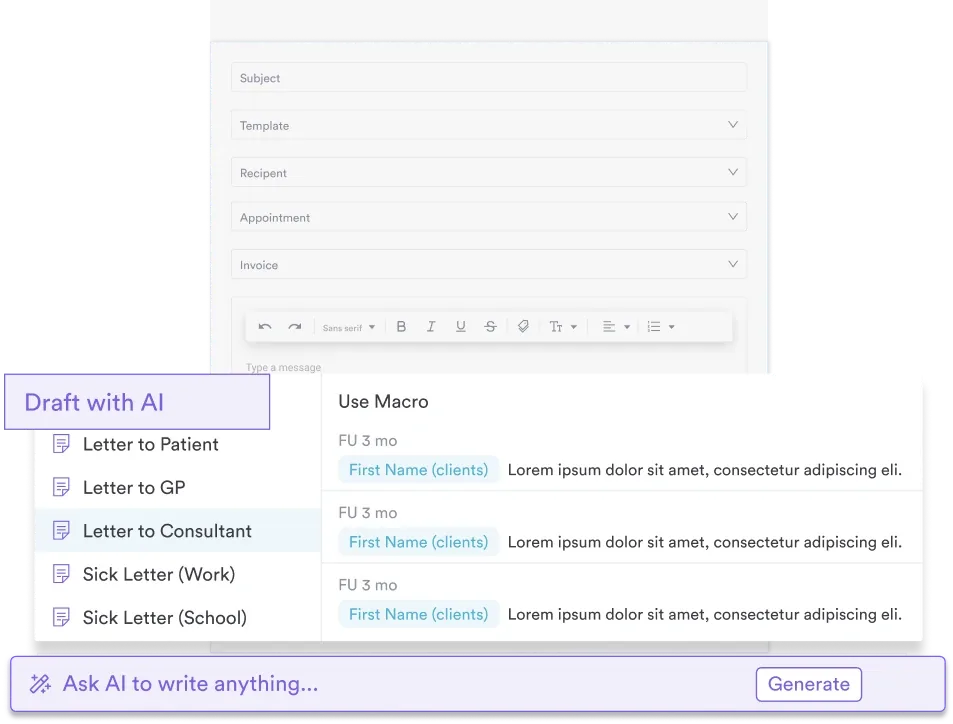

Pabau files BMP results into the patient record, highlights the values outside range, and prompts the follow-up you set. Your team stops retyping numbers from a fax.

A BMP is only useful if the comparison is quick. Keep the ranges within reach, read the eight values as one system, and rule out the draw before you chase an odd result.
The free BMP chart PDF is ready to print for the exam room or to walk a patient through their results. Laminated or filed in your EMR templates, what counts is having it where results actually get read.
The time drain in most practices is transcription, not interpretation. Book a demo to see how Pabau files lab results into the patient record and flags what needs your attention.

Investigating joint pain and stiffness? Rheumatoid arthritis test explains what RF, anti-CCP, CRP and ESR results each mean.
Documenting a workplace drug screen? 12-panel drug test report template covers cutoff levels, specimen validity, and chain of custody.
Assessing liver or kidney function from labs? Albumin blood test template covers normal ranges and abnormal result meanings for liver and kidney disease.
Ordering an autoimmune antibody panel? ANA levels chart template helps you track titer levels and document immunofluorescence patterns.
A BMP chart is a reference template listing the eight components of a basic metabolic panel with their normal ranges, units, and interpretation notes. The eight are glucose, calcium, sodium, potassium, bicarbonate, chloride, BUN, and creatinine. Clinicians use the chart to order, read, and document results quickly.
Frequency depends on clinical context. Wellness visits usually mean annual screening. Chronic conditions such as diabetes, hypertension, and kidney disease are commonly monitored every three to six months. Acute illness or a medication change is tested as clinically indicated. Follow the guidelines for your specialty and patient population.
The BMP measures eight blood chemistry markers: glucose, calcium, sodium, potassium, bicarbonate (CO2), chloride, blood urea nitrogen (BUN), and creatinine. Together they assess kidney function, electrolyte balance, glucose control, and acid-base status.
The BMP has eight components. The CMP has all eight plus six liver and protein tests: ALT, AST, alkaline phosphatase, bilirubin, albumin, and total protein. Order a BMP for routine metabolic screening. Choose a CMP when liver function or a broader systemic picture matters.
Standard adult ranges are glucose 70-100 mg/dL fasting, calcium 8.5-10.5 mg/dL, sodium 135-145, potassium 3.5-5.0, bicarbonate 22-28, and chloride 96-106 mEq/L. BUN runs 7-20 mg/dL. Creatinine runs 0.7-1.3 mg/dL in men and 0.6-1.1 mg/dL in women. Check your own lab’s intervals, since they vary slightly.
The fishbone groups the components into four sets: electrolytes (Na, K, Cl), acid-base (HCO3), kidney function (BUN, creatinine), and metabolic markers (glucose, calcium). The layout makes a shared cause easier to see, since abnormal electrolytes sitting together usually point to one problem rather than isolated errors.