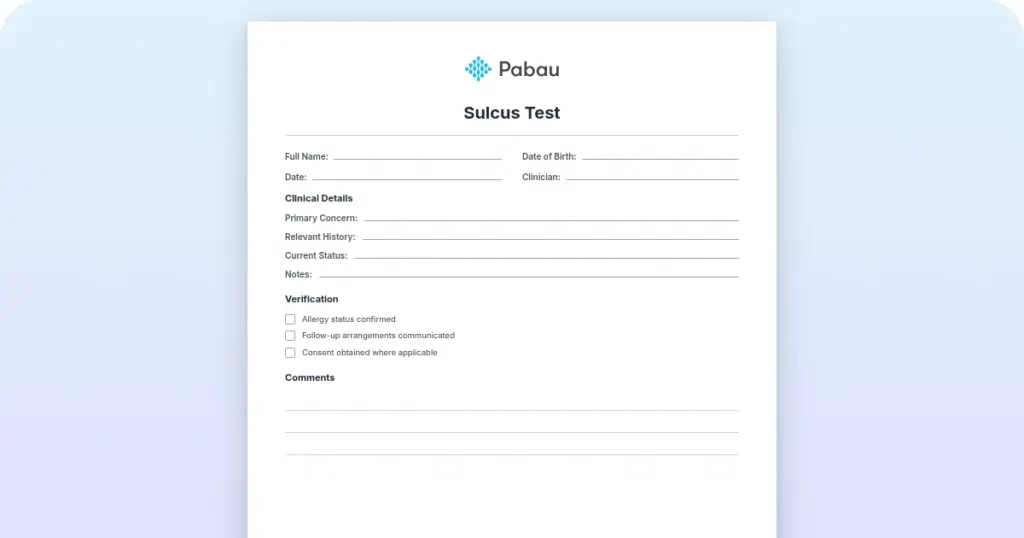
Sulcus Test: Shoulder Instability Assessment
The sulcus test is an orthopedic special test that checks for inferior glenohume...

3
Last Updated: Oct 22, 2026
A barometric pressure pain scale is a tracking tool that pairs a patient’s daily 0-10 pain score with that day’s atmospheric pressure reading. Over a few weeks, it shows whether pain follows pressure changes. Clinicians can then predict flare-ups and adjust care a day or two ahead.
The template adds body location, medication timing and a field for the patient’s personal trigger threshold. That turns “my pain gets worse when it rains” into data you can review at a follow-up.
Patients with fibromyalgia, migraine, arthritis and Ehlers-Danlos syndrome (EDS) often report weather-related flare-ups. The scale gives those reports a structure, so clinicians can confirm a pattern, find the threshold and plan treatment around it.
A one-page log that pairs daily barometric pressure readings with a 0-10 pain score and a body location map. It also holds a field for the patient’s flare-up threshold once the pattern is clear.
Download template
A barometric pressure pain scale pairs a 0-10 pain score with daily atmospheric pressure readings to show each patient’s own weather-pain pattern.
Proposed mechanisms include slight tissue expansion as pressure falls, but causation is not established and responses differ from patient to patient.
The size and speed of a pressure change matter more than the reading itself. Drops of roughly 6-10 hPa within 24 hours are commonly reported triggers.
Pabau, the practice management platform we build, offers digital intake forms that capture pressure and pain data. Each entry lands in the patient record.
A barometric pressure pain scale is a log that records pain intensity alongside the day’s atmospheric pressure. Pain is scored on the 0-10 numeric pain rating scale. Pressure goes in as millibars (mb) or hectopascals (hPa), which are the same unit.
Unlike a general pain journal, it anchors each subjective score to an objective environmental reading. That structure serves three clinical purposes:
Each entry on the template captures:
Proposed mechanisms link falling pressure to pain through the tissues themselves. When atmospheric pressure drops, as it does before rain or storms, less pressure pushes on the body from outside. Muscles, tendons and the synovial fluid in joints may expand slightly in response.
That expansion may press on nerves in confined spaces, such as the carpal tunnel or an arthritic joint, and worsen pain signals. Patients with fibromyalgia, a condition marked by centralized pain amplification, report heightened sensitivity to these shifts.
Barometric pressure is associated with pain changes in many patients, but causation has not been established. Responses also vary widely. Some patients worsen as pressure drops before a storm, while others react to rising pressure as a high-pressure system arrives.
The scale captures that variation, so treatment changes rest on the patient’s own data instead of guesswork.
Fibromyalgia, migraine, arthritis and EDS are the conditions where patients most often report pressure-related pain:
Pressure below the sea-level standard of 1013 hPa (29.92 inHg) is generally called low, and readings under 1000 hPa usually mean rain or storms. Pressure is measured in millibars (mb), hectopascals (hPa) or inches of mercury (inHg).
For pain tracking, the direction and speed of change matter more than where the reading sits in this table. Falling pressure, especially drops of several hPa within 24 hours, is the commonly reported trigger. Individual thresholds still vary, which is why the log records the reading and the daily change.
The template works through five steps, and the timeline below them shows how long each stage takes.
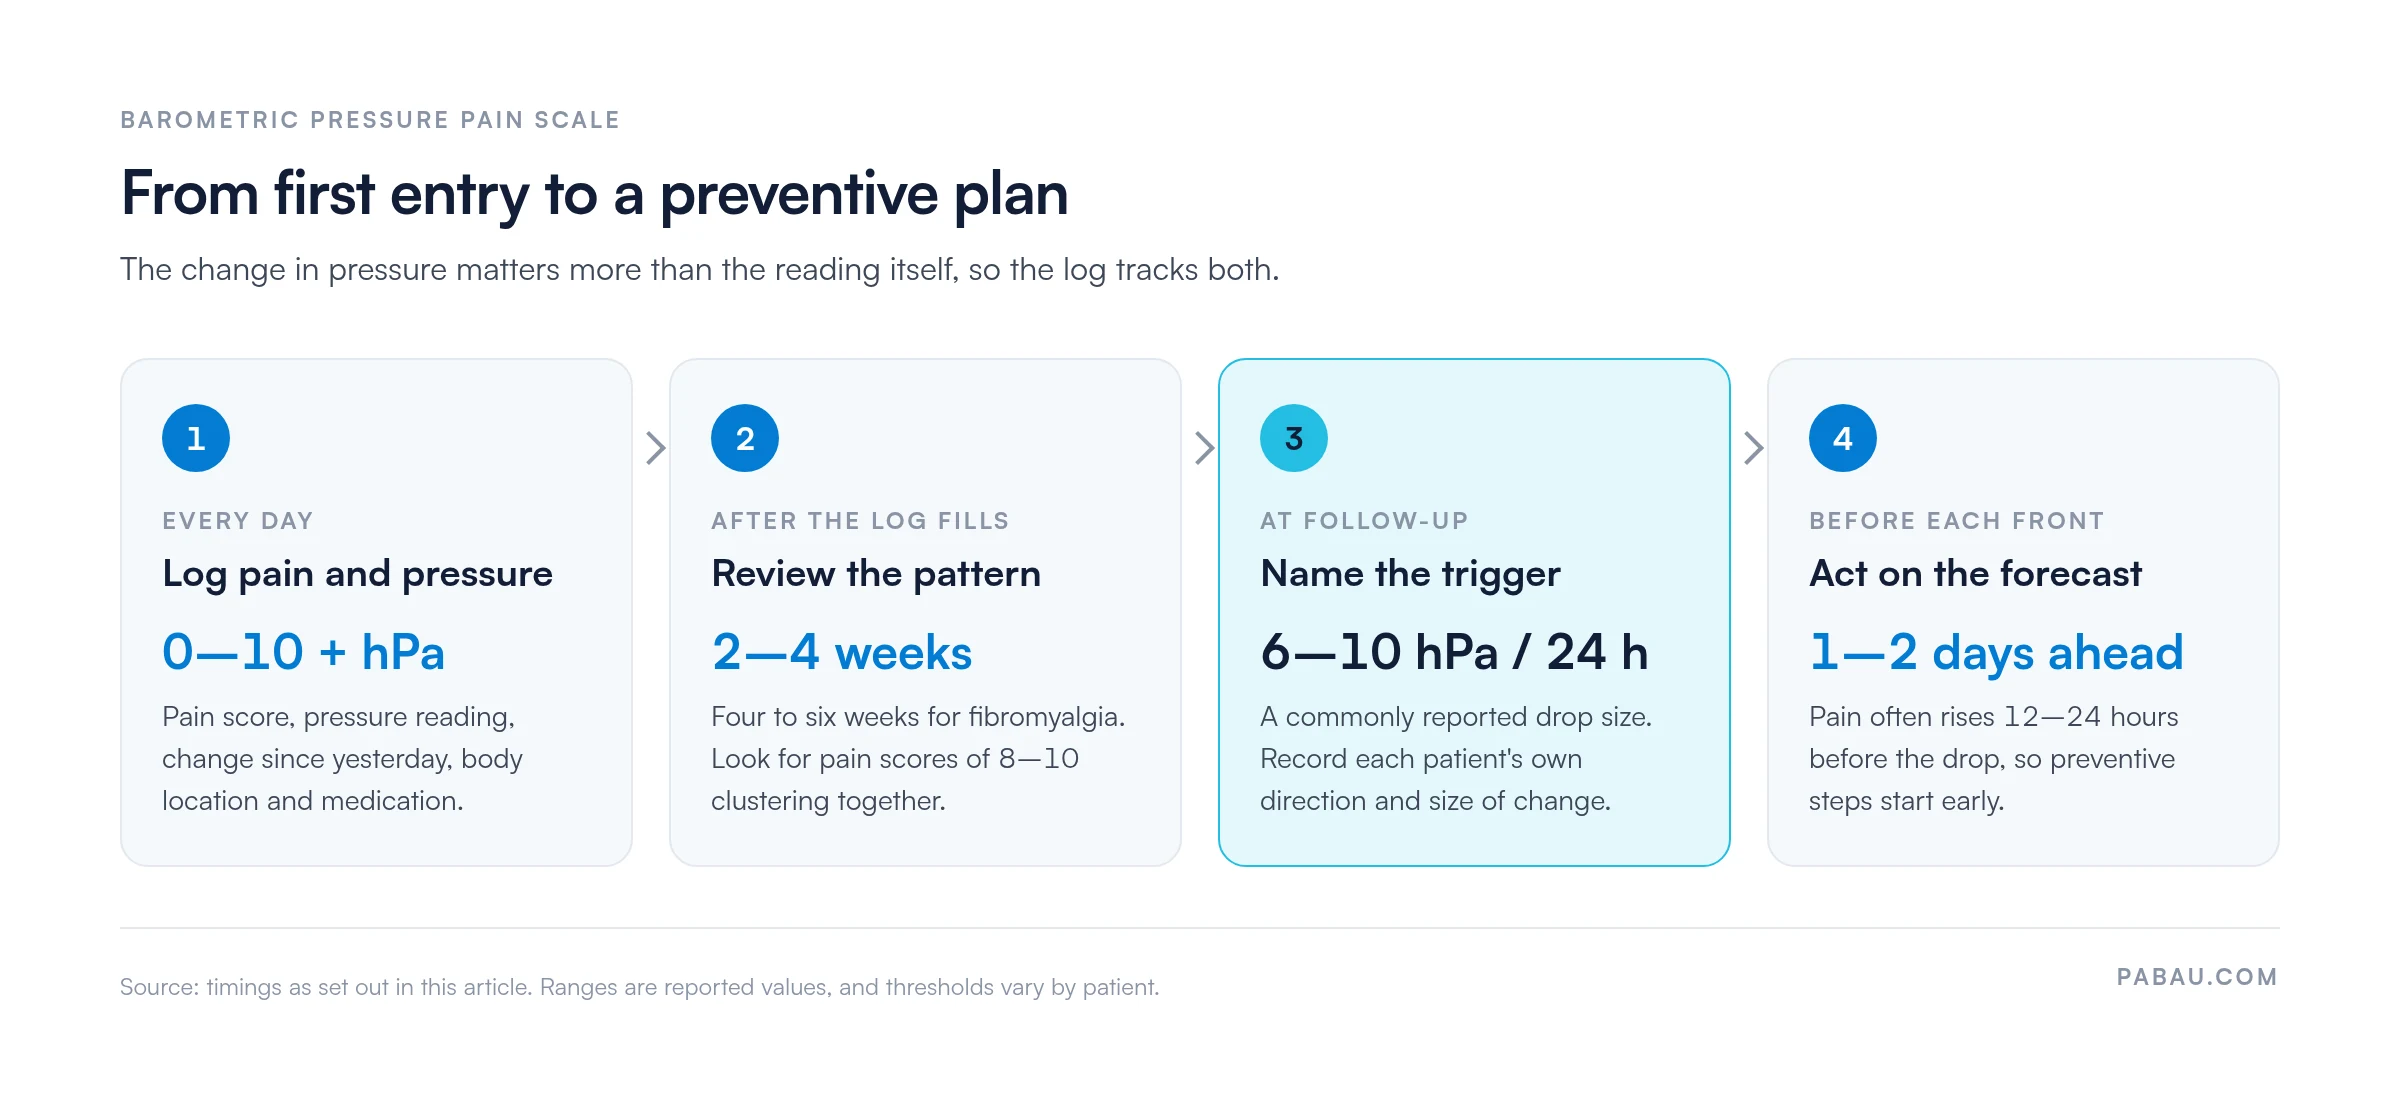
After 2-4 weeks of consistent entries (4-6 for fibromyalgia), patterns start to show. Plot pain scores on the y-axis against pressure readings on the x-axis. Clinicians should look for:
Migraine patients often describe a quicker link between a pressure drop and an attack. Adapt the log to capture migraine-specific detail:
Pressure is one of several weather factors reported as migraine triggers. Logging temperature and humidity alongside it can sharpen the pattern further.
Fibromyalgia patients typically show more varied responses than migraine patients. In the 2019 PLoS ONE study, lower pressure was linked to higher pain overall, but eight of the 48 patients felt worse as pressure rose.
That spread is why individual tracking matters here. Advise fibromyalgia patients to use the template daily for 4-6 weeks, so their own pattern has time to emerge.
The scale sits alongside the other pain assessment scales you already use, adding weather context to routine scoring.
Lighter activity works better when the patient has a schedule to follow. A stationary bike exercise plan gives them a low-impact option for the days a pressure drop is forecast.
On paper, the log goes home with the patient and comes back weeks later, often with missing days. Someone then retypes the scores or scans the sheet into a file that is hard to search.
Pabau’s digital forms let you rebuild the template as an online form that patients fill in from their phone. Each entry saves to the patient’s file in Pabau’s medical records software, next to treatment notes and the clinician’s threshold notes.
Practices that also run Pabau as their physical therapy EMR keep exercise plans, session notes and the pressure-pain log in one place. You review the pattern on the same screen you use to book the next session.

Pabau’s digital forms capture daily pain and pressure entries, and Client records keep them beside treatment notes. The pattern is ready to review at every follow-up.

A barometric pressure pain scale earns its place when a patient keeps saying the weather drives their pain. Two to four weeks of daily entries either confirm a trigger you can plan around or rule pressure out. Both answers change the care plan.
The trade-off is effort. The log only works if the patient fills it in daily, so keep it short and review it at the first follow-up. Once a threshold is clear, you can predict flare-ups a day or two ahead instead of reacting after they start.
Book a demo to see how Pabau keeps pain logs, threshold notes and follow-ups in one patient record.

Need to map where the pain sits? Body pain chart gives patients a front-and-back outline to mark each painful area.
Prefer a line over a number? Visual analogue scale (VAS) explains how to score pain on a 100 mm line and when it beats a 0-10 scale.
Tracking pressure-sensitive knee or hip pain? WOMAC osteoarthritis index measures pain, stiffness and function in osteoarthritis over time.
Want each score explained? Pain scale 1-10 describes what every point on the scale means to a patient.
Running a full pain assessment? PQRST pain assessment form walks through provocation, quality, region, severity and timing.
Studies show an association in many patients, though causation is not established. Psychological factors, such as anticipation, stress and seasonal mood changes, can also amplify perception. A barometric pressure pain scale records both the pressure reading and the pain score, so you can see whether a pattern holds.
Accuracy varies by person and condition, and personal tracking is not a validated forecasting tool. Its value is individual. Once a patient’s trigger threshold is clear, a forecast pressure drop gives enough warning for practical preventive planning.
Yes. A standard 0-10 numeric rating scale tracks pain intensity well on its own. Adding pressure readings links pain changes to the weather, so you can separate weather-driven pain from activity, medication timing or stress.
Free readings are available from Weather.com, AccuWeather or local weather station websites. Most apps show pressure in millibars (hPa) or inches of mercury (inHg). Ask patients to record the reading at the same time each day, or whenever they score their pain.
A lack of correlation is still useful. It rules out pressure sensitivity as a pain driver for that patient and shifts focus to activity patterns, medication timing, stress, sleep or inflammation. Use the data to set treatment targets instead of continuing weather-focused steps.
Not without direct clinical oversight, because timing and dosing remain the clinician’s responsibility. Once a threshold is clear, a clinician may time preventive doses, such as starting a nonsteroidal anti-inflammatory 12-24 hours before forecast low pressure. Any change needs a documented clinical decision and the patient’s agreement.
No. Patients with arthritis, migraine, EDS and fibromyalgia report the strongest links. Pain driven mainly by infection or nerve injury may show less pressure sensitivity. The scale helps each patient find their own response instead of relying on a population average.