CRM for chiropractors: how to manage patients, bookings and marketing
A CRM for chiropractors is a patient relationship management system built around...

Last Updated: Oct 13, 2026

A body pain chart is a visual assessment tool that uses a front/back body silhouette for patients to mark pain location, type, and severity. It’s a clinical standard in physiotherapy, MSK practices, chiropractic, and pain management.
The chart captures four data points: pain location (marked on the diagram), pain sensation (ache, burning, cramping, numbness, pins and needles, stabbing, or throbbing), pain severity (rated 0-10), and pattern changes over time, together enabling evidence-based treatment planning.
Patients mark each pain sensation with a checkmark from a checklist (ache, burning, cramping, numbness, pins and needles, stabbing, throbbing, or other) rather than a symbol code. There’s no universal industry-standard symbol legend for pain charts, so this checklist format keeps the chart simple for patients to complete unassisted.
Practice management software like Pabau offers digital intake forms with embedded body pain documentation, integrating pain assessments directly into a patient’s unified clinical record, enabling longitudinal tracking across multiple visits and eliminating paper-to-digital transcription burden.
A ready-to-use diagram tool featuring front and back body silhouettes with pain marking zones, a severity rating scale (0-10), a pain-sensation checklist, and fields for treatment notes. Suitable for physiotherapy, chiropractic, osteopathy, MSK practices, sports medicine, and pain management practices.
Download templateA body pain chart is one of the most practical clinical assessment tools for documenting where and how a patient experiences pain. Unlike generic questionnaires, the chart provides a visual, standardized method that lets patients mark their own pain location, describe its sensation, and rate its intensity on the diagram itself.
This approach reduces misunderstanding, speeds up intake, and creates an objective baseline for measuring treatment progress over time. Healthcare practitioners across physiotherapy, chiropractic, sports medicine, pain management practices, and aesthetic practices use body pain charts daily to translate what patients feel into what clinicians need to document. Many physical therapy practices choose dedicated practice management software to keep pain charts, scheduling, and billing in one system.
A body pain chart is a visual documentation tool featuring two body silhouettes: one showing the anterior (front) view and one showing the posterior (back) view. Patients or clinicians mark the exact location of pain, then check off the sensation that best describes it from a short list: ache, burning, cramping, numbness, pins and needles, stabbing, throbbing, or another sensation they can note by hand.
A separate severity scale, typically 0-10 and matching the numeric pain rating scale used across medical practices, captures how intense the pain is at the time of assessment.
When a patient cannot give that number, an observational tool like the CPOT scoring template records pain from behavior instead. It is built for sedated or ventilated patients in critical care.
The chart serves three clinical purposes:
Regulatory frameworks such as HIPAA require healthcare providers to keep documented evidence of patient pain assessment as part of the clinical record. A body pain chart fulfills this requirement by creating a dated, signed record of the patient’s reported pain at that visit. That record is critical evidence for treatment justification, insurance claims, and continuity of care.
Integrating a body pain chart into your intake workflow takes five clear steps. Each step builds on the last to create a complete pain assessment that informs your treatment plan.
Hand a blank chart to the patient (on paper or via digital patient intake forms) before the consultation begins. This gives them time to mark their pain location without feeling rushed. Include written instructions: “Place a checkmark where you feel pain, then check the box below that best describes how it feels.”
The patient marks all areas where they experience pain: a single location, multiple regions, or a distributed pattern such as both knees or the lower back. Clarity here prevents misdiagnosis. A patient reporting “knee pain” might actually have pain in the knee and hip; the diagram reveals this instantly.
The patient checks the box next to each sensation that matches what they feel: ache, burning, cramping, numbness, pins and needles, stabbing, throbbing, or another sensation noted by hand. This step reveals pain type, which helps determine whether pain is musculoskeletal, neuropathic, or inflammatory. Burning points to nerve involvement, while sharp stabbing points to joint or muscle strain.
Ask: “On a scale of 0 (no pain) to 10 (worst pain imaginable), what number is your pain right now?” Record this on the chart. This baseline becomes the benchmark for measuring whether your treatment (exercise, manual therapy, medication adjustment) is working. At the next visit, you’ll ask again and compare.
Date and sign the completed chart, then file it in the patient’s chart alongside your clinical notes. This creates a longitudinal record: returning patients can fill out the chart monthly or quarterly, and you’ll see whether pain location, sensation, or severity changes over time. Pain that’s improving validates your treatment; pain that’s worsening or migrating signals the need for reassessment or specialist referral.
Pro tip: For structured clinical intake workflows, digital forms eliminate the paper-to-file step and auto-populate the patient’s record, reducing data-entry errors and freeing up clinician time. Pairing the chart with a vital signs record at the same visit gives you a fuller intake snapshot without adding extra paperwork.
A body pain chart becomes most useful when you understand the pain types patients report. Four main pain categories appear consistently in clinical practice, each suggesting different underlying mechanisms:
Referred pain occurs when pain originates in one area but radiates to another, such as shoulder pain that travels down the arm from cervical spine irritation. On the chart, this pattern appears as a path from the origin to the referral zone, which is clinically important and often indicates nerve root involvement requiring specialist assessment.
Occupational therapists often score assessments like this directly inside occupational therapy software, keeping results attached to the treatment plan.
Body pain charts are used across a wide range of healthcare settings. Each specialty adapts the template slightly to their patient population and treatment focus:
Across all specialties. It shows that you listened to the patient, assessed their complaint systematically, and tailored treatment accordingly.

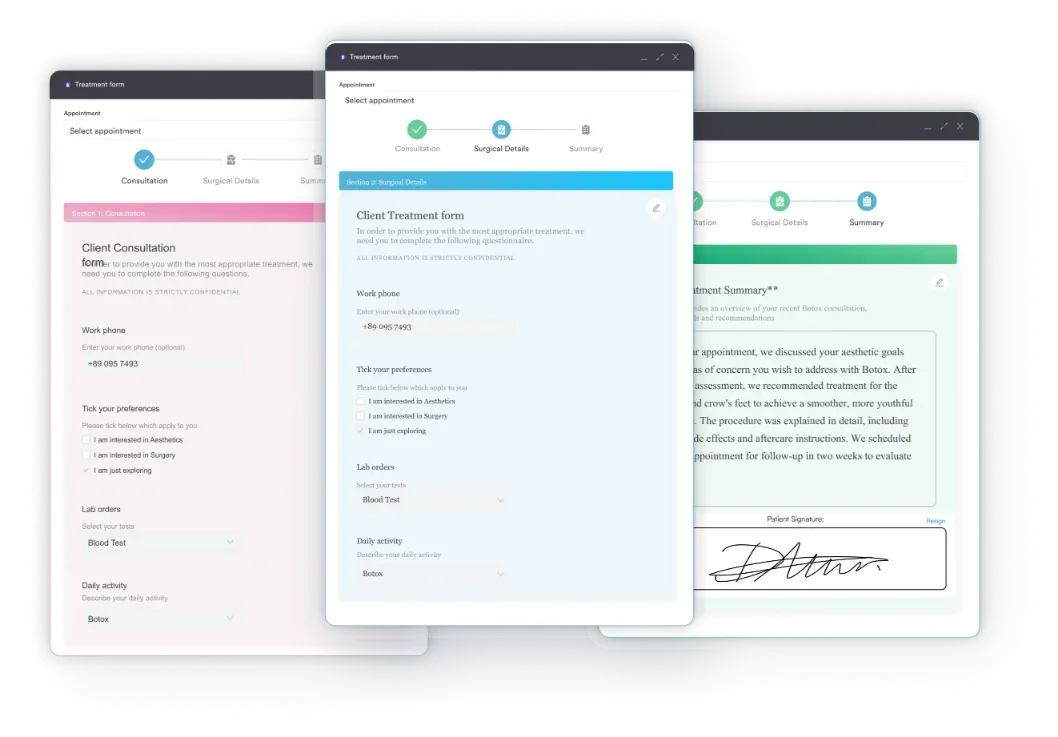
Pabau’s digital intake forms eliminate paper charts and manual data entry. Capture pain diagrams directly into the patient record, track pain trends across visits, and build a clinical evidence base automatically.

Any healthcare practice that conducts patient intake and needs to document pain is a candidate for body pain charts. This includes physiotherapy practices, chiropractic offices, sports medicine practices, massage therapy studios, pain management practices, occupational therapy services, mental health practices documenting somatic complaints, and aesthetic practices documenting baseline and post-treatment status.
The chart is especially valuable in multi-location practices, where consistency in pain documentation across clinicians reduces variability and ensures every patient receives standardized assessment regardless of which location or practitioner they see.
Improved diagnostic accuracy. A visual diagram is faster and more precise than a verbal description. The patient points; there’s no ambiguity about whether pain is in the shoulder or neck.
Compliance with clinical governance. Documented pain assessment satisfies regulatory and accreditation requirements. State licensing boards and accreditation programs expect evidence that practitioners assess and document patient concerns systematically. A signed, dated body pain chart on file proves you did.
Objective outcome measurement. Comparing charts from visit 1, visit 4, and visit 10 shows whether pain location, sensation, or severity is improving. This objective evidence justifies ongoing treatment and informs discharge planning.
Reduced administrative burden. A single standardized chart replaces multiple questions and takes under two minutes to complete. Time saved on intake is time available for clinical assessment and patient education.
Enhanced communication with patients. Patients see you recording their pain location and sensation; this validates their experience and builds trust. It also sets expectations: “At your next visit, we’ll fill this out again to see if the pain has shifted or improved.”
Paper body pain charts work, but digital integration multiplies their value. When pain documentation flows directly into a secure patient record system, you gain longitudinal tracking. Pabau automatically organizes charts chronologically, so reviewing a patient’s pain evolution across six months takes seconds instead of leafing through paper files.
Digital forms also enable patient portals, where patients fill out the chart at home before their appointment, saving chair time and allowing you to review baseline pain before they arrive.
The biggest operational win: no transcription. Paper charts end up in a file; you type notes later and may miss details. Digital charts auto-populate the patient record, reducing data-entry errors and ensuring clinicians across your practice see the same pain documentation, even at different locations. A related resource.
A body pain chart is a simple, powerful tool that transforms how practitioners listen to and document patient pain. Whether on paper or digital, the chart creates a shared language between clinician and patient, provides objective evidence of treatment progress, and fulfills regulatory documentation requirements.
Download the free template above, print it, and start using it at your next patient intake. You’ll notice immediate improvements in how clearly you understand where your patient’s pain is, what it feels like, and whether your treatment is working.

Evaluating heel pain at the bedside? Calcaneal Squeeze Test template documents heel pain evaluation through medial-lateral compression, with fields for differential diagnosis notes.
Writing a business plan for your practice? chiropractic business plan template covers the executive summary, market analysis, marketing plan, and financial statements a launch needs.
Setting up a full physical therapy intake? Pair the pain chart with a physical therapy intake form to capture medical history, goals, and consent in the same visit.
A standardized visual tool documenting where pain is located on a body silhouette, what it feels like, and its severity on a 0-10 scale. Clinicians use it at intake and follow-ups to track progress.
Give the patient a blank chart at intake to mark pain locations, check off the sensations that match what they feel, and rate severity 0-10. Review it during assessment, document it, and repeat at follow-ups.
A pain chart shows where pain is and what it feels like using a diagram and descriptors; a pain scale measures only intensity (e.g., 0-10). They are complementary, so use both for a complete assessment.
Standard charts suit patients who can read, write, or speak. For non-verbal or cognitively impaired patients, adapt with verbal cues, color-coded regions, or pictorial scales like a faces scale, involving a caregiver as needed.
Digital charts remove paper filing, cut data-entry errors, enable longitudinal tracking, let patients pre-fill at home, and keep searchable records available to every clinician across locations, freeing more time for clinical care.
Instead of a symbol legend, most charts use a plain-language checklist: ache, burning, cramping, numbness, pins and needles, stabbing, throbbing, and other. Patients check the box next to each sensation they feel, which keeps the chart simple to fill in without a key to decode.