Positive self-talk worksheet
A positive self-talk worksheet is a structured therapy tool for catching a negat...

1
Last Updated: Oct 13, 2026
A pediatric growth chart calculator plots a child’s weight, height, BMI, and head circumference against age- and sex-matched reference ranges. It returns a percentile, and that one number shapes the rest of the well-child visit.
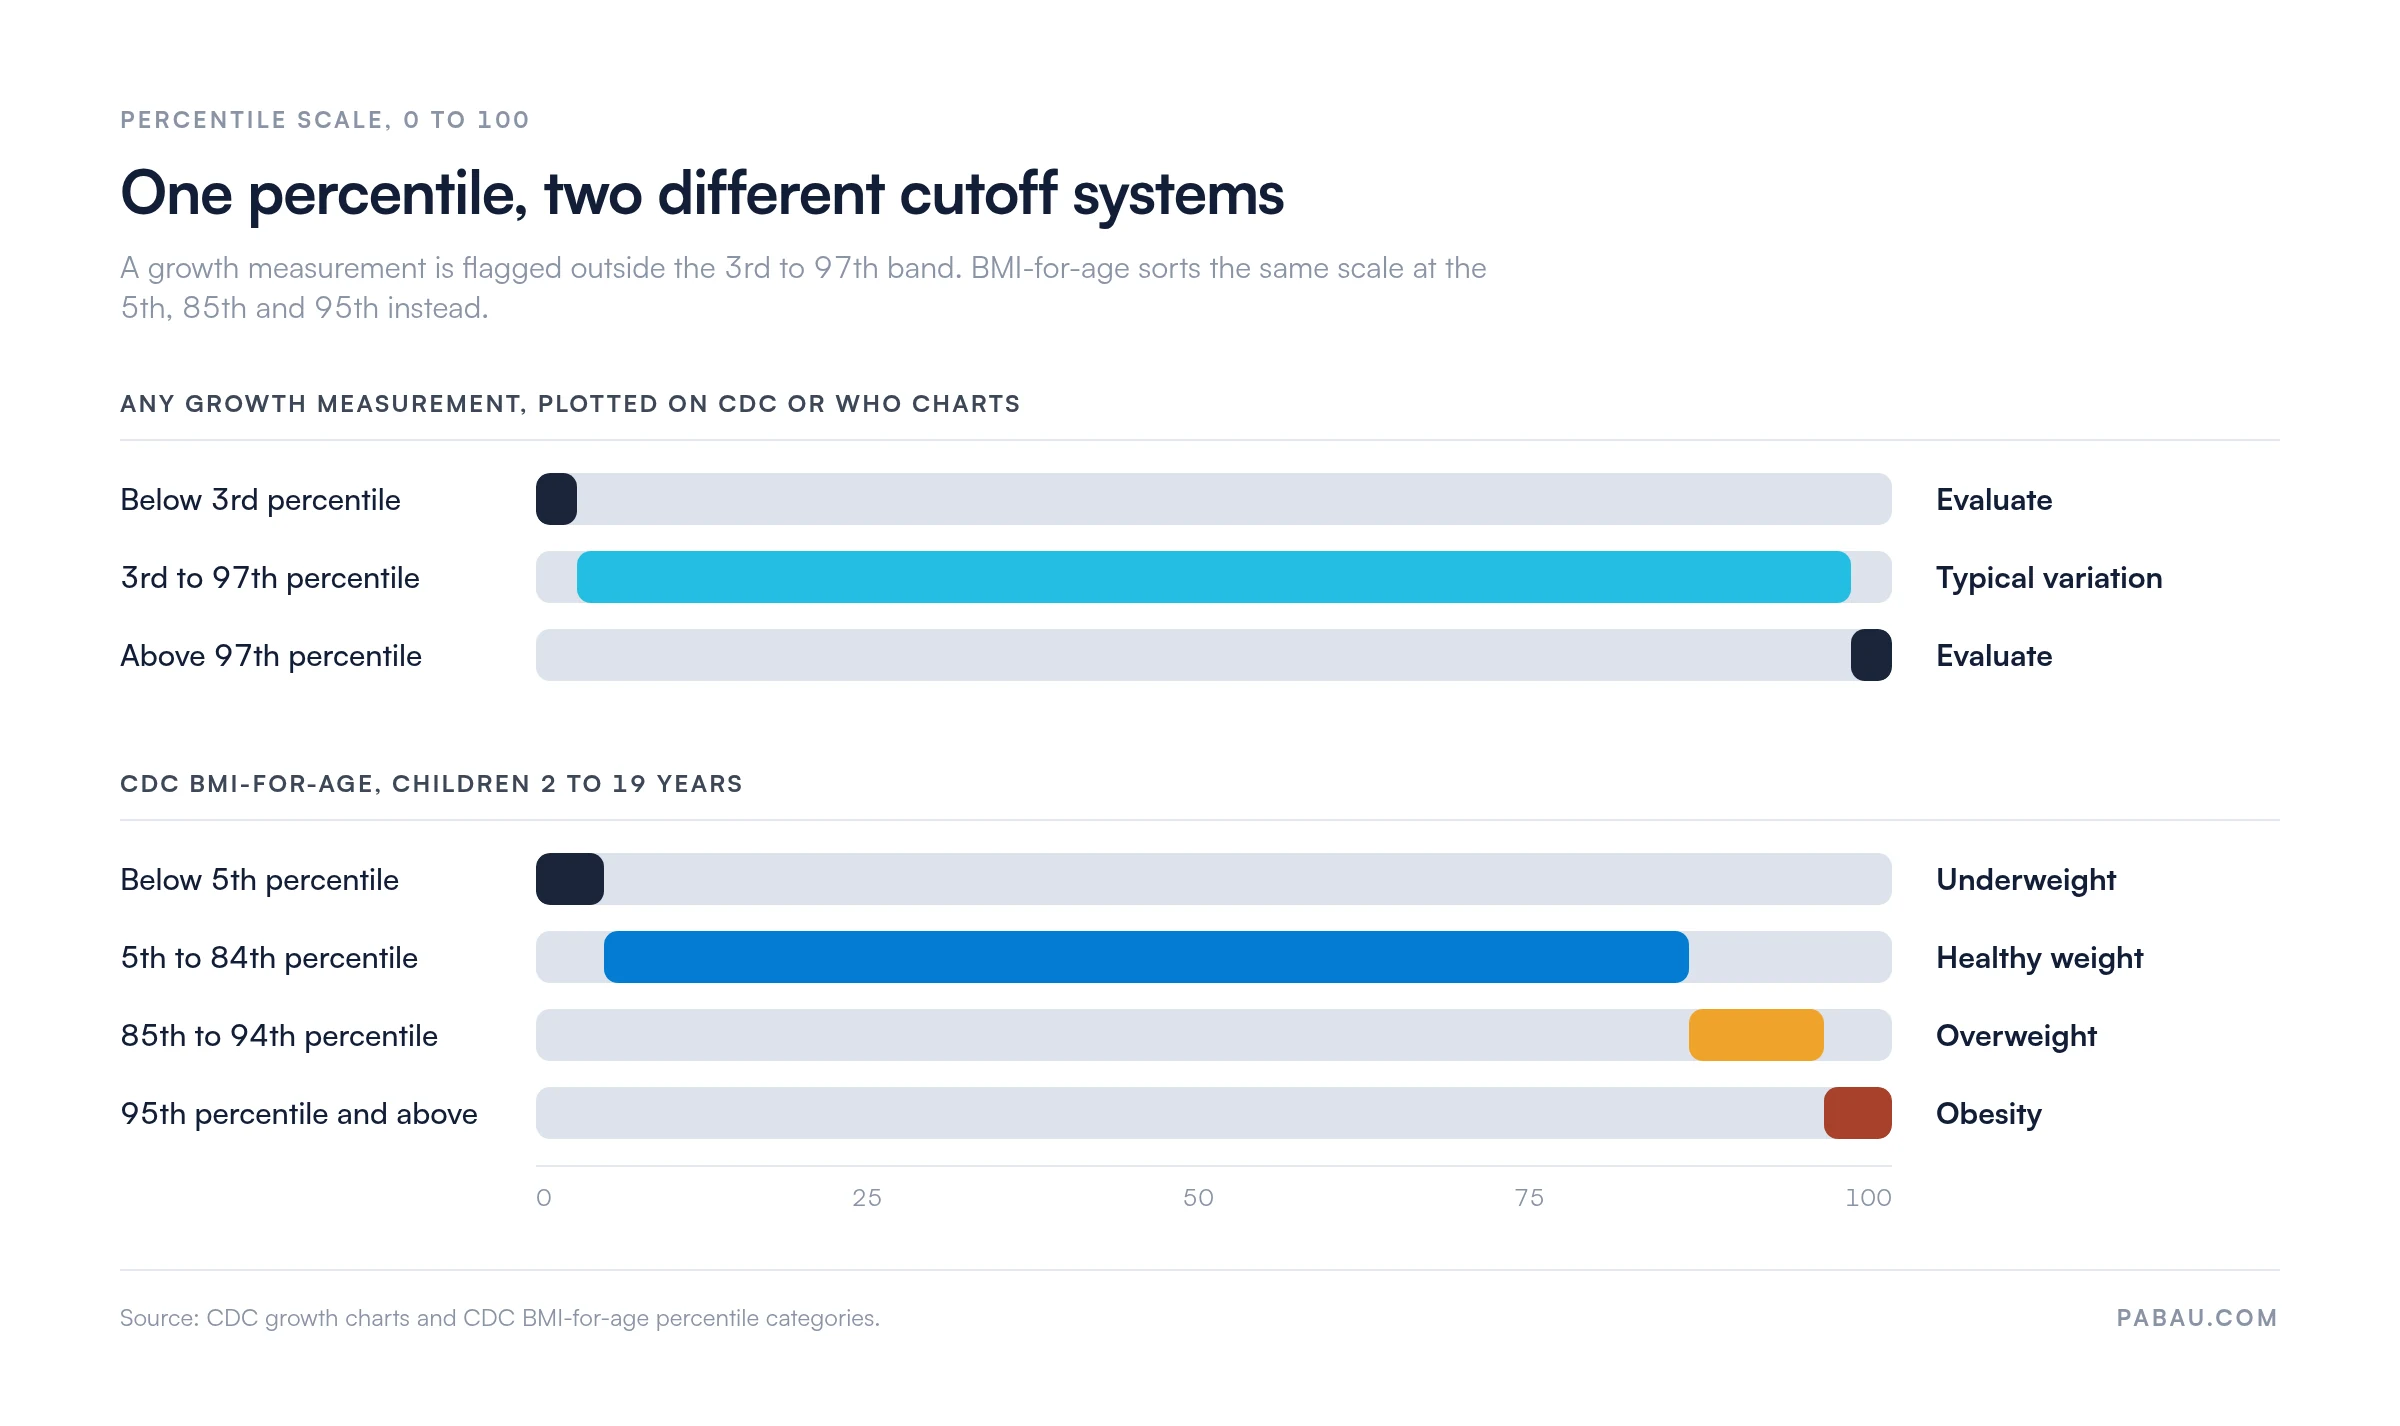
One fact does most of the work. A reading between the 3rd and 97th percentile counts as typical variation. The trend still beats the single reading. A child sliding from the 60th to the 20th percentile needs a second look.
Miss that slide and you miss the first sign of a nutritional or endocrine problem. Below you can download a blank recording form, pick between CDC and WHO standards, and read percentiles and z-scores without second-guessing.
A blank three-page clinical form you complete yourself. Page one is a reference values table with columns for age, measurement, range or notes, and source. Page two is a recording log, and page three is a notes page. It carries no pre-printed percentile curves or BMI fields, so add the CDC or WHO figures your practice uses.
Download template
A pediatric growth chart calculator plots weight, height, BMI, and head circumference percentiles against CDC (ages 2-20) or WHO (ages 0-5) standards.
The download is a blank three-page form, with a reference values table, a recording log, and a notes page.
A reading between the 3rd and 97th percentile is typical, and a reading outside it calls for evaluation rather than a diagnosis.
Growth velocity and z-scores show the pattern over time, so consistency matters more than one high or low reading.
Practice management software like Pabau stores each visit’s measurements on the child’s record, so the growth history stays in one place.
The download is a blank three-page clinical form. It gives your team one place to record growth measurements, but it does not plot the curves or do the math for you.
The form is deliberately generic. It carries no pre-printed percentile curves, no separate BMI or head circumference fields, and no CDC or WHO selector. Pair it with the official charts further down this page.
Treat it as a starting point rather than a finished chart. Most practices add the rows and column headings they use, then print the form or rebuild it as a digital version. The sheet covers growth only. If your team records temperature, pulse, and respiratory rate at the same visit, the pediatric vital signs chart handles that half of the paperwork.
A pediatric growth chart calculator is a structured clinical form used at well-child visits to record and interpret growth measurements. A complete version captures sex, age, weight, height, head circumference, and BMI. Use recumbent length instead of standing height for infants.
Each measurement is then ranked against age- and sex-matched reference populations, and expressed as a percentile or a z-score. That ranking is the output. The raw kilograms tell you very little on their own.
A form like this serves two purposes. It keeps your team collecting the same data at every visit, and it builds a documented record of the child’s growth trajectory. Digital intake forms in your practice management system let staff fill it in during the visit, then store it in the child’s permanent record.

Growth is a sensitive marker of a child’s overall health. Slower growth than expected can point to nutritional deficiency, infection, an endocrine disorder, or abuse. Rapid weight gain relative to height may signal metabolic risk or dietary imbalance. Plotting the numbers lets you catch these patterns early, often before a parent notices.
Consistency is what makes that list useful. Agree who takes each measurement, and agree the units, before the first patient of the day walks in.
Use WHO standards from birth through 23 months, then switch to CDC charts at age 2. That split follows AAP guidance and keeps the reference population age-appropriate.
Record which standard you used on the form. A percentile from a WHO chart and one from a CDC chart are not the same measurement. The switch at age 2 can move a child’s percentile on paper, with no change at all in the child.
A percentile says where a child sits within their age and sex group. At the 50th percentile for weight, a child is heavier than half their peers and lighter than the other half. At the 3rd, they are lighter than 97 percent of them.
How to read the bands:
BMI-for-age then uses its own cutoffs, and that is where the confusion usually starts.
Z-scores measure distance from the median in standard deviations. A z-score of 0 is the 50th percentile. Minus 2 sits near the 2.5th percentile, and plus 2 near the 97.5th. Research studies favor them because they compare cleanly across ages and standards.
When you explain the number to a family, drop the jargon. “She is taller than most kids her age” lands better than “85th percentile height-for-age.”
Each measurement on a growth chart answers a different question, and each applies to a different age range. Decide which ones your team collects at each visit, then write them into your version of the form.
Weight-for-age reflects nutritional status and caloric intake right now. It moves over weeks to months, which makes it sensitive to acute illness and feeding problems. Record in kilograms or pounds, and stick to one unit across the whole practice.
Height reflects long-term nutrition and genetic growth potential. It reacts slowly, so it reveals chronic malnutrition or systemic illness rather than last month’s stomach bug. Measure recumbent length for infants, and standing height from age 2.
BMI-for-age compares weight against height, and it is the primary screening measure for overweight and obesity in children 2 to 19 years. The CDC cutoffs run underweight below the 5th percentile and healthy weight from the 5th to the 84th. Overweight covers the 85th to the 94th, and obesity starts at the 95th. Add those four bands to your form so nobody looks them up mid-visit.
Head circumference tracks intracranial volume and is measured routinely from birth to 36 months. Head growth that is abnormally slow or fast can point to hydrocephalus, microcephaly, or developmental delay. Measure at the widest point above the eyebrows and ears, and record in centimeters.
The whole sequence takes a couple of minutes at the visit, and it leaves a documented baseline behind.
Two errors trip teams up here. Scales get moved and never re-zeroed, and a toddler measured standing one visit and lying down the next appears to shrink.
An AI medical scribe can draft the interpretation note while you are still in the room. Step seven then stops piling up until the end of the day.

A free online calculator does the percentile lookup for you, which removes the step where most errors creep in. PediTools is the one most US practices reach for. It covers children 2 to 20 years and returns weight-for-age, height-for-age, and BMI-for-age with a graph.
The trade-off is narrow scope. It does not track head circumference, and the result never reaches your notes. So pair it with medical records software that stores the result against the child’s file and keeps the history for years.

CDC growth charts, children 2 to 20 years:
WHO growth standards, children 0 to 5 years:
Print these and keep a laminated set in each exam room. Plotting on paper during the visit still beats opening a PDF on a shared computer while a toddler waits.
Standard CDC and WHO charts describe healthy, well-nourished children. A child with a genetic syndrome, a chronic condition, or a very early birth may grow along a different curve. On a standard chart, normal growth for that child can read as failure to thrive.
Condition-specific charts exist for Down syndrome, Turner syndrome, achondroplasia, and premature infants. Check your institutional guidelines before you switch. Then note the chart you used in the source column, because the next clinician reading the form will need to know.
Any clinician who runs well-child visits. That covers pediatricians, family physicians, nurse practitioners, and physician assistants with pediatric scope, plus anyone handling routine check-ups or chronic disease follow-up in children.
It also suits pediatric nursing practices and midwives managing newborn follow-up. Allied health practices that monitor child development, such as speech and occupational therapy, can use the same recording log.
Multi-provider groups gain the most, because every clinician then records the same numbers the same way. Most software for primary care lets you build these fields into the visit template, which saves chasing colleagues for missing measurements.
Here is what shifts once every provider fills in the same sheet.
Growth tracking depends on recording the same fields every time, and on finding the last four visits quickly. Practice management software like Pabau uses digital intake forms, so your team completes the growth record during the visit rather than after it.
Each entry saves into the child’s permanent clinical record. When a family comes back a year later, the earlier measurements are already there, with no chart hunting and no re-typing.
Staff fill the form in on a tablet or a computer in the exam room. Storage is HIPAA-compliant, so growth records stay confidential. Reporting tools surface trends across your whole pediatric list, which helps you spot nutrition or development concerns at group level.

Pabau’s digital forms and clinical records store each visit’s measurements on the child’s permanent record. Your team pulls up the full growth history in seconds, instead of hunting through paper charts.

Growth assessment only works as an early warning system when the numbers are captured the same way every time. A sheet that half the team fills in differently produces a trend line you cannot trust.
So do the unglamorous part first. Set your reference ranges, agree who measures what, and record which standard you used. The download above is the starting point, and the CDC and WHO charts handle the plotting.
Curious how growth records behave in a live schedule? Book a demo and we will walk through how Pabau stores each visit’s measurements on the child’s record.

Recording vitals at the same visit? Pediatric vital signs chart sets out the normal ranges by age band, so one reference fills the rest of the sheet.
Need the blood pressure percentiles too? Pediatric blood pressure chart explains how a child’s height percentile feeds into the blood pressure reading.
Building out the whole well-child exam? Pediatric assessment walks through the order of the exam and what to document at each step.
Seeing newborns in the first weeks? Newborn exam template covers the checks that come before growth charting begins.
Tracking shots alongside growth? Immunization record form keeps the vaccine history on the same visit record as the measurements.
At every well-child visit. In the first year, the AAP’s Bright Futures schedule puts those at roughly 1, 2, 4, 6, 9, and 12 months. Visits then fall at 15, 18, 24, and 30 months, and once a year from age 3. Weight, length, and head circumference are taken at every infant visit, and BMI joins from age 2.
Use corrected age rather than chronological age. Subtract the number of weeks the baby arrived early from their age in weeks, then plot that figure. Most practices keep correcting until around 24 months, after which the difference stops mattering. Note on the form that the age is corrected, or the next clinician will read the point as a drop.
Yes. A child at the 10th percentile with two short parents reads very differently from the same child with two tall parents. Mid-parental height gives you the expected target range, so familial short stature is easier to tell apart from a growth problem. It does not replace the trend, and a child falling away from their own curve still needs looking at.
Re-measure before you act on it. A single odd point is usually a technique or transcription error, not a growth problem. Check that the scale was zeroed and that the child was measured the same way as last time. Then check the date of birth on the record. If the repeat reading matches, treat it as a finding and act on it.