Head to toe assessment cheat sheet: Printable nursing guide
A head to toe assessment cheat sheet gives you one fixed order at the bedside, s...

3
Last Updated: Oct 23, 2026
A breastfed infant growth chart tracks weight-for-age, length-for-age, and head circumference percentiles from birth to 24 months using the WHO Child Growth Standards. The WHO curves were built from predominantly breastfed infants, so they treat the breastfed pattern as the norm. That pattern is fast weight gain in the first 3 months, then a slowdown from 3 to 12 months. The slowdown is expected and does not signal growth faltering.
Pediatricians, lactation consultants, and family physicians use the chart to tell healthy breastfed growth apart from inadequate gain. Reading it correctly avoids unneeded supplementation and failure-to-thrive referrals. This guide covers the three measurement tracks, the evidence behind the WHO standards, and the red flags that warrant referral. You can also download a free PDF template for your practice.
A printable WHO-standard chart for plotting weight-for-age, length-for-age, and head circumference from birth to 24 months. It includes the percentile curves, interpretation guidance, and space for clinical notes at each visit.
Download template
A breastfed infant growth chart uses the WHO Child Growth Standards (2006) to track weight, length, and head circumference from birth to 24 months.
Breastfed babies typically gain weight faster in months 0-3 and more slowly from 3-12 months than formula-fed infants. This slowdown is expected and does not indicate failure to thrive.
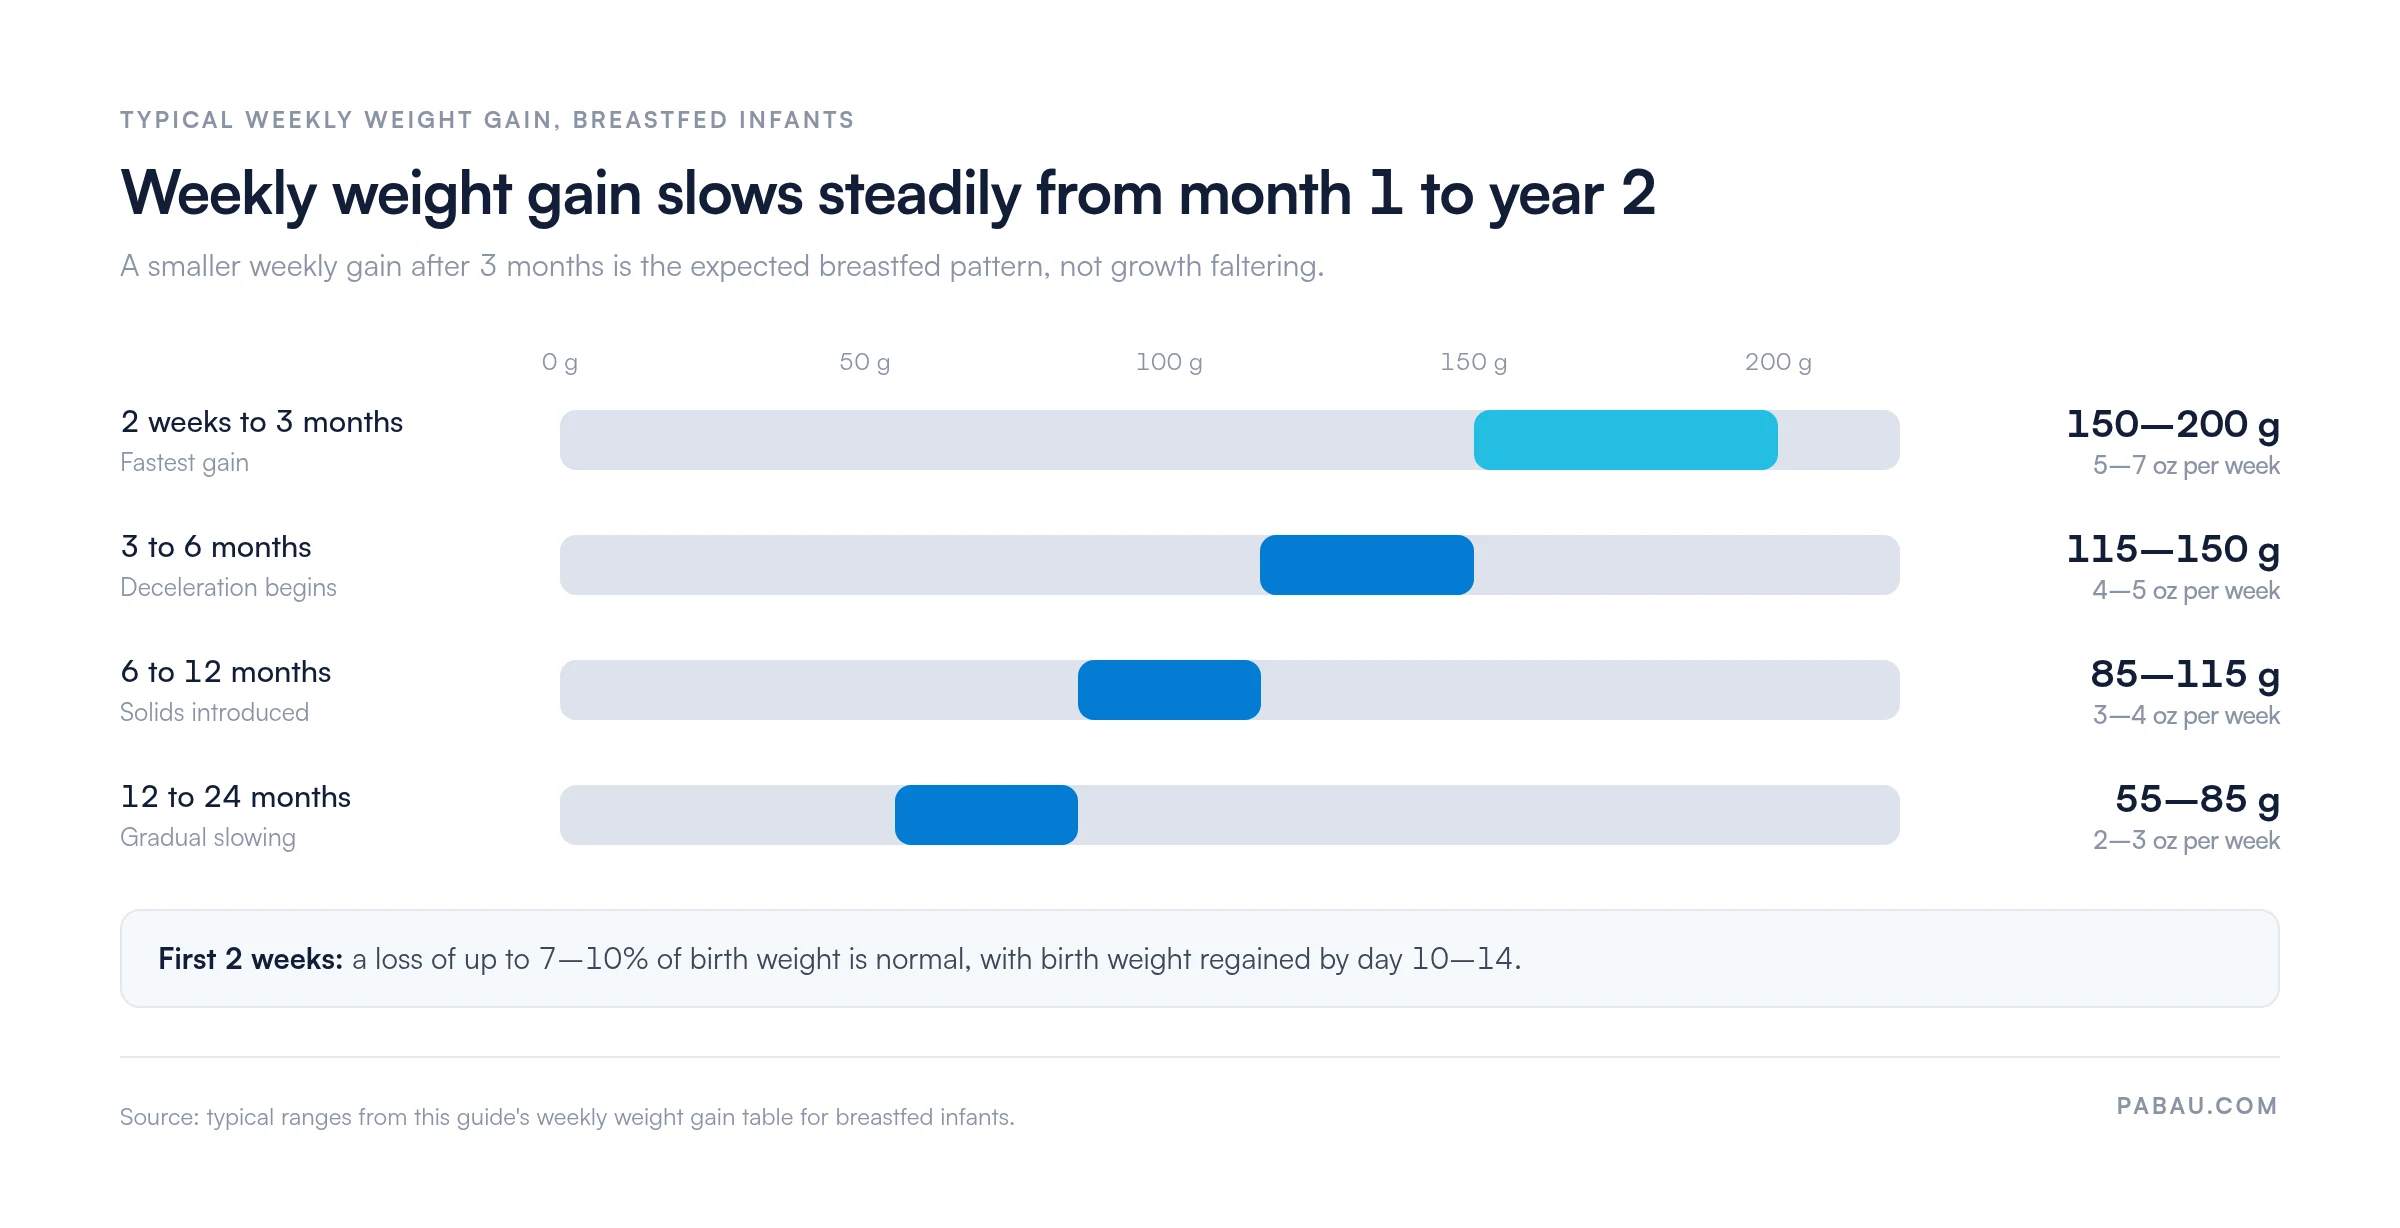
Expected weekly gain drops from about 150-200 g (5-7 oz) before 3 months to 55-85 g (2-3 oz) in the second year.
The chart plots each measurement against percentile curves from the 3rd to the 97th. Staying on the same curve matters more than the percentile number itself.
Red flags include crossing two major percentile lines, not regaining birth weight by day 10-14, or sustained weight loss. Each warrants a lactation assessment or pediatric referral.
A breastfed infant growth chart is a graphical tool clinicians use to plot infant measurements against population-based percentile curves. The chart displays three primary metrics:
In the United States, the CDC recommends WHO growth standards for infants and children under 2 years of age. The WHO standards were developed from longitudinal data on 8,440 healthy, exclusively breastfed infants.
They came from six countries: Brazil, Ghana, India, Norway, Oman, and the United States. Because that study population was predominantly breastfed, the curves follow the growth velocity of breastfed babies. Older reference charts blend in formula-fed growth, which follows a different curve.
Both WHO and CDC provide growth charts, but they serve different populations and purposes.
Breastfed babies gain weight faster at first, then slow their growth rate around 3-6 months as milk composition stabilizes and complementary foods begin. CDC charts average in faster formula-fed growth, so they can misclassify normal breastfed growth as failure to thrive. That misreading leads to unnecessary intervention. WHO standards show the deceleration as expected, which reduces overdiagnosis.
Expected weight gain milestones help clinicians and parents distinguish normal breastfed growth from inadequate gain.
The slowing of weight gain after 3 months is not abnormal for breastfed babies. Breastfed infants typically gain weight faster in the first 3 months and then more slowly from 3-12 months compared to formula-fed infants. The pattern shows up when WHO and CDC charts are compared side by side, and in the weekly ranges below.
Growth charts use percentile curves (3rd, 10th, 25th, 50th, 75th, 90th, 97th) to show where an infant’s measurement falls relative to a reference population. A percentile on its own does not indicate health or abnormality.
Not every weight measurement variation indicates a problem. Clinical red flags that warrant lactation assessment or pediatric referral include:
When growth faltering is identified, document the assessment thoroughly. Note the percentile crossed, the feeding history, and maternal and infant factors, and keep the record in line with HIPAA privacy rules.
An International Board Certified Lactation Consultant (IBCLC) should evaluate milk transfer, latch, and infant feeding capability before recommending supplementation. An infant milk intake chart kept alongside the growth chart shows whether daily feeds match the weight trend.

Track weekly weight measurements on the same scale at similar times of day for consistency. Plot measurements on the chart promptly, because charting delays can mask concerning trends. Share the percentile curve with parents during counseling to ease anxiety about minor fluctuations.
Pediatricians, family physicians, and nurse practitioners use the chart during routine well-baby visits. Those visits fall at birth, 3-5 days, 2 weeks, and 1, 2, 4, 6, 12, 18, and 24 months. Lactation consultants bring growth chart data into consultations with families, explaining patterns and addressing feeding concerns.
Families at those visits often ask which diaper size the newly plotted weight calls for. A chart of diaper size by weight answers that in seconds, from the number the clinician just recorded.
Midwives managing postpartum care also track early infant growth as a sign that breastfeeding is going well. Pediatric, women’s health, and integrative medicine practices benefit from one standardized, clinically accurate template across the team. Once a child turns 2, the CDC charts take over, and a pediatric growth chart calculator helps with that handover.
A ready-made WHO-standard chart means every clinician applies the same reference curves to every breastfed infant. That consistency pays off in three ways:
Many practices still plot growth on paper, then file the chart in a folder or scan it into a separate system. Spotting a baby who has crossed two percentile lines then means laying several visits’ worth of paper side by side.
Practice management software like Pabau stores each measurement in the patient’s Client record, next to feeding notes and referral letters. With digital medical records, you compare today’s weight with the last visit in seconds. Pabau also runs booking, charting, and billing, so family practices and private GPs can use one GP clinic software platform for the whole visit.

Automated reminders prompt parents before each well-baby check, so a baby due a weight review in two weeks stays on the schedule. The result is fewer missed follow-ups and a growth history your whole team can read at a glance.


Pabau keeps growth measurements, feeding notes, and referrals in one patient record and reminds parents about well-baby visits. Your team spots a crossed percentile line sooner and follows up on time.

If your practice still plots breastfed babies on blended reference curves, switching to the WHO chart is the change worth making first. It turns the slowdown after month 3 from a false alarm into an expected pattern you can show parents.
The trade-off is discipline. Plot every visit on the same chart and judge the trajectory across visits rather than one reading. Refer promptly when a baby crosses two major lines or misses the day 10-14 birth weight mark.
Book a demo to see how Pabau keeps growth measurements, feeding notes, and well-baby reminders in one patient record.

Preparing for the first newborn visit? Newborn exam template is a free downloadable checklist for the head-to-toe assessment.
Managing jaundice in the first days of life? Infant bilirubin chart lists phototherapy thresholds by age.
Need a broader pediatric workup? Pediatric assessment guide covers frameworks, tools, and age-based ranges.
Any percentile between 3rd and 97th is within normal range if the baby is tracking consistently along that curve. The absolute percentile matters less than maintaining a steady upward trend.
Newborns (weeks 1-2) typically lose 5-10% birth weight, then regain it by day 10-14. From 2 weeks to 3 months, expect 5-7 oz (150-200 g) per week. From 3-6 months, 4-5 oz (115-150 g) per week.
Yes. Breastfed infants naturally slow their growth rate after 3-6 months as milk composition stabilizes and complementary foods are introduced. This is normal and expected, not failure to thrive.
Referral triggers include failure to regain birth weight by day 14 and crossing two major percentile lines downward. Fewer than 6 wet diapers daily beyond day 5, or a sustained weight plateau in infants under 3 months, also warrant referral.
The WHO chart was developed using exclusively breastfed infants, so it reflects the natural breastfed growth pattern (fast early, slower after 3 months). The CDC chart includes formula-fed infants and shows a more linear curve.