OSHA respirator medical evaluation questionnaire
The OSHA respirator medical evaluation questionnaire is the mandatory health for...

3
Last Updated: Oct 15, 2026

The Epworth Sleepiness Scale is a validated 8-item questionnaire that scores daytime sleepiness from 0 to 24.
Patients rate each of the eight situations from 0 to 3, and the eight ratings add up to the total.
Totals fall into four bands: normal at 0-10, mild at 11-12, moderate at 13-15, and severe at 16-24.
A total of 13 or above points to moderate sleepiness, and 16 or above warrants prompt specialist referral.
Practice management software like Pabau scores the ESS automatically, files the result in the patient record, and flags high totals for follow-up.
A one-page clinical form carrying all eight situations, the 0-3 rating instructions, and a total-score line. The interpretation bands run from 0-5 through 16-24, so the person scoring it never needs a second reference.
Download templateThe Epworth Sleepiness Scale (ESS) is the most widely used clinical measure of daytime sleepiness. Practices use it to screen for sleep disorders, track treatment response, and decide who needs a sleep medicine referral.
The Epworth Sleepiness Scale is a standardized 8-item questionnaire that measures how likely a patient is to fall asleep in ordinary situations. Dr Murray Johns developed it at Epworth Hospital in Melbourne and first published it in 1991. It has since been validated in clinical, community, and occupational health settings worldwide.
Polysomnography can diagnose a specific sleep disorder, but it says little about how tired a patient feels across an ordinary week. The ESS asks patients to rate their own chance of dozing in eight everyday situations instead.
Those situations are sitting and reading, watching television, sitting inactive in a public place, and riding as a passenger in a car. The remaining four are lying down in the afternoon, sitting and talking, sitting quietly after lunch, and waiting in stopped traffic.
Sleep medicine bodies including the American Academy of Sleep Medicine reference the ESS in their guidance. It supports screening for obstructive sleep apnea, evaluation of narcolepsy, and follow-up of treatment response.
The form opens with one question: how likely are you to doze off or fall asleep in the following situations? Patients rate each situation on a 0-3 scale.
The eight situations are:
Add the eight ratings together for a total between 0 and 24. Scoring takes under five minutes, including the time the patient spends filling the form in.
Step-by-step scoring:
For example, ratings of 1, 2, 2, 3, 1, 0, 2 and 1 add up to 12. That total sits in the mild band. One extra point on any single item would move the same patient into the moderate band.
Four bands cover the 0 to 24 range. The bands below are the ones Johns published, and the ones printed on the downloadable form.
The four bands are not the same size, and that is easy to miss in a table. Drawn to scale, the two middle bands take up a fifth of the range between them.
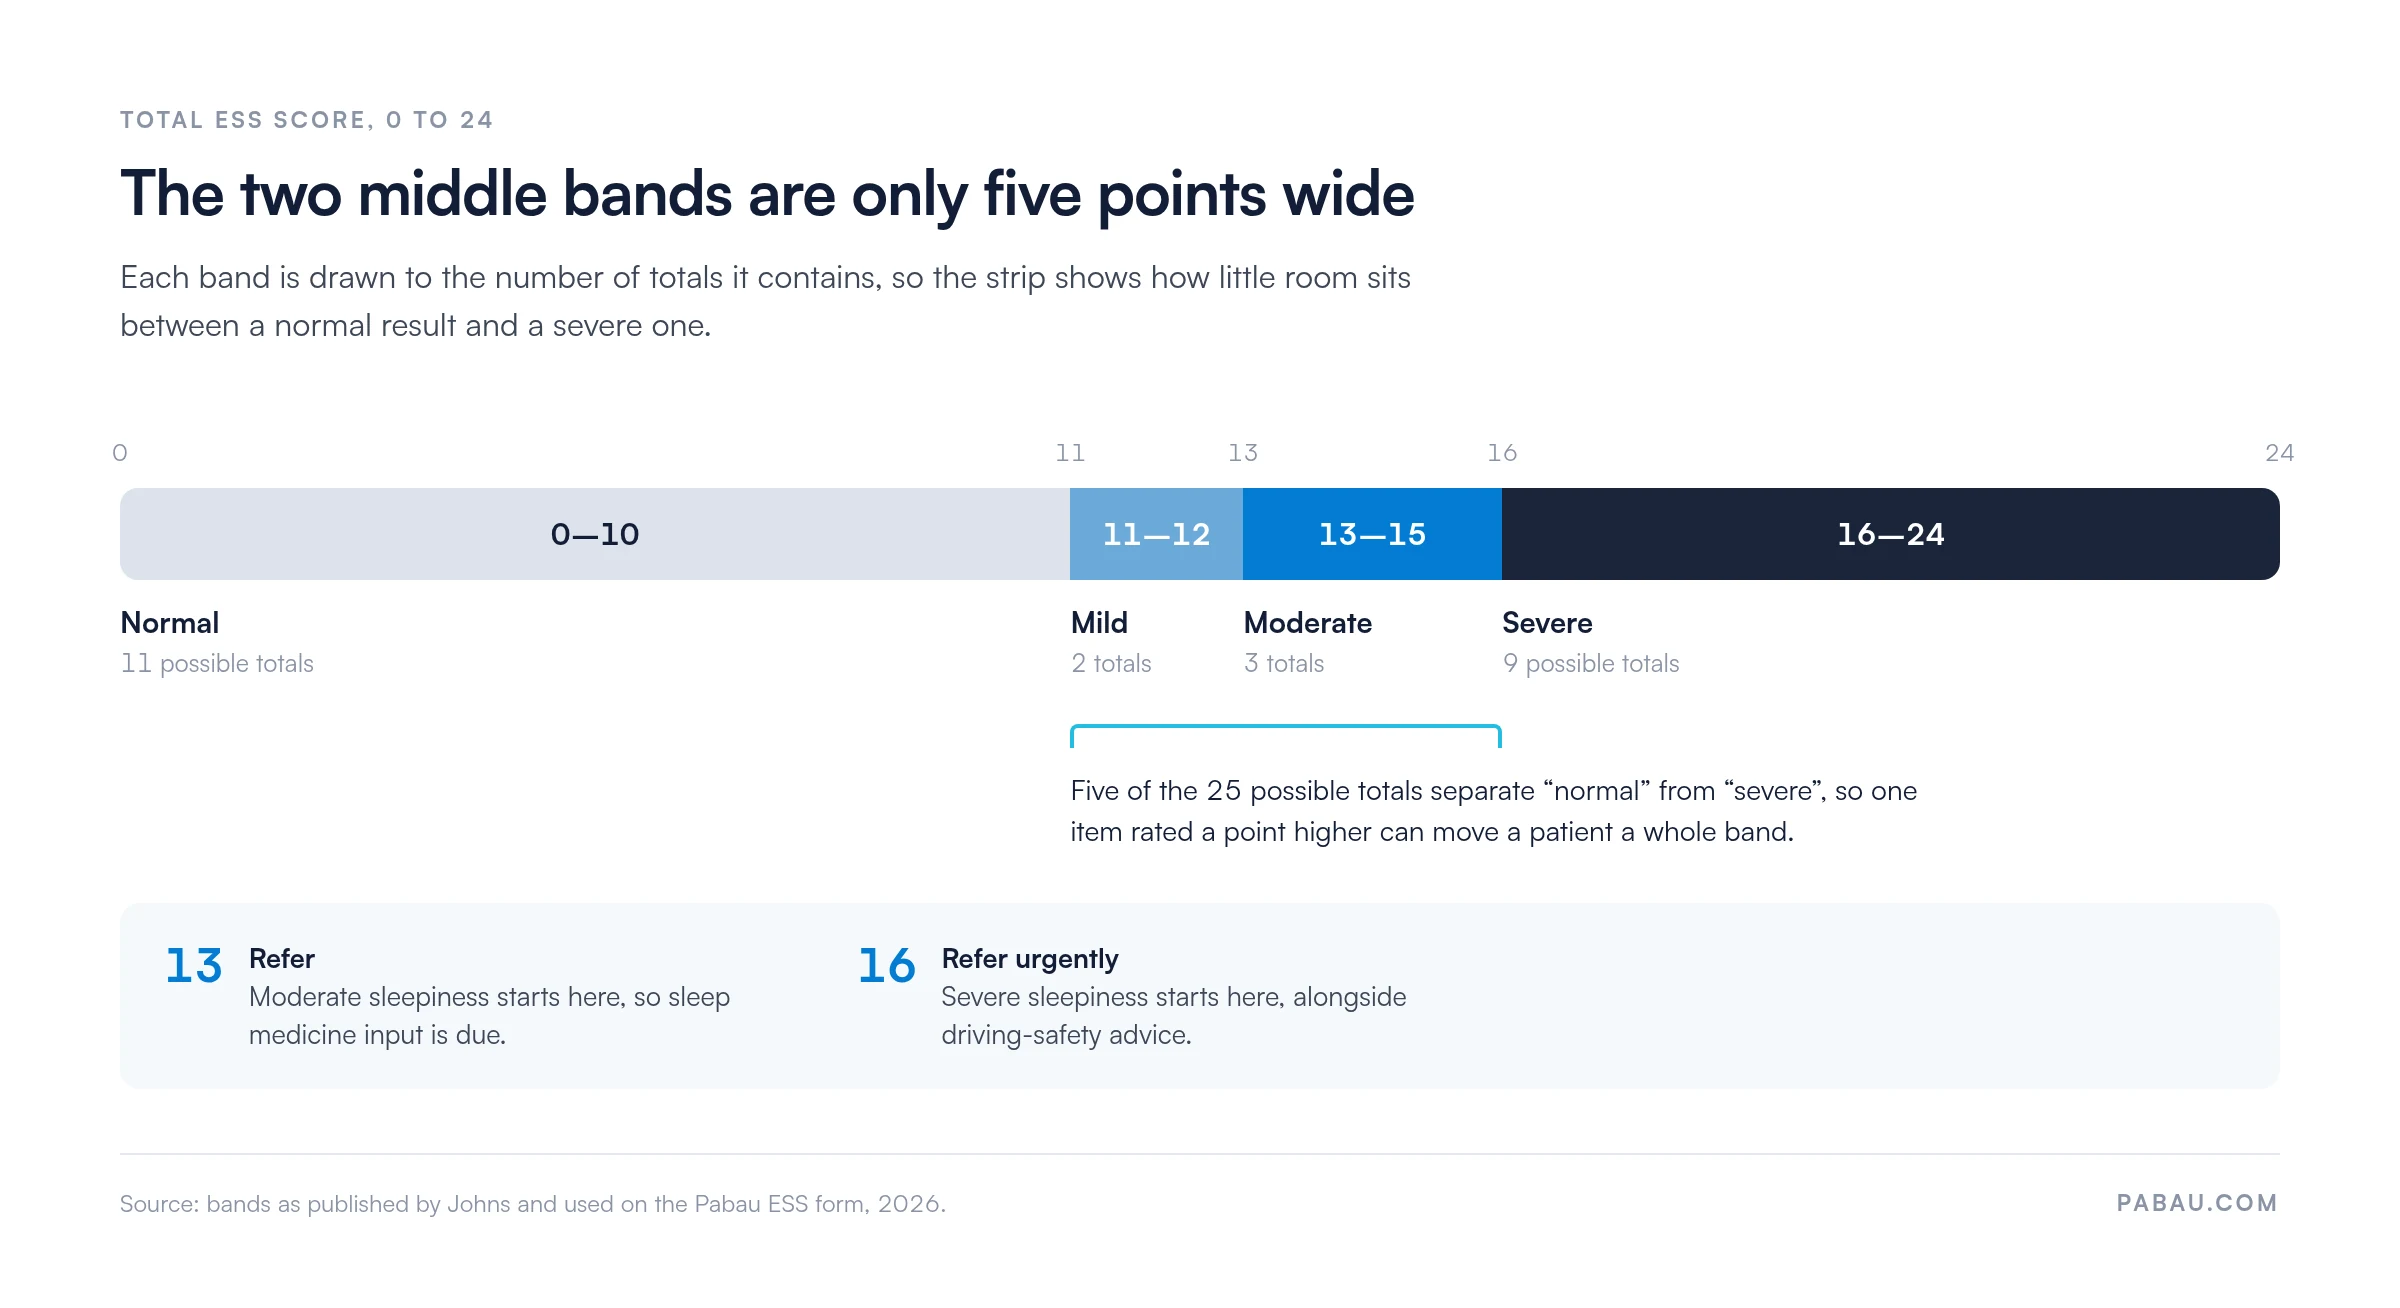
The downloadable form splits the normal band further, into lower normal at 0-5 and higher normal at 6-10. That split is useful when you are tracking one patient across several visits, because movement inside the normal range still tells you something.
A high total signals excessive daytime sleepiness rather than a diagnosis. The ESS points toward further evaluation, such as polysomnography or a home sleep apnea test.
Download the PDF above, then follow these steps:
Sleep complaints rarely arrive on their own. Practices that run mental health caseloads on therapy practice management software pair the ESS with mood and anxiety screens, since disturbed sleep feeds both. A structured psychiatric evaluation template gives those sleep answers somewhere to sit alongside the rest of the history.
Across settings, the scale does five jobs:
Johns’ 1992 validation study reported a Cronbach’s alpha of 0.88. Later meta-analyses place the range at 0.73 to 0.90, with a mean of 0.82. The same 1992 study retested subjects after five months and found a test-retest correlation of 0.82. The scale has since been translated and validated in more than 50 languages.
The limitations are worth stating plainly. The ESS is self-reported, so it depends on patient insight and recall. It does not separate causes either, because sleep apnea, insomnia, and depression all produce high totals. Sensitivity also drops in very elderly and severely sleep-deprived patients, so read the number against the clinical picture.
The scale also leaves out sleep quality, and the time a patient spends lying awake. Pair it with the Pittsburgh Sleep Quality Index when quality is the question. Reach for the Insomnia Severity Index when sleep onset and maintenance are what you need to measure.
Most practices hand the ESS out on paper, score it by hand, and copy the total into the record afterwards. Practice management software like Pabau moves that whole sequence into the patient’s file. You can build the eight items into digital patient intake forms, so patients complete them on a tablet or online before the appointment.
Pabau then scores the responses, files the total in the record, and triggers the follow-up you configured. A total of 16 or above can raise an internal task to book a sleep medicine consultation. Addition errors disappear, and a concerning result no longer depends on someone remembering it.
Standardizing the workflow also standardizes the data. Every clinician administers the ESS the same way and records it in the same field. That consistency is what makes audit and outcome tracking possible later.

Pabau’s digital intake forms carry the ESS, total the ratings, and file the result in the patient record. High totals raise a follow-up task, so a referral never waits on a paper form.

The ESS earns its place because five minutes of patient time changes what happens next. A total of 13 moves a patient from advice to referral, and 16 moves them to the front of the queue.
The narrow middle bands are the part worth remembering. Score the form carefully, because one rushed rating can shift the band and the decision that follows from it.
Download the form, decide who hands it out and when, and agree where the total gets recorded. Book a demo to see how Pabau scores the ESS on intake and flags the totals that need a referral.

Building a psychiatric intake from scratch? Psychiatric evaluation template gives you the history framework that sleep questions belong in.
Want a worked scoring example? How to score the Vanderbilt ADHD Rating Scale walks through a scored instrument step by step.
Need a broader sleep history? Sleep questionnaire covers the habits, routine, and symptoms the ESS never asks about.
Sleepiness, or fatigue? Fatigue Severity Scale template separates tiredness from the urge to doze.
Ready to treat the insomnia behind the score? CBT for sleep worksheet gives patients structured homework between appointments.
The Epworth Sleepiness Scale is a standardized 8-item questionnaire that measures how sleepy a patient feels in everyday situations. Each item scores 0 to 3, giving a total between 0 and 24. Higher totals mean more daytime sleepiness.
Totals of 0 to 10 are normal. A total of 11 or 12 is mild excessive daytime sleepiness, 13 to 15 is moderate, and 16 to 24 is severe. Any total above 10 deserves clinical attention.
Refer when the total reaches 13, which is where moderate sleepiness begins, and treat 16 or above as urgent. A total of 11 or 12 also warrants referral if the patient snores, gasps in their sleep, or reports sleep paralysis.
The ESS measures how sleepy a patient is across eight situations, on a 0 to 24 scale. STOP-BANG instead screens for the risk factors behind obstructive sleep apnea, including snoring, observed breathing stops, blood pressure, BMI, age, neck size, and sex. The two answer different questions and are often used together.
The original ESS was developed and validated in adults, so do not use it below 16 years of age. Use the Epworth Sleepiness Scale for Children and Adolescents (ESS-CHAD) instead, and follow its own scoring and interpretation guidance.