High protein grocery list: Free PDF with protein per serving
A high protein grocery list is a shopping guide that groups protein-rich foods b...

2
Last Updated: Oct 8, 2026
An infant bilirubin chart plots a newborn’s total serum bilirubin (TSB) against age in hours and gestational age at birth. Where the reading falls tells you whether the baby needs phototherapy, exchange transfusion, or only a repeat test. Neonatal jaundice affects roughly 60% of term and 80% of preterm infants, so that judgment gets made on rounds almost every day.
The thresholds on this page come from the American Academy of Pediatrics 2022 guideline. It replaced the 2004 curves and raised most treatment levels by 1 to 2 mg/dL.
A 39-week infant with no neurotoxicity risk factors meets the phototherapy threshold at 12.8 mg/dL at 24 hours of life. By 96 hours that line has moved up to 21.5 mg/dL. The full tables for every completed week from 35 to 40 are below.
A printable chart carrying the AAP 2022 phototherapy and exchange transfusion thresholds by gestational age and hour of life. It also lists the neurotoxicity risk factors and leaves space to record each TSB value, the time drawn, and the decision that followed.
Download template
An infant bilirubin chart plots total serum bilirubin against postnatal age in hours and gestational age. One lab value then answers one question. Does this baby need phototherapy today?
The AAP 2022 guideline sets a separate threshold curve for every completed week from 35 to 40. A second, lower set of curves applies to infants with any neurotoxicity risk factor.
Thresholds move fast in the first days of life. A 39-week infant crosses into phototherapy at 12.8 mg/dL at 24 hours, but not until 21.5 mg/dL at 96 hours.
Exchange transfusion sits well above phototherapy. For a 39-week infant with no risk factors it begins at 21.4 mg/dL at 24 hours and plateaus at 27.0 mg/dL.
Pabau’s digital template links the chart to your clinical documentation workflows, so every TSB result and phototherapy decision lands in one audit-ready record.
The infant bilirubin chart is a reference table that tells you whether a newborn’s bilirubin level is safe, close to treatment, or already past it. It stratifies risk by two variables, the baby’s age in hours and gestational age at birth. Those two inputs fix where the threshold line sits.
Speed is the point. A structured pediatric assessment keeps findings consistent across staff, but a jaundice call also has to be made fast. Reading a TSB against the chart takes under a minute.
That minute heads off readmission, neurological injury, and parental distress. Without the chart, staff are recalling dozens of numbers from memory. That is how thresholds drift between shifts and between sites.
The Bhutani nomogram, named after neonatologist Vinod Bhutani, is the screening tool behind modern bilirubin practice. It came out of a large prospective cohort of healthy term and near-term newborns. Their TSB values were plotted against postnatal age to produce percentile curves. Four risk zones are read off those curves.
These zones predict which babies are likely to develop significant hyperbilirubinemia, so they drive screening intensity and discharge follow-up. They are not the treatment thresholds.
The decision to start phototherapy comes from the AAP 2022 curves in the next section. Those curves are stratified by completed week of gestation, because bilirubin clearance is slower in less mature infants.
The table below gives AAP 2022 phototherapy thresholds in mg/dL for infants with no hyperbilirubinemia neurotoxicity risk factors. Start intensive phototherapy when the measured TSB is at or above the value shown. Infants born before 35 weeks are outside the scope of this guideline and need preterm-specific thresholds instead.
Prematurity is handled by the separate column for each completed week, so it is not counted again as a risk factor. Six other factors do count.
If any one of them is present, use the lower set of thresholds below.
Thresholds are taken from the AAP 2022 clinical practice guideline (Kemper AR et al., Pediatrics 2022;150(3):e2022058859) as tabulated by the PediTools bili2022 calculator. Values between the rows are interpolated. A calculator is therefore more precise than a printed grid for an infant at, say, 61 hours of life.
The AAP’s 2022 revision sets phototherapy thresholds from three inputs. Those are gestational age at birth, postnatal age in hours, and neurotoxicity risk status. A 40-week infant with none of those factors reaches the threshold at 17.0 mg/dL at 48 hours. The same infant with sepsis or isoimmune hemolytic disease reaches it at 14.0 mg/dL.
Stopping is also defined. Phototherapy can be discontinued once TSB has fallen at least 2 mg/dL below the threshold for that infant’s age and risk category. A follow-up TSB 24 to 48 hours later screens for rebound hyperbilirubinemia, where the level climbs again after the lights come off.
Reading the chart takes five steps.
A transcutaneous reading is confirmed with a serum sample before it drives treatment. If TSB meets or exceeds the threshold, phototherapy is indicated. If it sits below, treatment is not indicated yet, and the result sets the follow-up interval instead.
Take a 48-hour-old infant born at 39 weeks, with no neurotoxicity risk factors and a TSB of 20.0 mg/dL. The phototherapy threshold for that column and row is 16.6 mg/dL. The reading is 3.4 mg/dL above it, so intensive phototherapy starts now.
The exchange transfusion threshold for the same infant is 24.0 mg/dL, which this reading does not reach. It is close enough to matter, so the next TSB is due within hours.
Change one detail and the answer changes with it. If that infant had a positive direct antiglobulin test, the applicable threshold would drop to 14.0 mg/dL. Born at 36 weeks instead, with no risk factors, the threshold would be 14.8 mg/dL.
The same 20.0 mg/dL reading points to a different action in each case. That is why the gestational week and the risk status get recorded alongside the number.
Exchange transfusion replaces the baby’s blood with donor blood to bring TSB down fast. It is reserved for severe hyperbilirubinemia that phototherapy has not controlled, or for a baby who arrives already above the threshold. The AAP 2022 exchange curves run roughly 5 to 9 mg/dL above the matching phototherapy curves, and they flatten out earlier.
The table below gives exchange transfusion thresholds in mg/dL for infants with no neurotoxicity risk factors.
Where any neurotoxicity risk factor is present, the thresholds drop by around 3 to 4 mg/dL. The curves for 38 weeks and above then converge.
Two points stand out in these numbers. The low-risk term ceiling is 27.0 mg/dL, not the 30 mg/dL figure that circulates in older summaries. The curves also plateau by about 96 hours, so the threshold at 120 hours barely moves from the day before.
AAP 2022 also defines an escalation-of-care band below the exchange line. It opens when TSB reaches within 2 mg/dL of the exchange threshold. It also opens when the level fails to fall on intensive phototherapy.
That infant needs urgent admission, IV hydration, and preparation for exchange. For a 39-week infant with no risk factors at 48 hours, that band starts at 22.0 mg/dL. Stacking all four bands on one scale shows how the safe span narrows as the baby gets older.
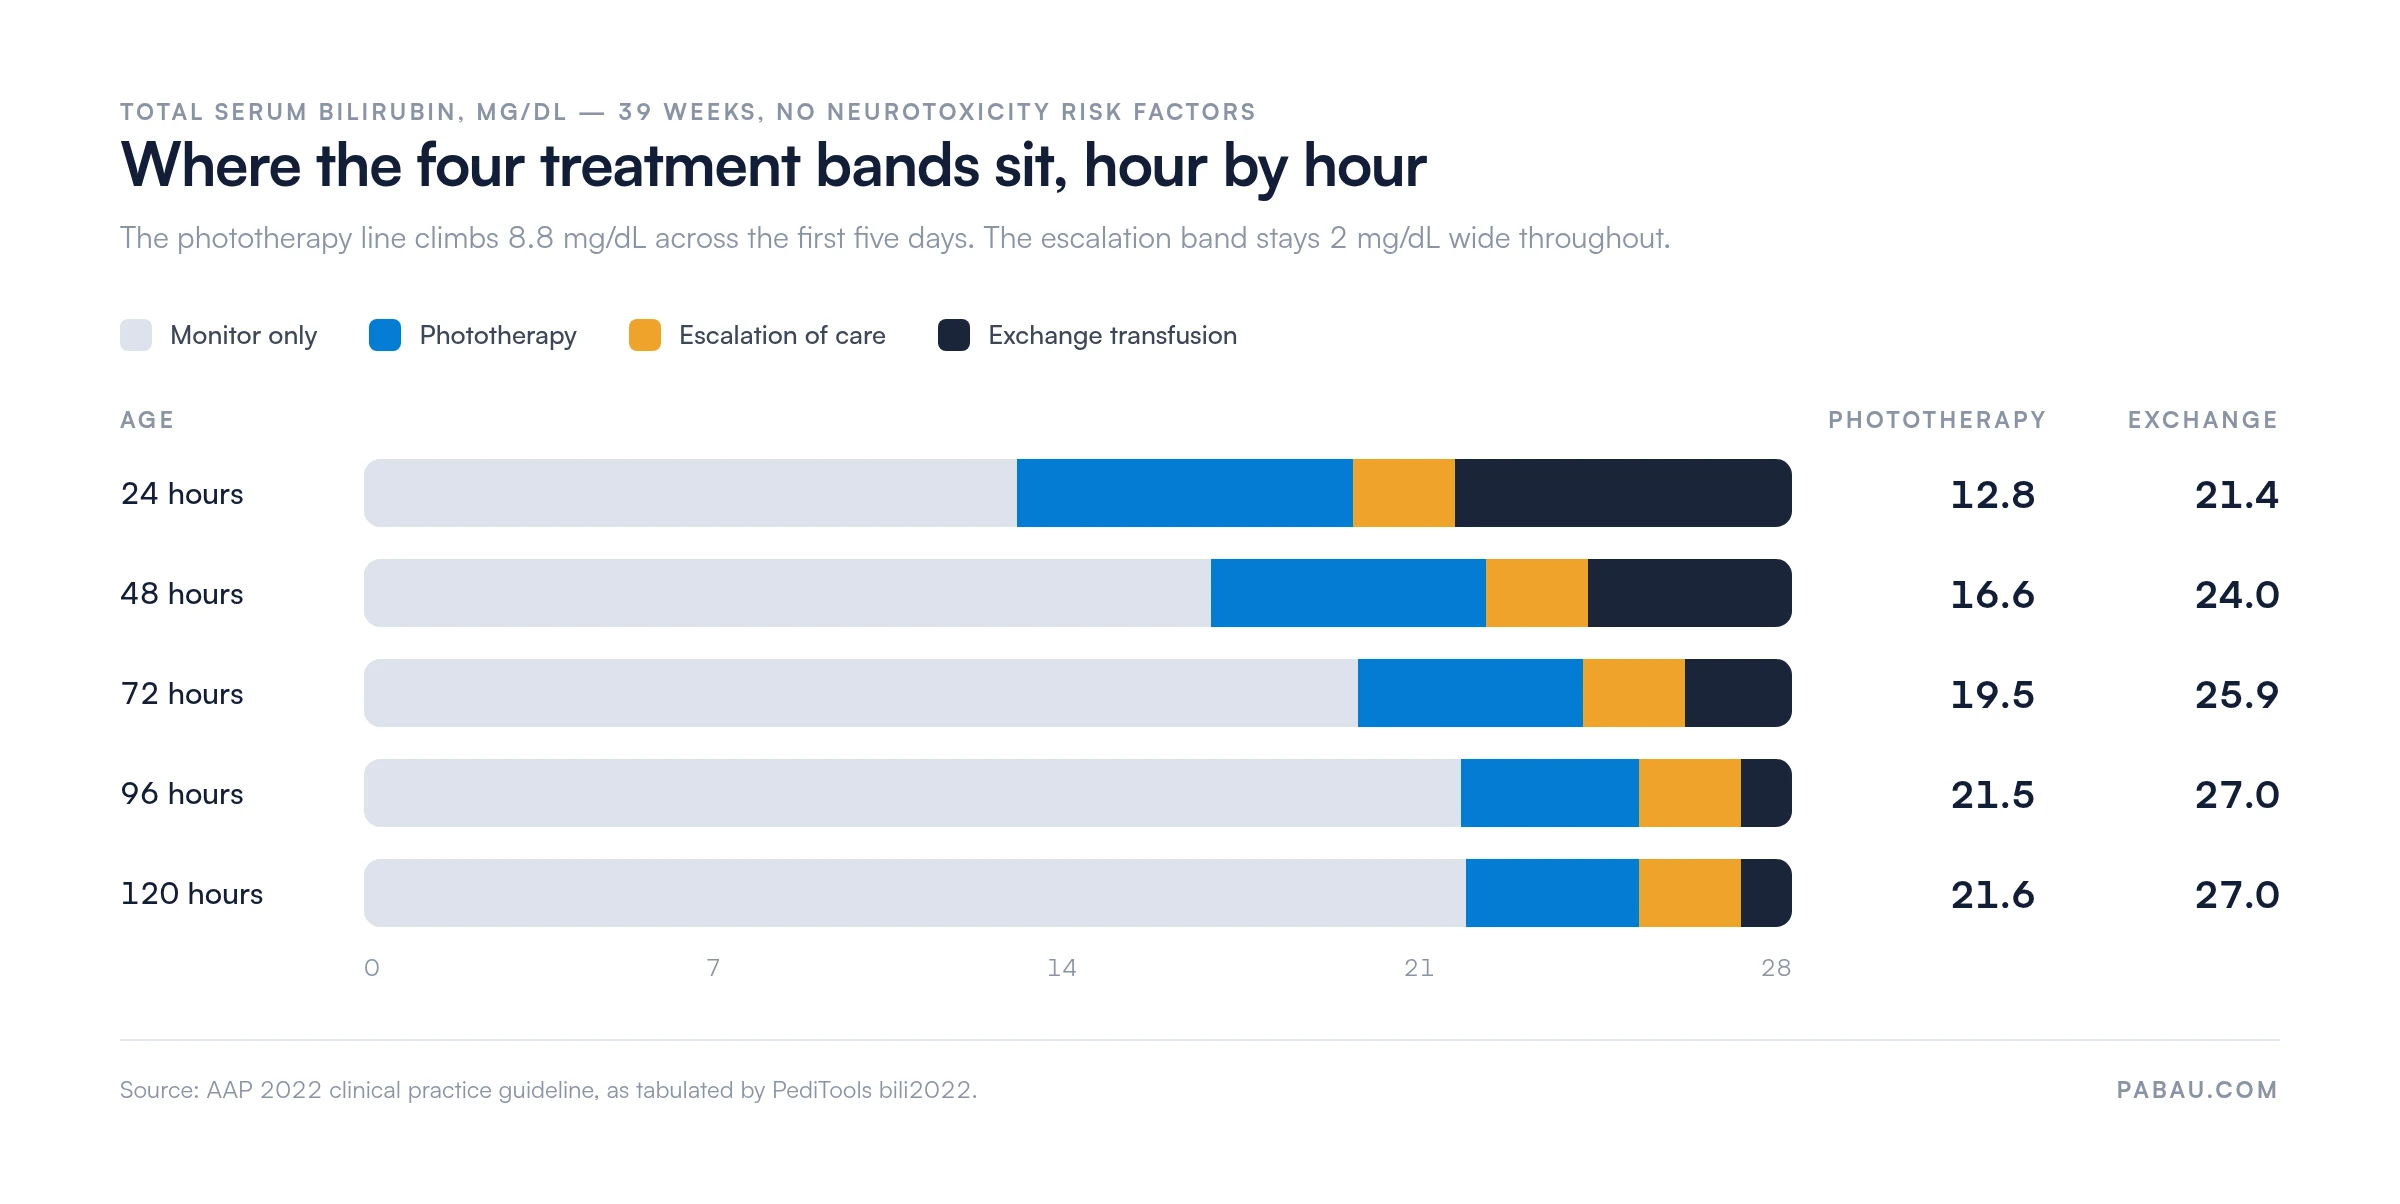
Once phototherapy starts, TSB is rechecked every 4 to 6 hours until the trend is clearly falling. Intensive phototherapy is judged on that trajectory, not on a single repeat value. After 24 hours of steady decline the interval can lengthen.
Treatment stops once TSB sits at least 2 mg/dL below the threshold for the infant’s age and risk category.
Documentation carries the same weight as the lab value here. Record each TSB, the time it was drawn, whether it was serum or transcutaneous, and the decision that followed. Writing safer clinical notes is the same discipline applied to every other entry in the chart.
Rebound hyperbilirubinemia can appear 24 to 48 hours after the lights come off, so a follow-up draw is routine.
Discharge criteria are narrower than they look. TSB should be stable or falling and well below the threshold for that age. A feeding or supplementation plan needs to be in place, and follow-up should be booked within 24 hours.
Parents should also leave knowing three warning signs. Those are lethargy, poor feeding, and pallor.
Standard infant bilirubin charts report total serum bilirubin, which combines the indirect (unconjugated) and direct (conjugated) fractions. Every threshold on this page is a TSB threshold. The direct fraction still has to be assessed separately when it runs abnormally high. That means above 1.0 mg/dL in absolute terms, or more than 20% of TSB.
Raised indirect bilirubin is what the chart is built for, and it drives the phototherapy decision. Raised direct bilirubin points instead to hepatic, biliary, or hemolytic disease. That finding calls for liver function tests, a direct antiglobulin test, and viral serologies. Neither threshold table on this page applies to that picture.
The infant bilirubin chart template is a ready-made PDF from Pabau, our practice management software. Practices can download it, add their logo and contact details, and slot it into neonatal assessment workflows.
It carries the phototherapy and exchange threshold tables, the risk-factor list, and space to record TSB values, timings, and decisions.
The chart slots in alongside the rest of the newborn workup. Practices that use our newborn exam template can file both in the same record. Wards that keep printed references on hand often pair it with the pediatric vital signs chart.
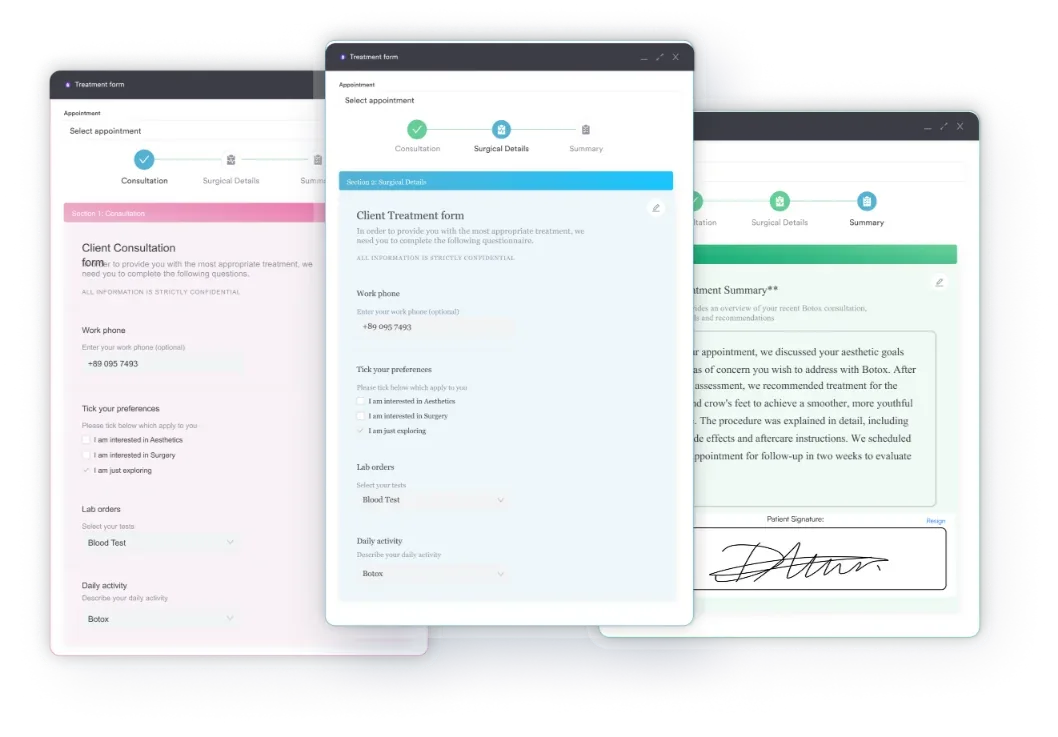
After downloading, teams can print copies for the ward or fold the chart into practice protocols. Uploading it as a workflow template keeps every newborn assessment on the same steps. That supports audit compliance and cuts transcription errors.
Laminate a copy of the chart and post it in the nursery so staff can read a threshold without opening a file. Print the guideline version and date on the copy. When the AAP revises the thresholds, every laminated sheet in the unit has to be replaced on the same day.
Most units still run bilirubin monitoring on a whiteboard and a paper chart. Someone has to remember that the 48-hour draw is due, chase the result, and write the reasoning into the notes afterward. When a baby is discharged at 36 hours, the follow-up depends on a phone call that may or may not get made.
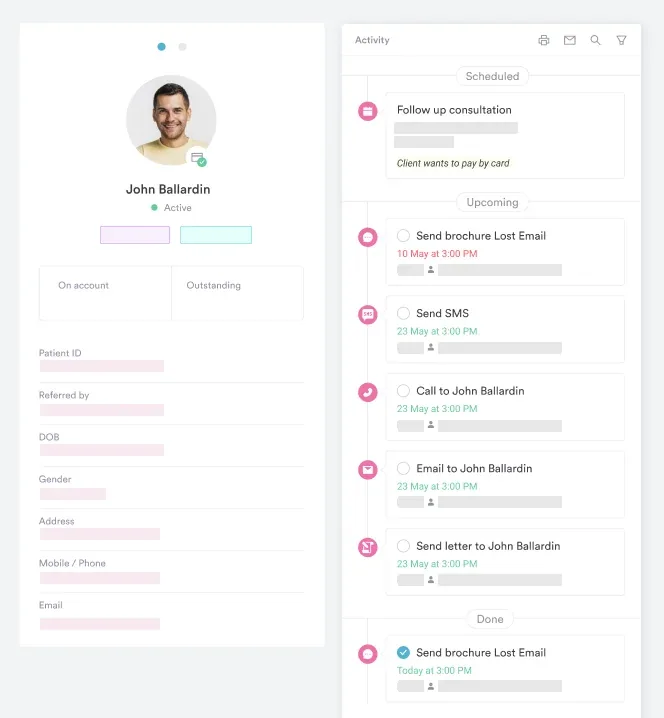
Pabau closes that loop inside the record itself. Practices running GP clinic software can attach the bilirubin chart template to a workflow that fires when a newborn is admitted. The workflow prompts the TSB draws at 24, 48, 72, and 96 hours.
It flags the result when it lands and walks the clinician through the threshold comparison at the bedside. The outcome is a decision trail you can defend. Every phototherapy decision is timestamped with the gestational age, hour of life, and threshold applied.
A HIPAA compliance audit then reads a complete sequence rather than a set of initials in a margin.

Pabau’s digital forms and centralized patient records help practices stay compliant, reduce rework, and focus on patient outcomes.

The infant bilirubin chart turns one lab value into an evidence-based decision about a jaundiced newborn. Read it against the AAP 2022 curves for gestational age and hour of life. The answer says whether phototherapy is due now, whether exchange transfusion is in range, or whether the baby simply needs another draw.
Using the figures from the superseded 2004 guideline, or a rounded version of them, moves those lines by several mg/dL. That is the argument for holding the chart in the record rather than on a laminated sheet.
Book a demo to see how Pabau keeps the current thresholds in a standard workflow and every phototherapy decision on the record.

Running the physical exam itself? Pediatric physical examination walks through the sequence and the findings worth recording.
Keeping vaccination histories straight after discharge? Immunization record form gives parents and staff one shared record to work from.
There is no single normal number, because the safe range moves with the baby’s age in hours and gestational age. Take a 39-week infant with no neurotoxicity risk factors. Under AAP 2022, that baby stays below the phototherapy threshold until TSB reaches 16.6 mg/dL at 48 hours, or 21.5 mg/dL at 96 hours. The same 16 mg/dL reading at 24 hours of life would already sit above the 12.8 mg/dL threshold.
Phototherapy starts when total serum bilirubin reaches the threshold for the infant’s gestational age, age in hours, and neurotoxicity risk status. Under AAP 2022, a 39-week infant with no risk factors reaches that threshold at 16.6 mg/dL at 48 hours of life. A 36-week infant at the same age reaches it at 14.8 mg/dL. If any neurotoxicity risk factor is present, the 39-week threshold falls to 14.0 mg/dL.
The Bhutani nomogram is a reference curve derived from healthy newborn populations. Clinicians plot an infant’s TSB against postnatal age on it to place the reading in a low, low-intermediate, high-intermediate, or high-risk zone. Those percentile zones predict which infants are likely to develop significant hyperbilirubinemia, so they drive screening and follow-up rather than the treatment decision itself. Treatment thresholds come from the AAP 2022 curves.
Locate the row matching the baby’s postnatal age in hours. Pick the column matching the gestational age at birth, then use the table that matches the baby’s neurotoxicity risk status. Read the threshold at that intersection and compare the measured TSB to it. Phototherapy is indicated when TSB meets or exceeds the threshold. Below it, treatment is not indicated, but follow-up testing still is.
After phototherapy stops, a follow-up TSB 24 to 48 hours later screens for rebound hyperbilirubinemia. During active phototherapy, TSB is usually rechecked every 4 to 6 hours until the trend is clearly falling. The interval can then lengthen. The AAP 2022 guideline sets the specific follow-up intervals by risk category.