CRM for chiropractors: how to manage patients, bookings and marketing
A CRM for chiropractors is a patient relationship management system built around...

Last Updated: Oct 13, 2026
NPS healthcare is a way of measuring patient experience that tells you, in one number, how likely your patients are to recommend your practice. Patients answer a single 0 to 10 question, and the resulting score runs from -100 to +100. CustomerGauge’s benchmark data puts the healthcare average at 65, the highest of any industry it tracks.
A 2022 systematic review published in PubMed Central looked at how healthcare uses the Net Promoter Score. It is now one of the most widely adopted patient feedback instruments in the sector. Academic debate about how well it predicts clinical quality is still running.
NPS is a sensible starting point if you are already measuring patient satisfaction. It gives you one question, one score, and one trend line the whole team can read. This guide covers the calculation, the benchmarks worth aiming at, how to run surveys patients finish, and what to do with the answers.

NPS healthcare measures patient loyalty with one 0 to 10 recommendation question, producing a score between -100 and +100.
Promoters (9-10) minus Detractors (0-6) gives your NPS, and Passives (7-8) sit outside the formula.
CustomerGauge puts the healthcare average at 65, so treat 63 as the line for a good score and 70 as exceptional.
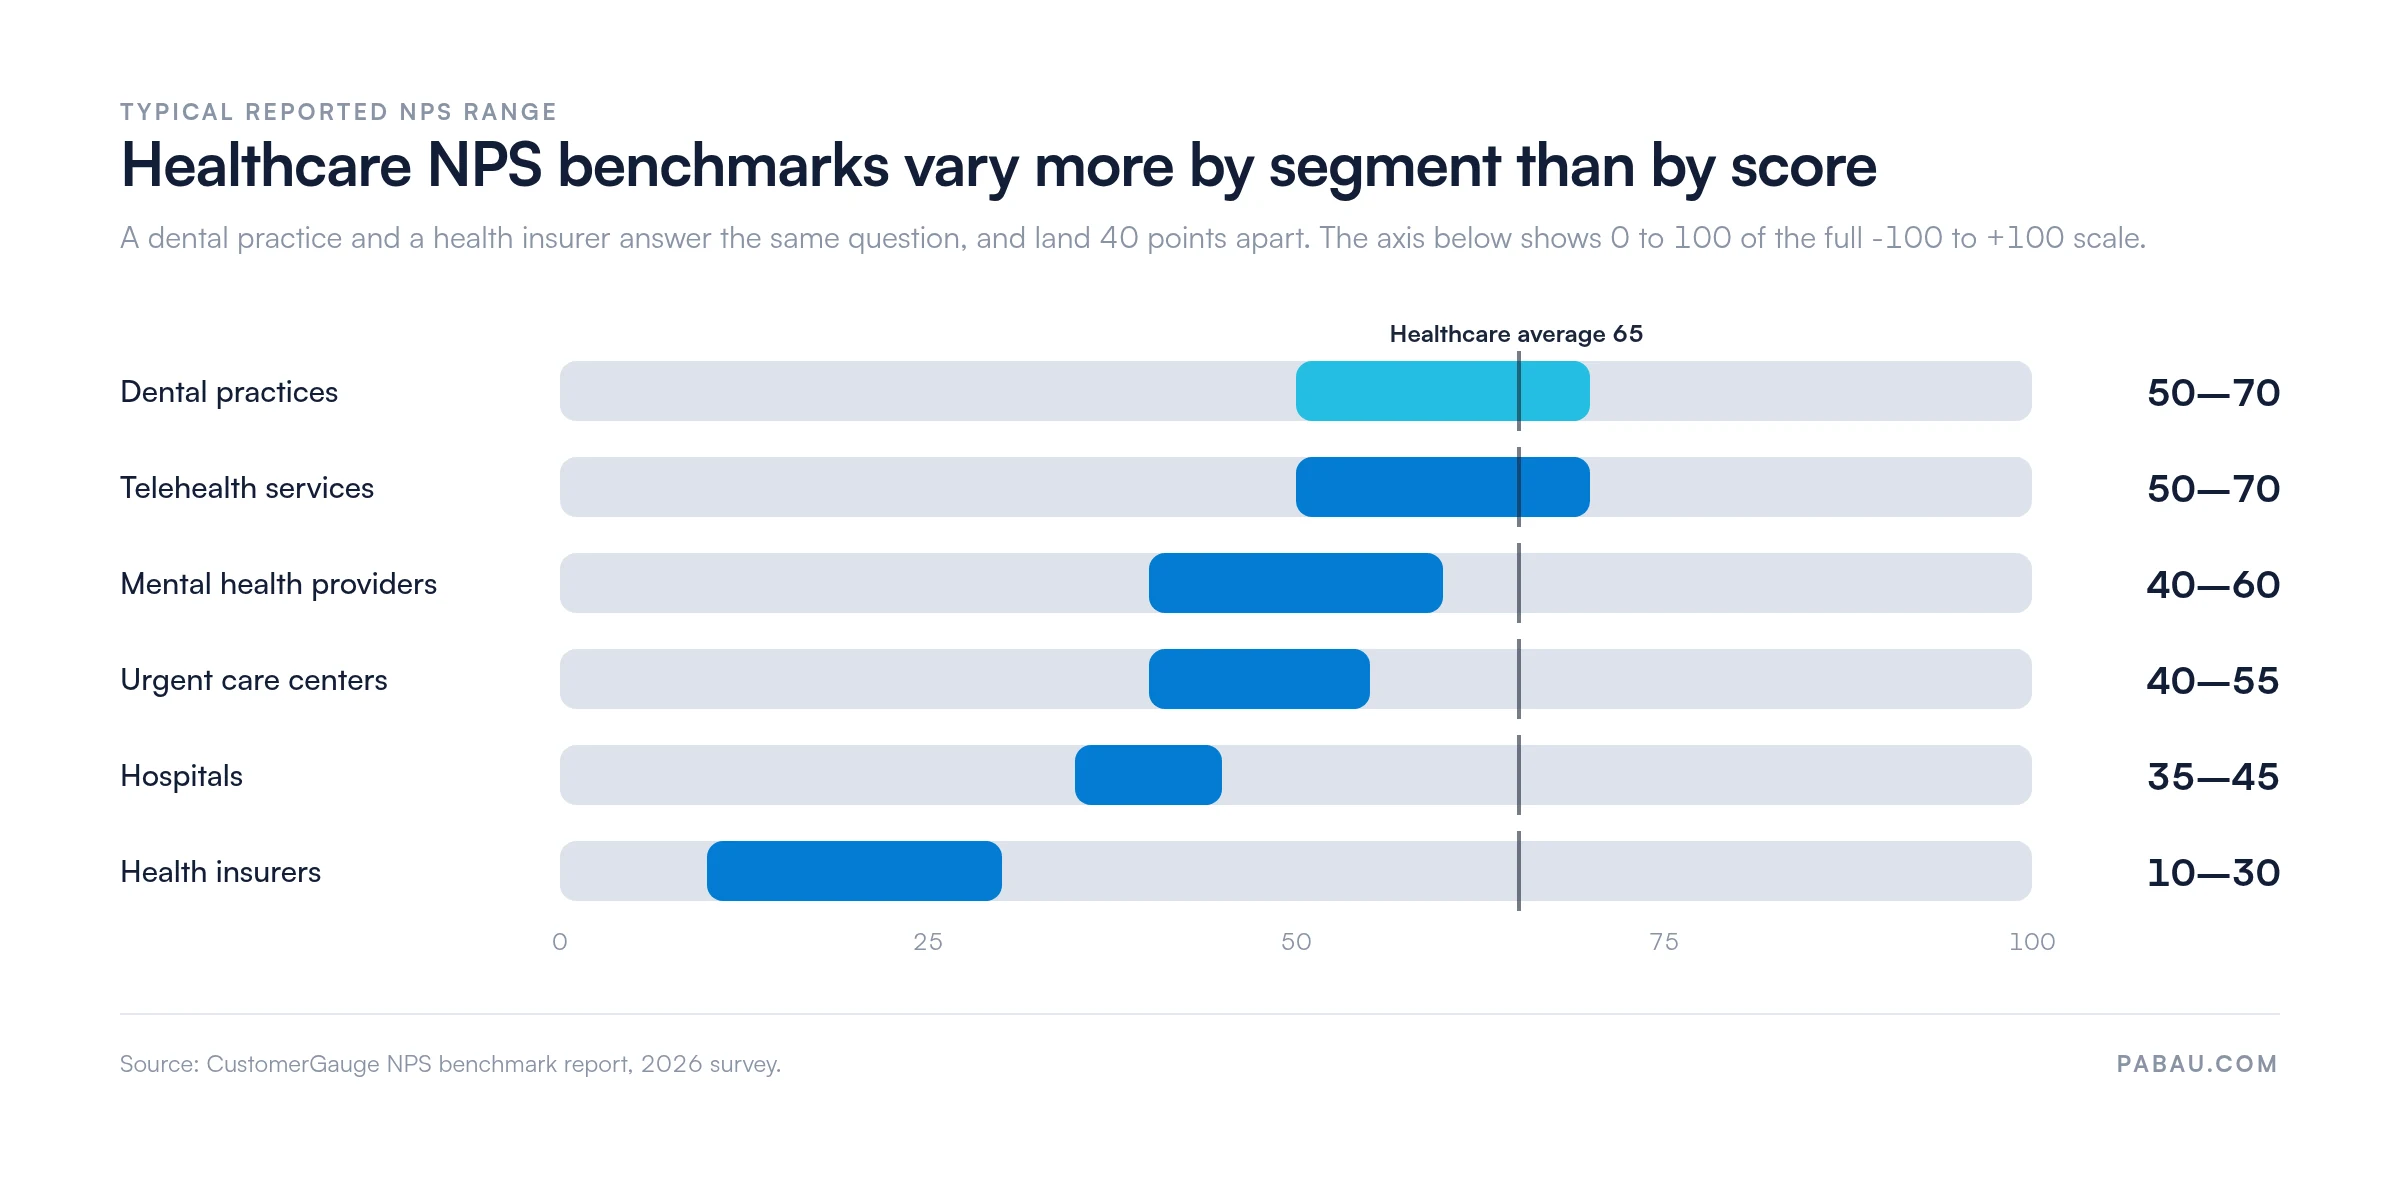
Segment averages vary widely, from roughly 10 to 30 among health insurers up to 50 to 70 in dental practices.
Pabau sends a star-rating feedback survey after every appointment and routes four and five-star replies to your Google Business Profile.
NPS healthcare is the Net Promoter Score methodology applied to patient experience. It uses one question — “How likely are you to recommend this practice to a friend or family member?” — to quantify patient loyalty.
Bain and Company and Satmetrix developed the original framework in 2003. Healthcare organizations adopted it because it reduces a complicated patient journey to one comparable data point.
Patients respond on a scale of 0 to 10. Their answers slot into three groups: Promoters (9-10), Passives (7-8), and Detractors (0-6). The score itself runs from -100, where every patient is a Detractor, to +100, where every patient is a Promoter.
Healthcare organizations use NPS for three practical reasons:
NPS is not a regulatory requirement. It is distinct from HCAHPS, the Hospital Consumer Assessment of Healthcare Providers and Systems. The Centers for Medicare and Medicaid Services mandates HCAHPS for US hospitals and ties it to reimbursement rates. NPS sits alongside mandatory surveys, not in place of them.
The net promoter score is calculated by subtracting the percentage of Detractors from the percentage of Promoters. Passives are counted in the total respondents but excluded from the formula itself.
The formula: NPS = % Promoters minus % Detractors
Worked example: 100 patients respond. 60 score 9-10 (Promoters), 25 score 7-8 (Passives), 15 score 0-6 (Detractors). NPS = 60% minus 15% = +45. That is a solid score for most healthcare segments.
A follow-up open-text question (“What is the main reason for your score?”) is standard practice. The quantitative score tells you where you stand. The written answer tells you why.
Patient loyalty shows up in the bank account. A practice with a high NPS generates referrals without paid advertising. A practice with a falling NPS is losing patients to competitors, often without a single complaint anyone can investigate.
Four reasons NPS healthcare data is worth tracking:
Access complaints surface in NPS long before they reach a review site. When a low score mentions waiting or rescheduling, the fix usually sits in the schedule rather than in the treatment room. That is where online booking for practices earns its keep.
A good NPS score in healthcare depends on the care setting. According to CustomerGauge’s NPS benchmark report, healthcare averages 65 in its 2026 survey and 63 blended across every edition since 2017. That is the highest of any industry CustomerGauge tracks, ahead of financial services at 60 and software at 51.
Anything above 63 counts as good. A score of 60 or better is strong performance, and 70 or more is exceptional. The headline figure hides a lot, though, because the segments inside healthcare sit 40 points apart.
The NHS England Friends and Family Test uses a similar single-question loyalty format. NHS England’s patient experience guidance shows that GP practices regularly achieve recommendation rates above 80%. That translates loosely to an NPS above +50, which is a useful upper target for private GP practices competing on quality.
Read your score against your own trend first, then against your segment. An NPS of +35 that has risen steadily for six months tells you more than a static +50.
A survey patients finish needs three things: the right timing, the right channel, and a follow-up question that produces usable comments. Get one of them wrong and your response rate drops sharply.
Read more on capturing patient feedback effectively before you design the workflow.
Send the survey within 24 hours of the appointment. Patient memory of the visit is sharpest in the first day, and response rates fall off after 48 hours.
For treatment journeys spanning several appointments, such as physical therapy or a course of aesthetic treatments, send after session two or three instead. By then the patient has enough experience to give a meaningful score.
SMS is opened far more reliably than email, so it usually wins on response rate. Email still suits patients who consented to email only, or who booked from a desktop. Use both where consent allows.
Timing and channel also decide whether a public review request works. The send windows for requesting patient reviews are tighter, with SMS best sent in the first two hours after the visit.
The standard question: “On a scale of 0 to 10, how likely are you to recommend [practice name] to a friend or family member?” Follow it immediately with an open-text box: “What is the main reason for your score?” Stop there. Extra questions at this stage reduce completion rates and dilute the signal.
You need at least 30 responses before your NPS means much. A solo practitioner seeing 15 patients a week reaches that threshold in two to three weeks at typical response rates of 15% to 30%. Multi-practitioner practices can segment by practitioner only once each one has 30 or more responses in the measurement period.
The value of NPS sits in what happens after the score arrives. Read what Detractors described, change it, and watch whether the score recovers over the following weeks.
Building feedback into your patient care management workflows means decisions about staffing, booking, and communication follow what patients report rather than what the team assumes.
A five-step closed-loop process for NPS action:
Split your NPS by time of day and day of week, not just by practitioner. A practice that scores consistently lower on Friday afternoons usually has a staffing or scheduling problem in that slot, rather than a clinical one. Standard survey reports rarely group the data that way, so you may have to do it yourself.
NPS has limitations every practice manager should understand before treating the score as a full measure of care quality. The PMC9615049 systematic review found limited evidence that NPS predicts clinical outcomes when used on its own. Likelihood to recommend is not the same measure as whether care was safe, effective, or clinically appropriate.
Three limitations specific to healthcare:
Pair NPS with at least one other measure. That might be a longer post-appointment satisfaction survey, HCAHPS data where it is mandated, or a patient focus group. NPS is an early-warning indicator, not a comprehensive quality audit.
A word-pair rating scale is another option, and it captures how the visit felt rather than how likely someone is to recommend you. Patients mark a point between two opposites, such as rushed and unhurried, and that point becomes the score.
Practice management software like Pabau handles the collection step, although it uses its own feedback survey rather than a formal NPS one. The survey goes out by email or SMS once an appointment is marked complete, while the visit is still fresh, and it asks for a star rating instead of a score on the 0 to 10 NPS scale.
That distinction matters if you report NPS to a board or a group owner. You can keep the 0 to 10 question in a dedicated survey tool and let Pabau handle routine post-appointment feedback. Or you can run the star-rating survey on its own and track the share of four and five-star replies as your loyalty trend.
Three things the automated survey does that a standalone tool cannot:
Pabau runs practices across the full size range, from solo practitioners to multi-location groups. Whichever way you collect the score, the value comes from what the practice changes afterwards.

Pabau sends a star-rating feedback survey by email or SMS once an appointment is complete. Four and five-star replies go to your Google Business Profile, and lower ratings reach you privately first.

NPS gives a practice one consistent signal about whether patients would recommend it. The number is easy to track and easy to act on. It works best as one input among several, rather than as a standalone verdict on the quality of care.
The practices that get value from it are the ones that close the loop. Score, read the comments, change one thing, then watch the next quarter. Skip that last part and the score just sits in a dashboard.
Want to see how post-appointment feedback fits your own workflow? Book a demo and we will walk through the survey and the reporting with you.

Comparing tools for running the survey itself? Patient satisfaction survey software weighs up the platforms that collect and report patient scores.
Need a process for the Detractors you find? Handling patient complaints covers how to respond to unhappy patients before the feedback becomes a public review.
Want the wider view of patient experience? Patient experience software maps the systems that shape how a visit feels from booking to follow-up.
NPS stands for Net Promoter Score, a patient loyalty measure that asks one question (“How likely are you to recommend us?”) and produces a score from -100 to +100. The score comes from the split between Promoters, Passives, and Detractors. Healthcare organizations use it to track patient experience trends and benchmark against segment averages.
NPS is calculated by subtracting the percentage of Detractors (patients who score 0-6) from the percentage of Promoters (patients who score 9-10). Passives (7-8) are counted in the total respondents but excluded from the formula. For example: 60% Promoters minus 15% Detractors equals an NPS of +45.
Anything above 63 counts as a good NPS in healthcare, according to CustomerGauge’s benchmark report. A score of 60 or better is strong performance, and 70 or more is exceptional. Your segment matters more than the headline figure. Dental practices typically land between 50 and 70, hospitals between 35 and 45, and health insurers between 10 and 30.
Healthcare providers use NPS surveys for three main purposes. The first is tracking patient loyalty trends over time. The second is spotting Detractors early enough for a follow-up call within 48 hours. The third is routing Promoters toward public review platforms to build online reputation. The open-text follow-up question supplies the detail needed to diagnose what is driving the score.
CustomerGauge puts the healthcare average at 65 in its 2026 survey, and at 63 blended across every edition since 2017. That is the highest of any industry it tracks. Segments vary widely, from roughly 10 to 30 among health insurers up to 50 to 70 in dental practices. Compare yourself against your own segment rather than the headline average.