CRM for chiropractors: how to manage patients, bookings and marketing
A CRM for chiropractors is a patient relationship management system built around...

Last Updated: Oct 13, 2026
A semantic differential scale asks patients to rate their care between two opposite words, like rushed and unhurried. They mark a point on a seven-point line, and that point becomes the score. It beats a star rating for one reason. A five-star rating tells you the visit went well, not which part of it worked.
Charles Osgood built the method in 1957, and healthcare research still leans on it. Get the adjective pairs right and you have feedback your team can act on the same week. Below you’ll find the pairs worth using, how to score them, and the mistake that quietly ruins the data.
A standardised assessment tool using seven-point bipolar adjective pairs to measure patient attitudes, treatment satisfaction, and clinical perceptions. Includes ready-to-use items, scoring guidance, and customisation instructions.
Download template
A semantic differential scale measures attitude using bipolar adjective pairs, usually on a seven-point line.
The Osgood model reads three dimensions at once, so you see evaluation, potency and activity separately.
Read the pairs as a profile rather than one average, because the average hides the pair that is lagging.
Keep the positive adjective on the same side for every pair, or the scores stop being comparable.
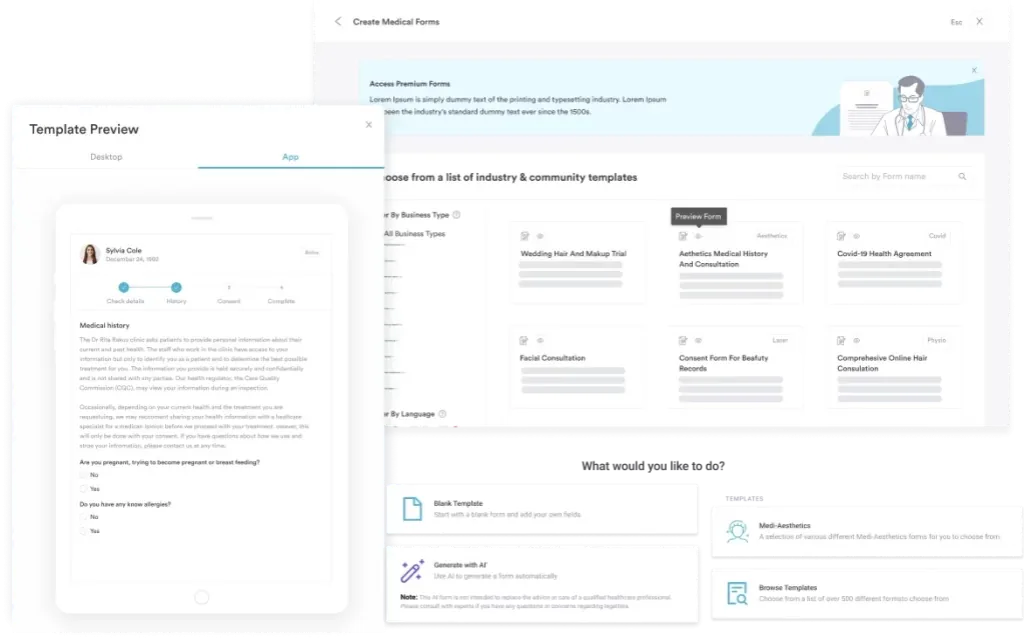
Practice management software like Pabau lets you build custom rating questions into digital forms, so answers land in the patient record.
A semantic differential scale measures how someone feels about a treatment, a clinician, or a waiting room. The patient sees two opposite adjectives, one at each end of a line, and marks where their own view sits. Comfortable at one end, uncomfortable at the other. That mark becomes a number.
Each pair of opposites is a semantic dimension. Charles Osgood and his colleagues tested hundreds of pairs in 1957, and three of them kept surfacing across languages.
Evaluation is the good-bad axis, potency the strong-weak axis, and activity the active-passive axis. Most clinical questionnaires lean hardest on evaluation, which is the axis patients answer fastest.
In a practice, it plays out simply. A patient rating an injectable appointment might mark effective-ineffective, then comfortable-uncomfortable, then necessary-unnecessary.
Three marks, and you learn more than a five-star box ever tells you. Put it alongside measuring patient satisfaction and you can see why a score moved, not only that it did.
Running one takes four steps. Choose the pairs, set the scale length, put it in front of the patient, then convert the marks into numbers.
Timing matters as much as wording. Send the form the day after the visit, while it is still fresh. Hands-off online booking already holds the appointment time, so the request can go out automatically. Nobody at the front desk has to remember.
Asking a patient to post a review online is a separate job. Public review requests have their own timing window, their own channels, and rules on incentives and review gating.
The pairs do the work, so start from ones that already map to a question you care about. Five common ones are below, with what each set actually measures.
Three or four pairs per form is plenty. A long grid of pairs looks thorough on screen and gets abandoned halfway down.
It earns its place wherever a yes/no question leaves you guessing. Ask “were you satisfied?” and you get a yes. A yes gives your team no instruction. A profile of pairs points straight at the part of the visit that dragged the score down.
Satisfaction after treatment. Responses show whether the treatment felt effective, whether the patient felt heard, and whether the room felt safe. Those three answers point at three different fixes. One is clinical, one is about manner, one is about the space.
Perception across a course of care. A physical therapy practice can run the same pairs before and after a course of treatment. If the hopeless-hopeful pair climbs over those weeks, that shift becomes an outcome measure you can show a referrer.
Therapeutic alliance in mental health. Counseling practices use supported-unsupported and understood-misunderstood to read the working relationship. Alliance quality predicts outcomes, so a pair that slips is worth raising before the next session.
Whichever use you pick, the answers need somewhere to live. A patient portal that already holds the patient’s file keeps responses beside the treatment notes, so nobody has to rebuild the picture in a spreadsheet.
Use a semantic differential when you want to know how something felt. Use a Likert when you want to know whether someone agrees with a statement. Both sit on a continuum, but they read different things.
The two are not rivals on the same form. Plenty of practices run a short Likert block on policy questions, then two or three adjective pairs on the visit itself. The Likert answers tell you what patients think of your rules, and the pairs tell you how the appointment felt.
A Net Promoter Score fits beside either one. One 0-10 question produces a figure you can set against NPS benchmarks by segment. Run two or three adjective pairs alongside it when you also want to know how the visit felt.
Scoring is arithmetic. Turn each mark into a number, average each pair on its own, then read the pairs side by side.
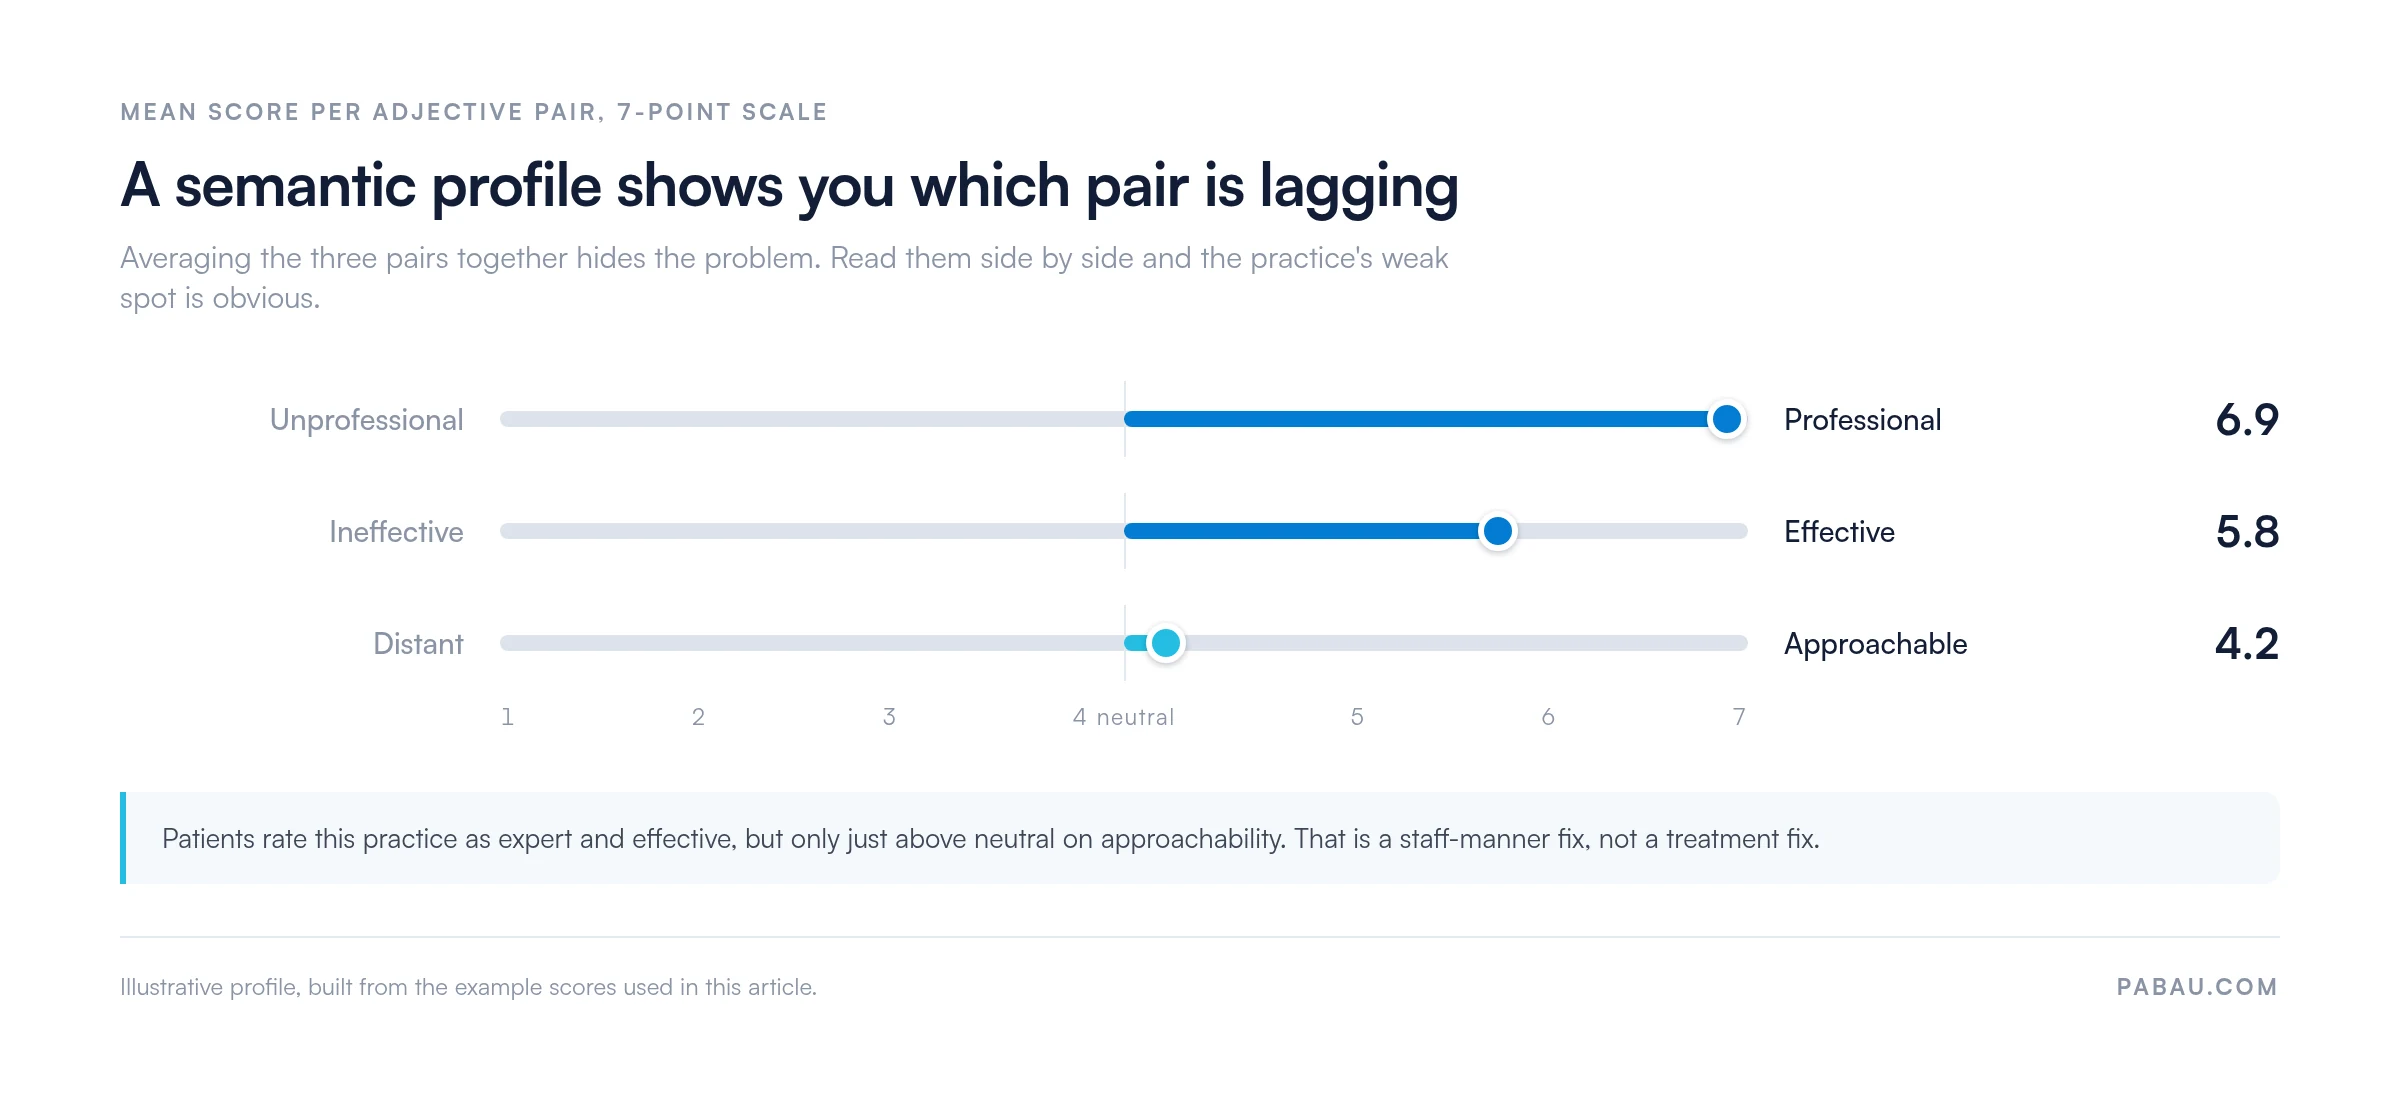
The profile is the point, so here is what one looks like once three pairs have been averaged.
Two mistakes spoil the data more often than any others. The first is flipping direction mid-form, with the positive adjective on the left for some pairs and on the right for others.
Patients answer on autopilot, and the scores stop being comparable. The second is averaging pairs that measure different things into one headline number. Report them separately, or the lagging pair disappears.
Most of the damage happens before a single patient sees the form. Work through this first.
That last one is worth the detour. Handing the draft to a receptionist or a family member finds the pairs that only make sense to the person who wrote them.
If you would rather start from a finished form, our patient satisfaction questionnaire covers similar ground with ready-made questions.
The scale also reads perception, not behavior. A patient can rate a treatment as effective and still skip the aftercare. Pair it with patient compliance monitoring before you draw conclusions about outcomes.
On validity, the evidence is good. The evaluation-potency-activity model holds up across dozens of languages, which makes the format usable with a diverse patient base.
When is it the right instrument? Whenever the answer you want is a perception. Treatment satisfaction, therapeutic alliance, confidence in a consent decision, how a practice feels to walk into. All four are attitudes, and attitudes are what this scale reads.
When is it the wrong one? When you are testing knowledge. Multiple choice does that job better and scores itself. The format also struggles with respondents who find abstract comparison hard, including young children and some patients with cognitive impairment.
Can you mix it with other measures? Yes, and most research does. Perception data sitting next to a clinical outcome tells you whether the two move together. That is a more useful finding than either measure gives you alone.
Feedback usually runs through a separate survey tool. The responses land in one system and the patient’s notes sit in another. Joining them up means exporting a spreadsheet that nobody has time to build, so the data gets read once and then forgotten.
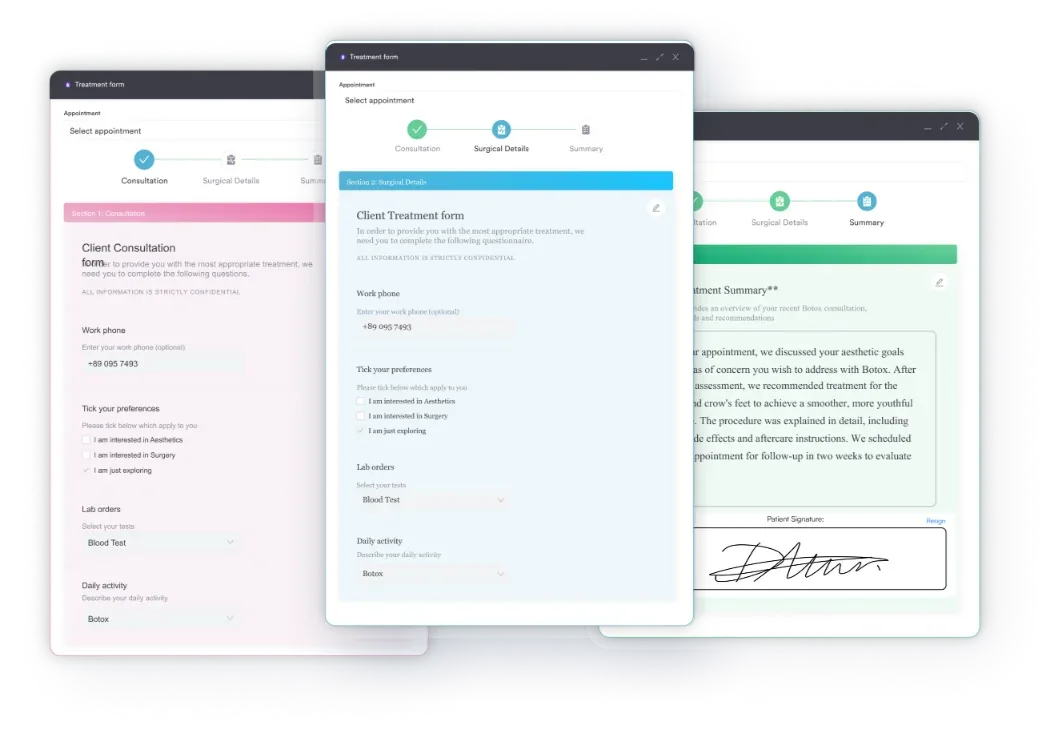
Practice management software like Pabau keeps both in the same record. You build your adjective pairs as custom rating questions in a digital form. Send it after the appointment, and each answer files itself against that patient. When a score looks off, the treatment note is one click away instead of one export away.
That matters most when a pair starts slipping. You can see which clinician, which treatment and which week, then follow up with the patient before the pattern turns into a public review.
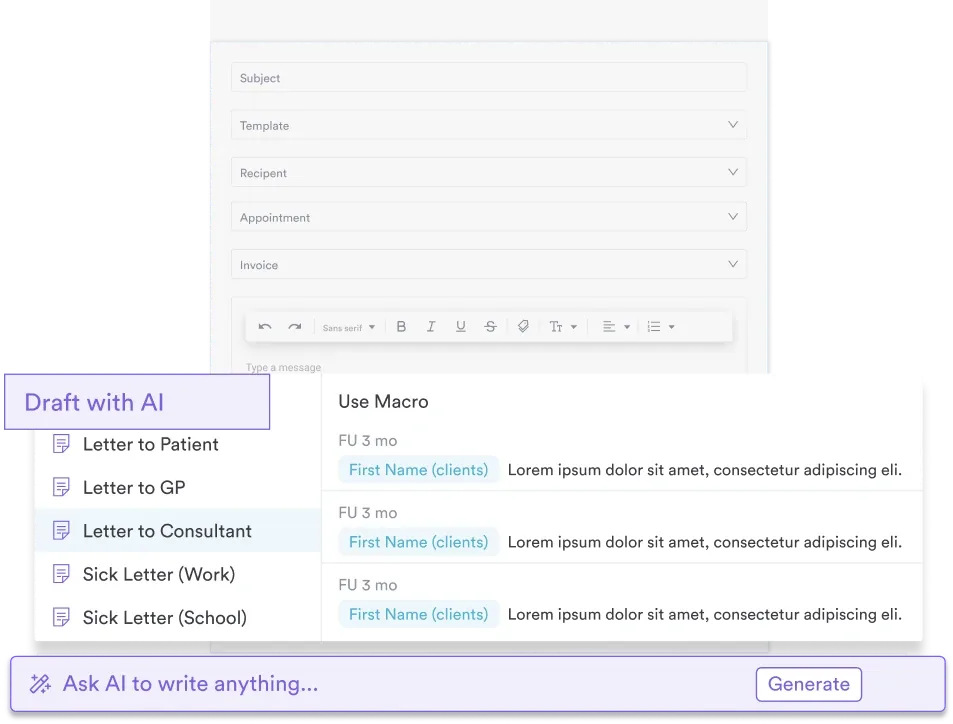

Build your adjective pairs as custom rating questions in Pabau’s digital forms, then send them after the appointment. Each answer files itself against the patient record, so your team reads the profile without building a spreadsheet.

The scale is easy to run and easy to ruin. Choose pairs a patient would genuinely use about their own care. Keep the direction consistent down the page. Do both and the feedback comes back pointing somewhere.
The judgment worth keeping is this one. Read the profile, not the average. A mean of 5.6 across the three pairs above looks healthy, and it buries the 4.2 that tells you what to change next.
Download the template, run it after a week of appointments, and see what the profile says. Book a demo to see how Pabau keeps that feedback on the patient record instead of in a separate survey tool.

Want a finished form instead of a blank one? Patient satisfaction questionnaire hands you ready-made questions you can send after any appointment.
Running a wider survey this quarter? Patient experience survey covers what to ask, when to send it, and how to keep response rates up.
Not sure which score to trust? Measuring patient satisfaction explains what each common metric does and does not tell you.
Need to report feedback to a board or a referrer? Patient experience metrics sets out the measures worth tracking month to month.
Strictly it is ordinal, because the distance between points 5 and 6 may not match the distance between 2 and 3. In practice, researchers treat seven-point semantic differential data as interval and run means and t-tests on it. That convention is widely accepted, so report your means and state which scale you used.
A seven-point line has a neutral midpoint at 4, and most clinical questionnaires keep it. Patients who genuinely hold no view need somewhere honest to go. The trade-off is central tendency bias, where respondents park in the middle to avoid committing. If you need patients to pick a side, use a six-point line with no center.
A Stapel scale uses one adjective instead of a pair. Its numeric range runs from a negative value to a positive one, typically -5 to +5. It is quicker to build, because you never have to find a true opposite. It also captures less, which is why clinical perception research usually sticks with bipolar pairs.
Yes. Qualtrics and most survey platforms offer a matrix or slider question type that puts two adjectives at opposite ends of a row. You may prefer to keep responses with the patient’s notes. Pabau’s digital forms let you build custom rating questions that store each answer in the patient record.