EHR ROI: How to calculate and maximize your return
EHR ROI is the financial return a practice earns on its electronic health record...

Last Updated: Oct 15, 2026
Healthcare business intelligence (BI) is the process of collecting clinical, operational, and financial data and turning it into dashboards that guide decisions.
Practice data often sits in several disconnected systems, like the calendar, the billing platform, and the EHR. So a simple question, such as which services make money, can take an afternoon of spreadsheet work.
The good news is that a small practice can get most of the value without a data team or a warehouse. Below, we cover how healthcare BI works, the metrics worth tracking first, the mistakes that stall it, and where to start.

Healthcare business intelligence turns disconnected clinical, operational, and financial data into dashboards and reports that guide decisions.
The highest-value use cases are clinical performance tracking, revenue cycle analysis, and scheduling and capacity planning.
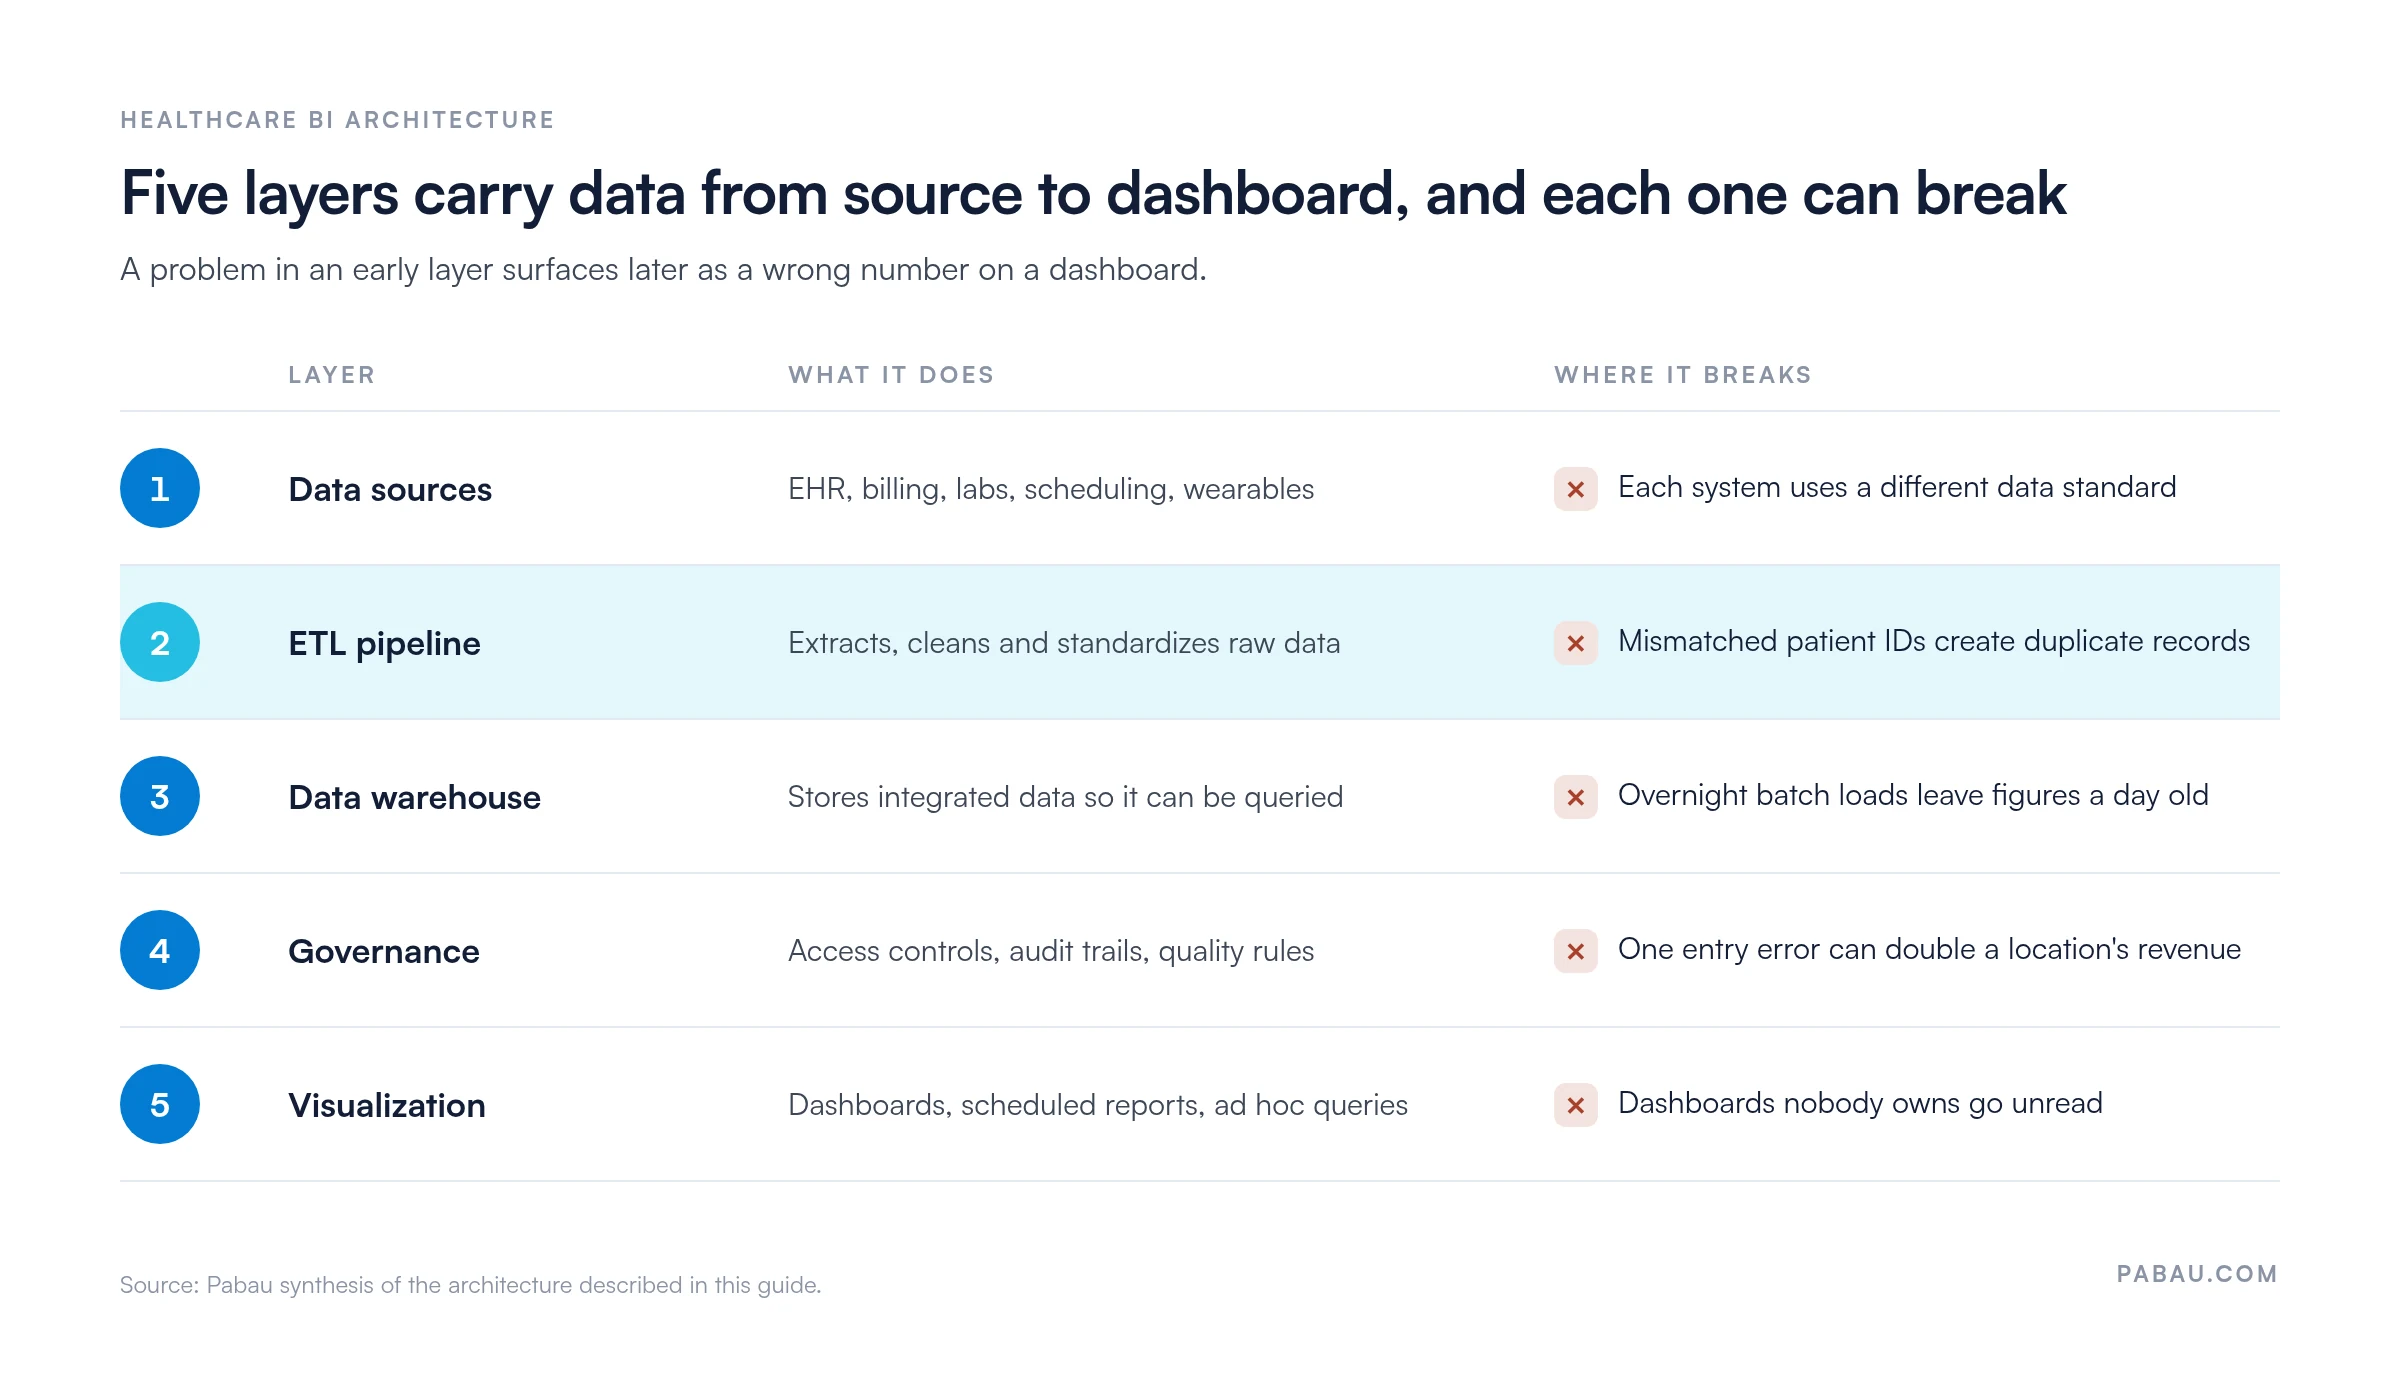
A full BI system has five layers: data sources, an ETL pipeline, a data warehouse, governance controls, and a visualization layer.
Smaller practices can skip most of that build by using the reporting built into their practice management software.
Start with five metrics, give each one an owner, and review them weekly before adding more.
Healthcare business intelligence is a set of tools, processes, and data infrastructure. Together, they collect data from across a practice, standardize it, and present it as dashboards, reports, and alerts. It draws on three disciplines: data engineering, data governance, and data visualization.
Healthcare data needs more care than general business data. In the US it falls under HIPAA, and in the UK and EU under GDPR. Both require strict access controls, audit logging, and de-identification, which most commercial BI tools don’t enforce by default.
The data itself is also mixed. One patient visit creates structured data, like diagnosis codes and billing amounts. It also creates semi-structured data, like lab values, and unstructured data, like clinical notes and imaging reports. Combining all three into one picture takes purpose-built pipelines.
Most practices already have plenty of data. The problem is where it lives. Scheduling data sits in one system, billing in another, and clinical notes in a third.
Picture a practice manager checking whether a service line is profitable. They pull figures from three platforms, reconcile mismatched formats, and hope nobody entered an invoice twice. That takes hours, and one duplicate skews the answer.
Healthcare BI replaces that routine with a single source of truth. The finance lead opens one dashboard instead of three exports. It shows net revenue per service line, adjusted for no-shows and cancellations, by practitioner and location.
There’s a clinical case too. Tracking readmission rates, care pathway adherence, and treatment outcomes at scale needs aggregated, clean data. Quality reporting programs run by the Centers for Medicare and Medicaid Services also require standardized outcome measures. Those measures are only as reliable as the data behind them.
The most valuable BI applications fall into three domains. The table below maps each one to its data sources and the KPIs it surfaces.
Clinical BI pulls data from EHRs, lab systems, and imaging platforms to show whether care is effective and consistent. A multi-site physical therapy group, for example, can compare discharge outcomes across locations. It can also see which therapists achieve the fastest functional recovery and flag patients who miss the expected trajectory.
That analysis depends on clean, consistent coding. Inconsistent diagnosis codes or missing procedure records break it. That’s why data governance and compliance management come first, before any clinical dashboard.
Financial BI is where most smaller practices see the fastest return. Tracking revenue cycle metrics in a dashboard, rather than a monthly spreadsheet, shows a rising denial rate early. The practice manager can act before it becomes a cash flow problem.
BI also surfaces patterns that manual reporting hides:
Scheduling analytics are among the easiest wins for a practice. A dashboard that tracks utilization by time slot, practitioner, and service type shows exactly where capacity goes unused.
For example, a practice might find a 30% no-show rate on Monday afternoons. Friday mornings, meanwhile, run at a 95% booking rate. That tells you where to apply a cancellation policy, an automated reminder, or a pricing incentive.
Reviewing practice management reports weekly turns those patterns into decisions, rather than surprises at month end.
Building a working BI system means connecting five technical layers. Each one is a potential failure point if it’s poorly designed or governed:
The table below shows what each layer does and where it typically breaks.
EHRs are the main source of clinical data. Billing platforms supply financial and claims data, and lab systems contribute test results. Scheduling platforms add appointment history. Wearables and remote monitoring devices add continuous readings that older BI systems weren’t built for.
Most of these systems use different data standards. EHRs may export using HL7 FHIR, while billing systems often produce flat files.
The Office of the National Coordinator for Health Information Technology (ONC) oversees EHR certification in the US. ONC’s certification rules require certified EHRs to support FHIR R4-based standardized APIs. That has improved interoperability, but connecting mixed systems still needs careful ETL design.
Data governance sets who can see which data, where it came from, and whether it can be trusted. Without it, dashboards mislead. A report showing 15% revenue growth might reflect growth. It might also reflect one location’s data entry error that doubled its billing figures.
Governance frameworks usually cover four areas:
Audit your data sources before investing in a BI platform. If your scheduling system and billing system use different patient identifiers, your ETL pipeline will create duplicate records. Resolving that downstream is expensive. Fix the identifier mismatch first.
Healthcare BI tools fall into two broad groups: general-purpose BI platforms adapted for healthcare, and purpose-built healthcare analytics solutions.
The first group includes Tableau and Microsoft Power BI, often running on top of data warehouses such as Snowflake. They offer powerful visualization and querying, but they need significant configuration to become HIPAA-ready. Business associate agreements (BAAs), de-identification workflows, and custom access controls all sit on top of the base platform.
A large hospital system with a data engineering team can make this work. A 10-practitioner practice usually can’t.
Purpose-built healthcare BI solutions come with HIPAA-aligned infrastructure, pre-built clinical data models, and connectors for major EHRs. They trade flexibility for speed of deployment. Epic, the dominant EHR for large health systems, has native analytics modules, but they only work inside the Epic ecosystem.
Weight these criteria by your practice’s size and complexity. A community hospital and a five-practitioner dermatology practice need very different setups:
Enterprise BI assumes a data engineering team, a cloud budget, and months of integration work. Most med spas, physical therapy practices, and private practices have none of those.
They still need to know which services drive revenue and which practitioners rebook best. They also need to know which days have spare capacity for a promotion.
A practice management app with reporting built in closes most of that distance. Instead of extracting data, loading a warehouse, and building a Tableau report, the owner opens one system. The figures are already calculated, because bookings, invoices, and notes live in the same place.
A practice running 200 appointments a week doesn’t need a data warehouse. It needs to see, at a glance, that Tuesday afternoons run at 60% utilization while Thursday mornings are overbooked. Built-in clinic dashboard software shows that without a separate tool, budget, or login.
The practical difference between enterprise BI and built-in practice BI comes down to three factors:
If you’re comparing platforms on reporting, our guide to the best medical practice management software is a good place to start.
The quickest way to stall a BI project is to build dozens of reports nobody reads. A tighter first month works better. Here’s the sequence we’d follow in a practice of any size:
By the end of the month, the team checks five numbers every week and acts on them. That habit is worth more than any extra report.
Many healthcare BI implementations stall, and the causes look similar at every size. Here are the common mistakes, each with its fix:
Three shifts are changing what healthcare BI can do.
Predictive analytics. Machine learning models use historical BI data to forecast rather than describe. They can flag patients likely to miss a follow-up, slots likely to see late cancellations, or services nearing capacity.
These models need substantial historical data and validation first. Tools that look impressive in research settings often perform poorly in production. Treat any deployment as experimental until it’s validated in your own setting.
Real-time processing. Batch-based BI processes data overnight, so a same-day cancellation reaches the dashboard the next morning. Streaming architectures process events as they happen, and dashboards update in seconds. Smaller practices get similar speed from platforms that update reports as transactions occur.
Natural language querying. Instead of building a report, a practice manager types a request like “show me revenue by service for the last 90 days, excluding cancellations.” The system returns the answer. That removes the main barrier keeping non-technical staff away from BI tools.
Many practices still answer business questions by exporting from the calendar, the billing tool, and a spreadsheet, then stitching the files together. Pabau, the all-in-one practice management system we build, keeps appointments, invoices, and patient records in one place. So the reporting starts from data that already matches.
Pabau’s built-in reporting and analytics include more than 50 pre-built reports covering patients, sales, appointments, financials, leads, and team performance. Reports update as bookings and payments happen. Dashboards are ready to use once your account is set up with our onboarding team.
Your weekly review shrinks from an afternoon of exports to a few minutes. You can see which services drive revenue, which patients are overdue a visit, and how retention trends over time.

Pabau gives practices real-time dashboards covering appointments, revenue, patient retention, and staff performance, without a separate BI tool or a data team.

Healthcare BI isn’t reserved for hospital systems. Every practice with a calendar and a billing tool already has the raw material. Ignoring it shows up as unpaid claims, empty slots, and decisions made on gut feel.
The practices that get value from BI start small. They fix patient identifiers, pick five metrics, and give each one an owner. Enterprise tooling can wait until a question outgrows the reporting you already have.
Want that reporting without hiring a data team? Book a demo and we’ll walk you through the dashboards that matter most for your practice.

Want to know which reports to run first? Important medical practice management reports walks through eight reports worth running regularly.
Comparing platforms with reporting built in? Best medical practice management software compares 10 tools side by side.
Need a feature checklist before you buy? Essential practice management software features covers the 10 features worth checking first.
Is your no-show rate the first number to fix? How to calculate your patient no-show rate shows the formula and how to bring it down.
Business intelligence reports what happened and what’s happening now, through dashboards and standard reports. Healthcare analytics goes further, using statistics and modeling to explain causes or predict what comes next. Most practices need BI first, because predictions are only as good as the reporting data underneath them.
A healthcare BI analyst builds and maintains the reports and dashboards an organization relies on. Day to day, that means writing SQL queries, cleaning data, and checking figures against source systems. They also work with clinical and finance teams to define each metric.
Yes, for a while. Excel handles a few metrics well if someone exports the data on a fixed schedule. It breaks down once figures come from several systems, because manual merging invites duplicates. Spreadsheets of patient data also need the same access controls as any system holding PHI.
Common examples include a dashboard of no-show rates by time slot and a report of claim denials by payer. Comparing treatment outcomes across locations is another. Private practices also track revenue per service line and practitioner rebooking rates.
It can be, but compliance depends on how it’s set up, not on the tool alone. Any vendor handling protected health information needs a signed business associate agreement. You also need role-based access, audit logs, and encryption at rest and in transit.