Medication tracker template: Free PDF for clinicians and caregivers
A medication tracker is a form that records each medication a patient takes, whe...

2
Last Updated: Oct 12, 2026

Cardiac output is heart rate multiplied by stroke volume, or CO = HR x SV. Divide by 1,000 to report the answer in liters per minute.
Normal resting cardiac output is 4 to 8 L/min, and the body-size-adjusted cardiac index runs 2.5 to 4.0 L/min/m2.
The Fick equation, CO = VO2 divided by the arteriovenous oxygen difference, is the reference method when thermodilution is unreliable.
A cardiac index below 2.2 L/min/m2 is the recognized cardiogenic shock threshold, which cardiac output alone cannot flag.
Cardiac output is heart rate multiplied by stroke volume, reported in liters per minute. For example, a resting heart rate of 70 beats/min against a stroke volume of 70 mL/beat gives 4.9 liters per minute. In practice, normal resting output for an adult sits between 4 and 8 L/min.
In a catheterization lab or an intensive care bed, however, getting there means moving between three routes to the same number. So this guide walks through the CO = HR x SV relationship, the Fick derivation, and thermodilution at the bedside. It also covers the cardiac index, which corrects each of those figures for body size.
Published resting ranges disagree, and that matters before you read any of them. Hemodynamic reference tables give 4 to 8 L/min at rest, while the Cleveland Clinic puts a typical adult nearer 5 to 6. Critical care protocols write their escalation thresholds against the cardiac index instead, because it corrects for body size.
Cardiac output is the total volume of blood the heart pumps per minute, reported in liters per minute (L/min). According to the Cleveland Clinic, it is the primary indicator of cardiovascular performance. In fact, the figure reflects how well the heart meets the body’s oxygen demand, at rest and under stress.
For any clinician reviewing a cardiac biomarker reference alongside hemodynamic data, CO is the denominator for nearly every derived pressure and resistance calculation. Indeed, a single abnormal value rarely stands alone; it drives treatment decisions about fluid loading, vasopressor selection, and pacing strategy.
The equation in its simplest form is:
CO (L/min) = HR (beats/min) x SV (mL/beat) / 1000
Dividing by 1,000 converts milliliters to liters. So 70 beats/min against 70 mL/beat gives 70 x 70 / 1000, or 4.9 L/min.
Stroke volume is end-diastolic volume (EDV) minus end-systolic volume (ESV), so SV = EDV – ESV. A healthy left ventricle typically ejects 60-70% of its end-diastolic volume, a figure known as the ejection fraction. In turn, three physiological determinants govern SV:
The Fick equation for cardiac output uses oxygen as a tracer substance. Adolf Fick’s principle says uptake equals flow multiplied by concentration difference. An organ’s consumption of a substance therefore reveals the blood flow through it, given the arteriovenous difference. Specifically, applied to the whole circulation:
CO = VO2 / (CaO2 – CvO2)
Where VO2 is oxygen consumption (mL/min), CaO2 is arterial oxygen content, and CvO2 is mixed venous oxygen content.
As confirmed by Medscape eMedicine, this remains the reference method for cardiac output in catheterization laboratories where accurate VO2 measurement is possible.
The assumed Fick method estimates VO2 from body surface area, typically 125 mL/min/m2 for adults. As a result, this introduces error in patients with sepsis, thyroid disease, or significant anemia, where measured oxygen consumption diverges from the assumed value.
Similarly, teams running IV infusion protocols will find the same limits discussed in the IV therapy clinical monitoring guide.
Thermodilution is the most widely used bedside method for measuring cardiac output in intensive care. Cold or room-temperature saline goes into the right atrium through a pulmonary artery catheter. A thermistor at the catheter tip then records the temperature-time curve downstream.
Specifically, CO comes from the Stewart-Hamilton equation. A larger, slower curve means lower output, and a sharp, peaked curve means higher output.
The gold-standard label still holds at the bedside, because no other method returns a repeatable number that fast. Even so, it just needs reading against the rest of the clinical picture.
The ranges below come from established hemodynamic references, and they are not the only published figures. For instance, the Cleveland Clinic puts typical adult resting output nearer 5 to 6 L/min, inside the wider 4 to 8 band.
In other words, read a result against the whole clinical picture rather than against the range alone. Our guide on interpreting hemodynamic biomarkers covers how to report a borderline number without overpromising.
A cardiac output of 5 L/min reads differently in a 50 kg patient and a 100 kg patient. Therefore, the cardiac index corrects for body size:
CI = CO / BSA
Body surface area (BSA) comes from height and weight, most commonly through the Du Bois formula. A CI below 2.2 L/min/m2 is the recognized threshold for cardiogenic shock in clinical guidelines. Conversely, values above 4.0 L/min/m2 point to a hyperdynamic circulation, as seen in sepsis or hyperthyroidism.
CI is the preferred metric for serial monitoring because it removes body size as a confounding variable. In fact, those thresholds also sit closer together than the numbers suggest. Laid out on one scale, the whole clinical span runs from shock to hyperdynamic across roughly two units.
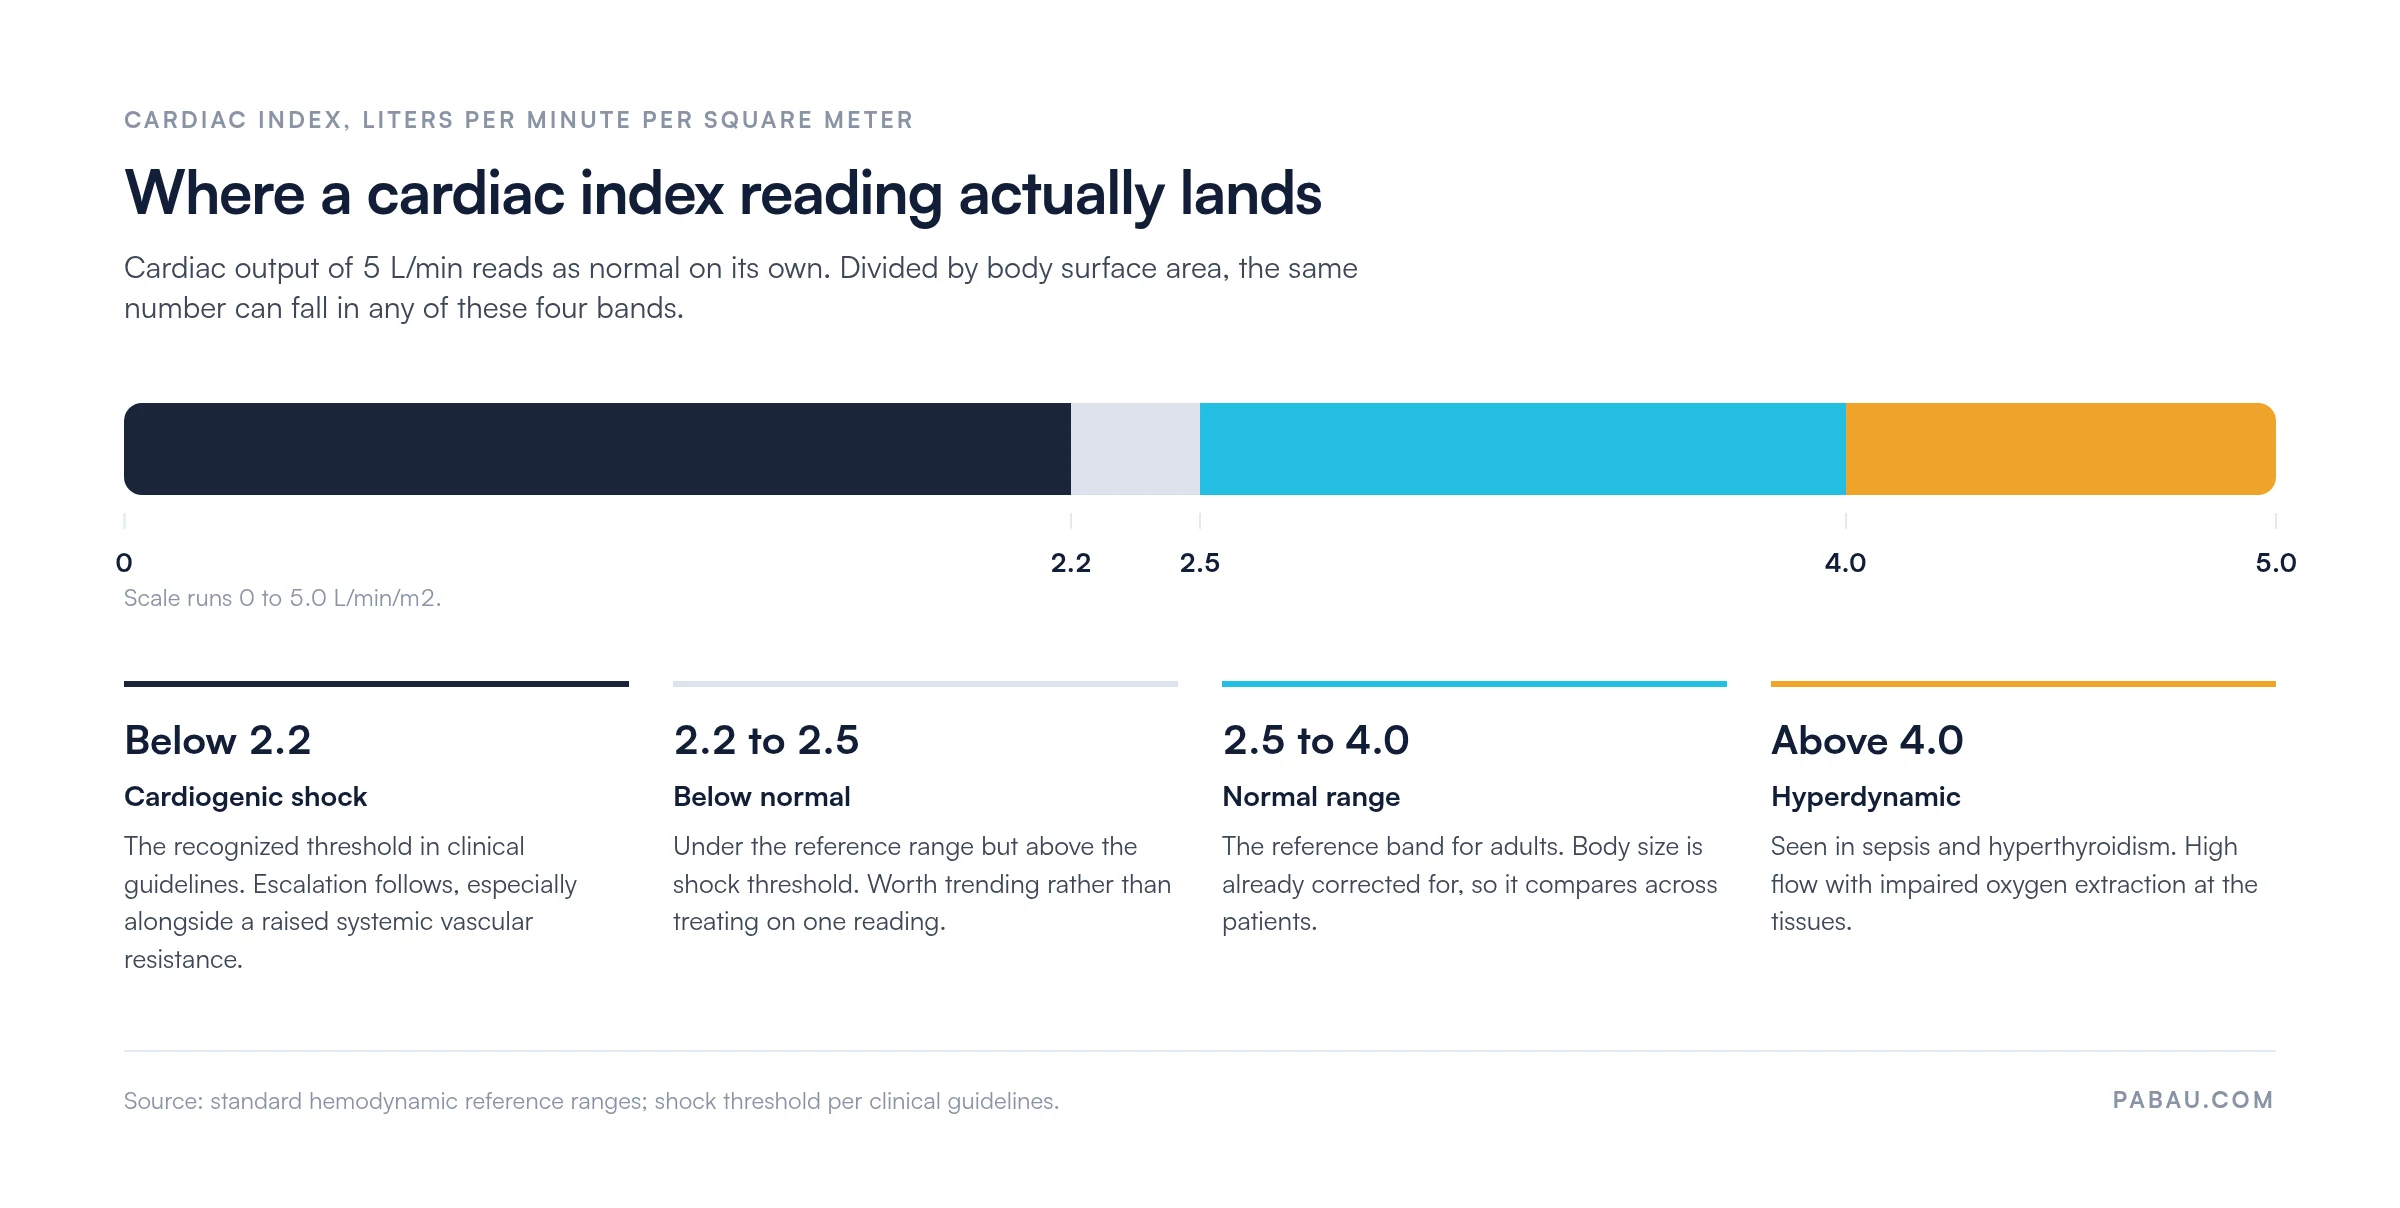
Track cardiac index trends over serial assessments rather than acting on a single reading. A CI that drops from 3.2 to 2.4 L/min/m2 across three measurements matters more than one borderline value. Document each measurement with timestamp, patient position, and the method used.
Both components of CO = HR x SV can be manipulated independently. Accordingly, choosing which lever to pull is the basis of hemodynamic management in critical care and cardiology.
Heart rate increases CO only up to a point. Beyond approximately 150 beats/min in adults, diastolic filling time shortens enough that SV falls, and CO may paradoxically decrease. This is why tachyarrhythmias can present as low-output states despite a rapid rate.
Once CO is measured, it anchors a family of derived hemodynamic parameters. For example, the Medscape cardiac formulas reference provides validated expressions for each. The most clinically important are:
SVR = (MAP – CVP) / CO x 80 is the most commonly used derived formula. Elevated SVR with reduced CO is the hemodynamic fingerprint of cardiogenic shock. Conversely, low SVR with high CO characterizes distributive states such as sepsis. A CI below 2.2 in the presence of elevated SVR triggers escalation decisions in most critical care protocols.
CO outside the normal range almost always indicates an underlying pathophysiological state. Therefore, the direction of abnormality and the accompanying hemodynamic profile guide management for teams in integrative medicine practice and cardiology alike.
A patient in early sepsis may present with CO of 9 L/min and SVR of 400 dynes/sec/cm5. Both values are abnormal, but the cardiac output equation alone would not flag the problem. Instead, context, trend, and derived parameters together build the clinical picture.
Measuring cardiac output is half the job. However, the other half is recording the result, linking it to the intervention that followed, and making it retrievable for the next clinician on shift.
Serial CO and CI readings belong in a structured patient record. Specifically, each one needs a timestamp, the method used, and a link to concurrent medications and fluid balance.
Good patient care management workflows treat hemodynamic data as one longitudinal dataset rather than a run of isolated observations.
Practice management software like Pabau holds that record in one place. For instance, Pabau’s structured patient records and clinical measurements tracking let cardiology and integrative medicine teams log serial values against a consistent patient timeline.
Paired with AI-assisted clinical documentation, clinicians dictate their assessment findings and get them structured automatically, which cuts transcription lag.

Effective EHR integration for hemodynamic data also closes the loop between bedside measurement and the billing, audit, and outcome tracking that follow. As a result, teams that have moved to digital records report fewer documentation lapses on pre-admission assessments.
Our overview of clinical forms and documentation explores that pattern. Likewise, for clinicians tracking where AI note-generation is already changing practice, the impact of AI scribes on patient care is worth reading alongside this guide.
Writing accurate, legally defensible hemodynamic notes is a skill in itself. Indeed, our guide on safer clinical note-writing covers the documentation principles behind both. They apply equally to a thermodilution result and a Fick-derived CO in a cath lab report.

Pabau gives cardiology and integrative medicine teams structured patient records, clinical measurements tracking, and AI-assisted documentation, so serial readings stay together between assessments.

CO = HR x SV is easy arithmetic and a poor decision rule on its own. The number that changes management is the cardiac index, because it is the one corrected for the patient’s size.
So pick a method, record which one you used, and trend the result. A CI of 2.4 on Monday means little until you can see Sunday’s 3.2 beside it.
Pabau’s clinical measurements tracking is built for that kind of longitudinal record, keeping serial CO and CI values retrievable in one place. If your team still spreads this data across disconnected systems, book a demo to see how Pabau fits a cardiology or integrative medicine workflow.

Need the Fick equation broken down step by step? Fick cardiac output walks through the formula with a worked example and a free downloadable worksheet.
Tracking ejection fraction alongside cardiac output? Our normal ejection fraction by age chart gives age-adjusted reference ranges for the other core hemodynamic metric.
Documenting a patient in cardiogenic shock? The decreased cardiac output nursing care plan template maps nursing diagnoses and interventions to low-CO presentations.
Cardiac output is calculated as CO = HR x SV. HR is heart rate in beats per minute, and SV is stroke volume in milliliters per beat. Dividing the result by 1000 converts the answer into liters per minute. A resting adult with HR 70 beats/min and SV 70 mL/beat lands near 4.9 liters per minute. That sits inside the normal range of 4 to 8 liters per minute.
Cardiac output is measured in liters per minute (L/min). Stroke volume in the equation is expressed in mL/beat, so it must be divided by 1000 to convert to liters before combining with heart rate. The cardiac index, which adjusts CO for body surface area, is expressed in L/min/m2.
The Fick equation states CO = VO2 / (CaO2 – CvO2). VO2 is oxygen consumption in mL/min, and the denominator is the arteriovenous oxygen content difference. It is most accurate when VO2 is measured directly via indirect calorimetry. By contrast, the assumed Fick method estimates VO2 from body surface area and is less accurate in patients with abnormal metabolic states.
Cardiac index (CI) is cardiac output divided by body surface area, or CI = CO / BSA. It corrects for patient size, making it more useful for comparing hemodynamic status across patients of different builds. Normal CO runs from 4 to 8 liters per minute, and normal CI from 2.5 to 4.0 L/min/m2. A CI below 2.2 L/min/m2 is a recognized threshold for cardiogenic shock.
Normal cardiac output is 4 to 8 L/min at rest in adults, the range used in most hemodynamic reference tables. Published figures differ between sources. For instance, the Cleveland Clinic gives 5 to 6 L/min for a typical adult at rest, and it reports peaks above 35 L/min in trained athletes during exercise. By contrast, values below 4 L/min suggest low-output states, while readings consistently above 8 L/min at rest suggest a hyperdynamic circulation.
Stroke volume is one of the two direct determinants of cardiac output in the CO = HR x SV equation. Any factor that reduces SV (increased afterload, reduced preload, decreased contractility) will proportionally reduce CO unless HR compensates. Conversely, interventions that increase SV (fluid loading in hypovolemia, positive inotropes) raise CO without changing heart rate.