GLP-1 diet plan
A GLP-1 diet plan is a structured eating framework for patients taking semagluti...

3
Last Updated: Oct 13, 2026
A waist-to-hip ratio chart sorts a patient’s waist-to-hip ratio (WHR) into low, moderate, or high risk, with separate cut-offs for women and men.
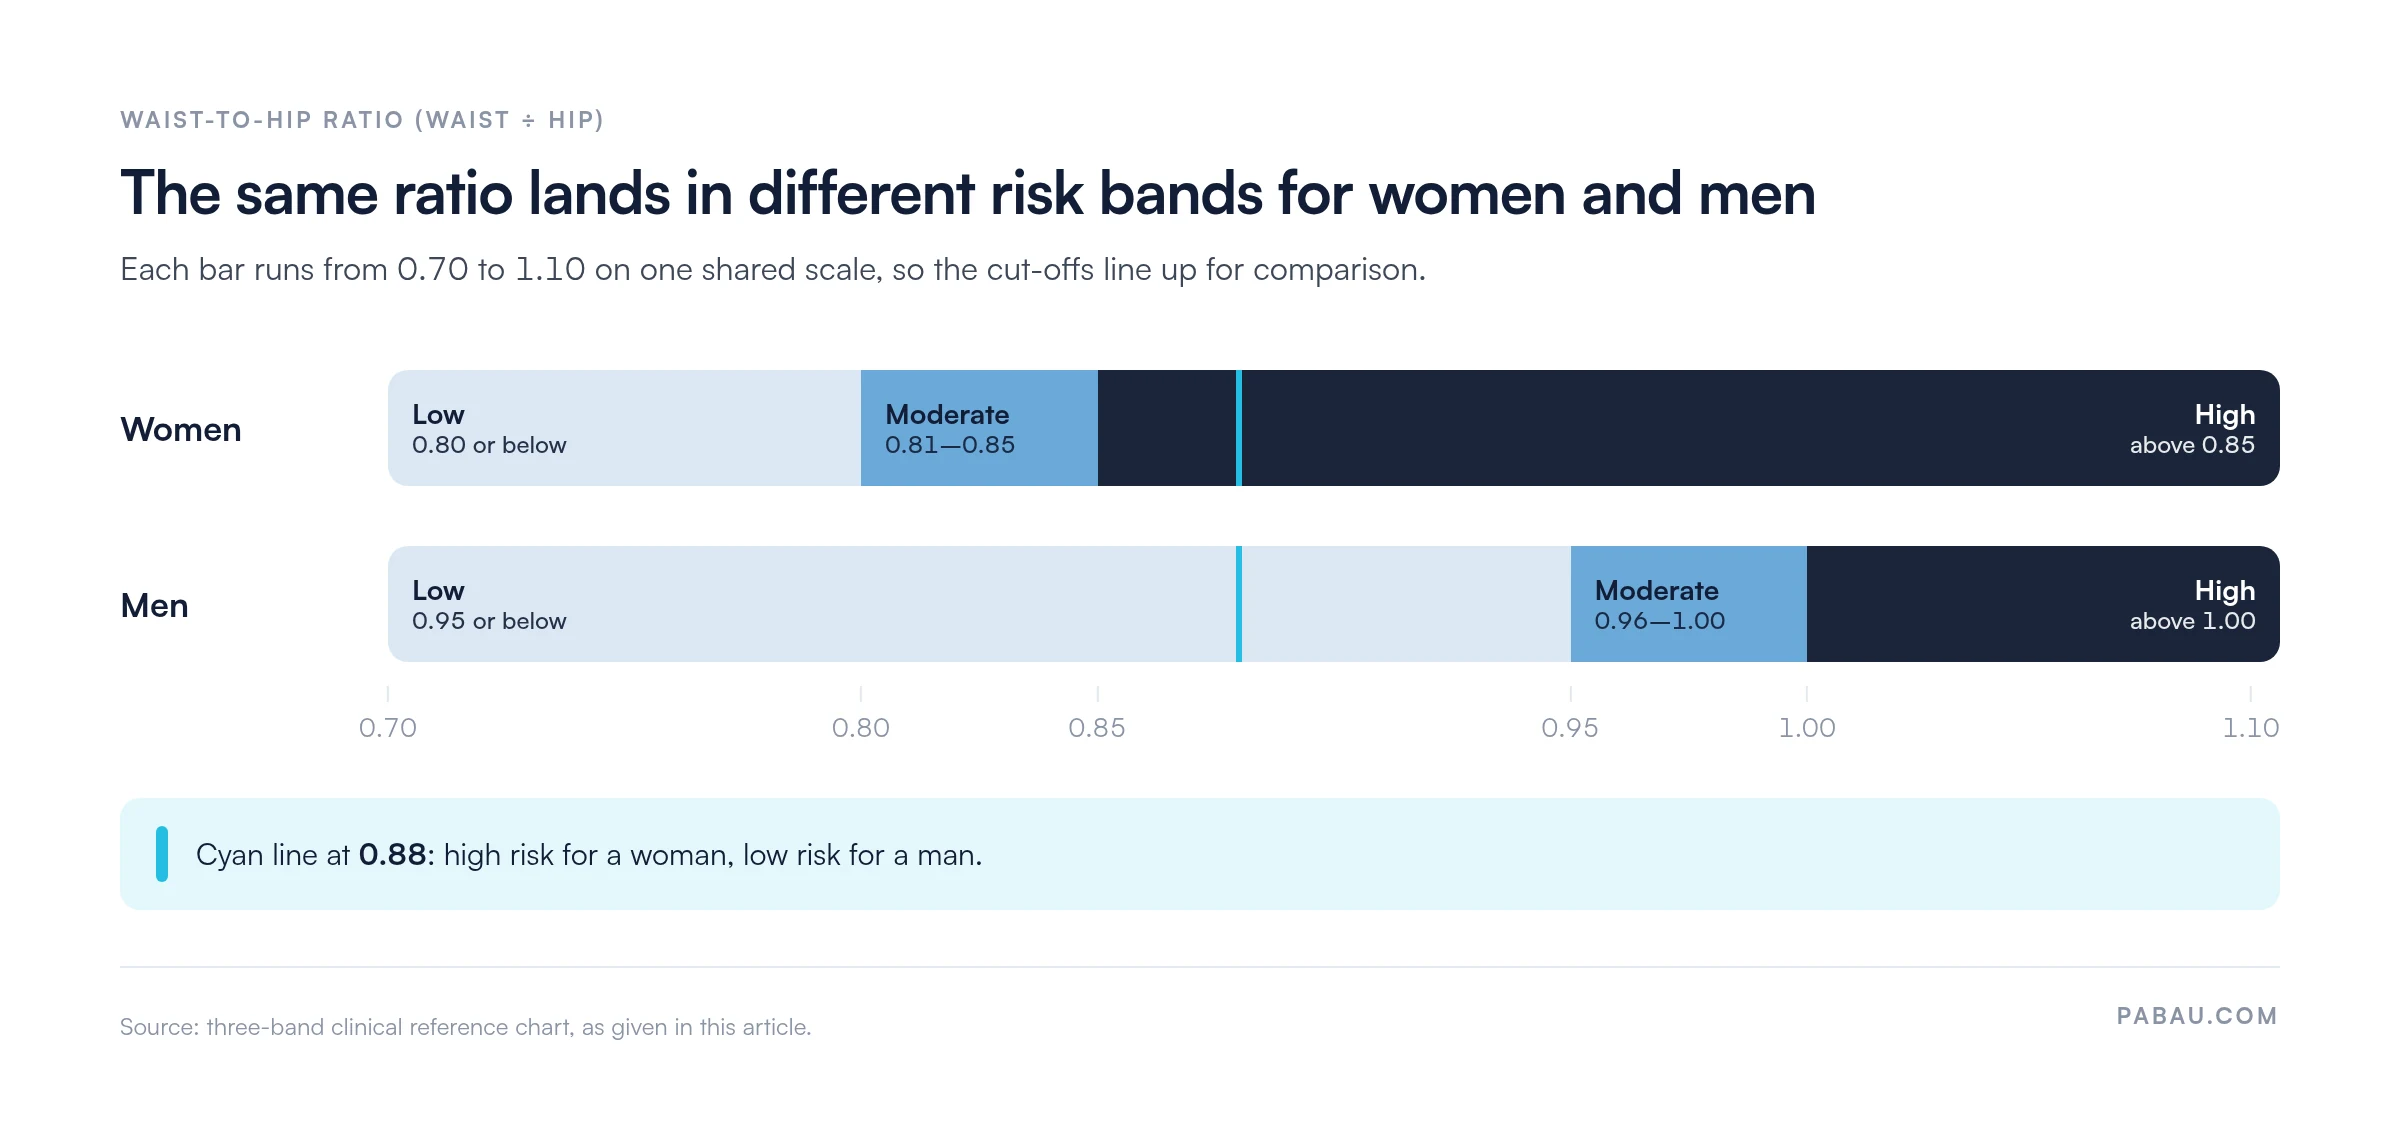
Divide waist circumference by hip circumference, then read the result against the chart. Women are low risk at 0.80 or below and high risk above 0.85. Men are low risk at 0.95 or below and high risk above 1.00.
The bands follow the commonly used clinical reference chart. The World Health Organization (WHO) uses a single cut-off instead. It flags substantially increased risk at 0.90 or above for men and 0.85 or above for women.
A high ratio means fat sits mainly around the abdomen, which predicts cardiovascular disease and type 2 diabetes better than weight alone.
A one-page clinical form with fields for patient details, blood pressure, fasting blood sugar, cholesterol, weight, height, and waist and hip circumference. It also covers measurement instructions, the WHR formula, and a clinician sign-off.
Download template
The waist-to-hip ratio chart classifies body fat distribution into low, moderate, and high risk bands, using sex-specific thresholds.
Measure the waist midway between the lowest rib and the iliac crest. Measure the hips at the widest point of the buttocks, keeping the tape horizontal.
Women are low risk at a ratio of 0.80 or below, and men at 0.95 or below. Higher ratios signal more central fat and metabolic syndrome risk.
WHR works best alongside BMI, because a patient with a normal BMI can still carry high-risk abdominal fat.
The downloadable chart gives you one place to record the measurements, the ratio, and related health markers at each visit.
WHR is waist circumference divided by hip circumference, both taken in the same unit. Most results fall between 0.6 and 1.2. A higher number means more of the patient’s fat sits around the abdomen. A lower number means it’s spread more evenly toward the hips and thighs.
That distribution matters. Central adiposity, or fat stored around the waist and organs, predicts cardiovascular disease and type 2 diabetes better than overall body weight. A patient can have a normal BMI and still carry high-risk visceral fat. Another patient can carry extra weight in a less harmful pattern. WHR captures body shape, which BMI can’t.
A reliable WHR depends on measuring at the same landmarks every time. The WHO expert consultation report sets out the protocol, which comes down to three steps:
The ratio has no unit, so inches work just as well as centimeters, as long as both measurements use the same one. The most common error is measuring at the narrowest point of the waist instead of the anatomical midpoint.
That understates abdominal circumference and produces artificially low ratios. Use the rib-to-iliac-crest landmarks at every visit so repeat readings compare like with like.
The chart sorts WHR results into three risk categories. Thresholds differ by sex because hormones shape where men and women store fat, so the point where risk rises differs too.
These thresholds come from epidemiological studies linking WHR to cardiovascular disease, type 2 diabetes, and metabolic syndrome. Above the low-risk band, consider extra cardiovascular screening, lifestyle counseling, and metabolic testing where clinically appropriate.
Because the cut-offs differ, one ratio can mean two different things. The chart below puts both sets of bands on one scale.
A high WHR means a large share of the patient’s body fat sits in the abdomen, much of it as visceral fat around the organs. This pattern is linked to cardiovascular disease, hypertension, type 2 diabetes, and metabolic syndrome.
Visceral fat behaves differently from fat stored on the hips and thighs. It releases inflammatory markers and reduces insulin sensitivity, which drives wider metabolic problems.
Patients with a high WHR often feel well, so the chart works as an early warning. It gives you a reason to start a prevention conversation before complications develop.
Three body composition measures turn up in clinical practice: BMI, WHR, and waist-to-height ratio (WHtR). Each one captures something different.
Use WHR alongside BMI and other cardiovascular risk markers, such as blood pressure and the lipid profile. A patient with a normal BMI but a high WHR deserves the same attention to metabolic risk as one with an elevated BMI. Our guide to body mass index assessment covers the BMI side of that pairing.
Take waist and hip measurements early in the appointment, using the protocol above. Calculate the WHR and match it to a risk band on the chart. Then explain the result in plain language.
For example: “Your measurements show you store fat mainly around your abdomen, which carries some cardiovascular risk. Let’s talk about the changes that help.”
Enter the waist and hip measurements, the calculated WHR, and the risk band in the patient’s clinical record. That entry becomes the baseline for every later visit. A weight loss measurement chart keeps waist, hip, and weight readings side by side as you track progress.
A high WHR calls for a closer metabolic assessment. Depending on the patient’s age and comorbidities, consider a lipid panel, fasting glucose, or a cardiovascular risk calculator. A basic metabolic panel template helps you record glucose results next to the WHR.
Then agree diet, physical activity, and weight management goals with the patient. For moderate-risk patients, repeat the measurement every 6 to 12 months to track progress.
Many practices still write waist and hip readings on a paper chart or a spreadsheet, then work out the ratio by hand. Comparing this visit with the last one means digging through old notes, and a slow upward trend is easy to overlook.
In Pabau, the practice management platform we build, measurement tracking stores waist, weight, BMI, and other numeric readings against the patient record. Each value is plotted across visits, so you and the patient can see which way the numbers are moving.
If you run a weight management service, Pabau’s tools for weight-loss clinics also handle booking, consultation notes, and follow-up reminders in one system. Patients due a repeat WHR check get reminded, so your front desk doesn’t have to chase them.

Pabau stores waist, weight, and BMI readings against the patient record and plots them across visits. You spot progress or a worsening trend without digging through paper charts.

A WHR takes two tape measurements and a minute of arithmetic, yet it flags the patients whose BMI hides abdominal fat. That makes it worth adding to every metabolic or weight management consultation, including ones where weight isn’t the presenting concern.
Measure the same way every time, and read the result against the patient’s own sex-specific band. Record it, so the next reading has a baseline to beat. Remember the limit, too. WHR flags risk but doesn’t diagnose anything, so pair a high result with blood tests and a full cardiovascular assessment.
Book a demo to see how Pabau plots each patient’s body measurements across visits, so every follow-up starts from the numbers.

Need the BMI side of the picture for female patients? Women’s BMI chart sets out the BMI ranges to read alongside a WHR result.
Assessing a male patient? Men’s BMI chart lists the BMI categories to pair with his waist-to-hip ratio.
Patient needs a plan to reduce abdominal fat? Meal plan to lose belly fat gives you a ready-made eating plan to hand over after a high WHR result.
Ordering a lipid panel after a high WHR? Cholesterol level chart by age helps you read the results against age-specific ranges.
Building a care plan for a patient with obesity? Obesity nursing care plan structures goals, interventions, and evaluation in one template.
A healthy WHR is 0.80 or below for women and 0.95 or below for men. Ratios in this band carry the lowest cardiovascular and metabolic risk on the chart. Values above it point to more central fat and may call for lifestyle or clinical intervention.
For patients in treatment for weight loss, metabolic conditions, or cardiovascular risk, measure WHR every 3 to 6 months to monitor progress. For general screening, once a year is enough. More frequent checks add little unless the patient is in an active weight management program.
Neither is better on its own, so use them together. WHR shows how body fat is distributed, while BMI only relates weight to height. A patient with a normal BMI but a high WHR carries metabolic risk that BMI alone would miss. A muscular athlete may have a high BMI but a low WHR and low cardiovascular risk.
Start by explaining what the result means. Fat is concentrated around the abdomen, which raises cardiovascular and metabolic risk. Order baseline tests, such as a lipid panel, fasting glucose, and blood pressure, to gauge overall risk. Then recommend evidence-based lifestyle changes, including a Mediterranean-style diet, 150 minutes of aerobic activity a week, resistance training, and stress management. If medication is indicated, prescribe within your scope of practice and local guidelines.
Men and women have different thresholds, with low risk at 0.95 or below for men and 0.80 or below for women. Hormones explain the split. Estrogen favors fat storage on the hips and thighs, while testosterone favors the abdomen. The thresholds mark where health risk begins for each sex.
No. WHR needs direct measurements of waist and hip circumference, and you can’t derive it from BMI, height, or weight. That’s why the chart relies on a tape measure and the anatomical landmarks described above.