Positive self-talk worksheet
A positive self-talk worksheet is a structured therapy tool for catching a negat...

1
Last Updated: Oct 13, 2026

A weight loss measurement chart records waist, hip, chest, arm and thigh circumference at every visit, so progress shows even when weight stalls.
Waist circumference carries the most clinical weight, and NHLBI puts the raised-risk line at 40 inches for men and 35 for women.
Measure every two weeks in most programs, at the same time of day, using the average of three readings per site.
Practice management software like Pabau stores each set of readings in the patient record, instead of a paper chart that gets filed and lost.
A printable chart with dated columns for weight, waist, hips, chest, arms, thighs, body fat percentage and BMI. It also leaves space for baseline notes and milestone dates, so a whole program fits on one sheet.
Download templateA weight loss measurement chart tells you whether a patient is losing fat or losing water. The scale cannot separate the two, because it only reports total mass. Circumference readings can, because they show where the body is changing and how fast.
Waist circumference is the number to watch most closely, since central fat carries the clearest health risk.
Get the tape technique right and the chart becomes a treatment tool. Sloppy placement turns it into a source of arguments, because the readings move for reasons nobody in the room can explain.
The sections below cover what to record and how to take each reading so the numbers stay comparable.
A weight loss measurement chart records circumference at fixed sites, plus weight, body fat percentage and BMI, on every visit of a program. Weight alone cannot tell you what changed. Circumference can, because fat and muscle sit in different places and move at different rates.
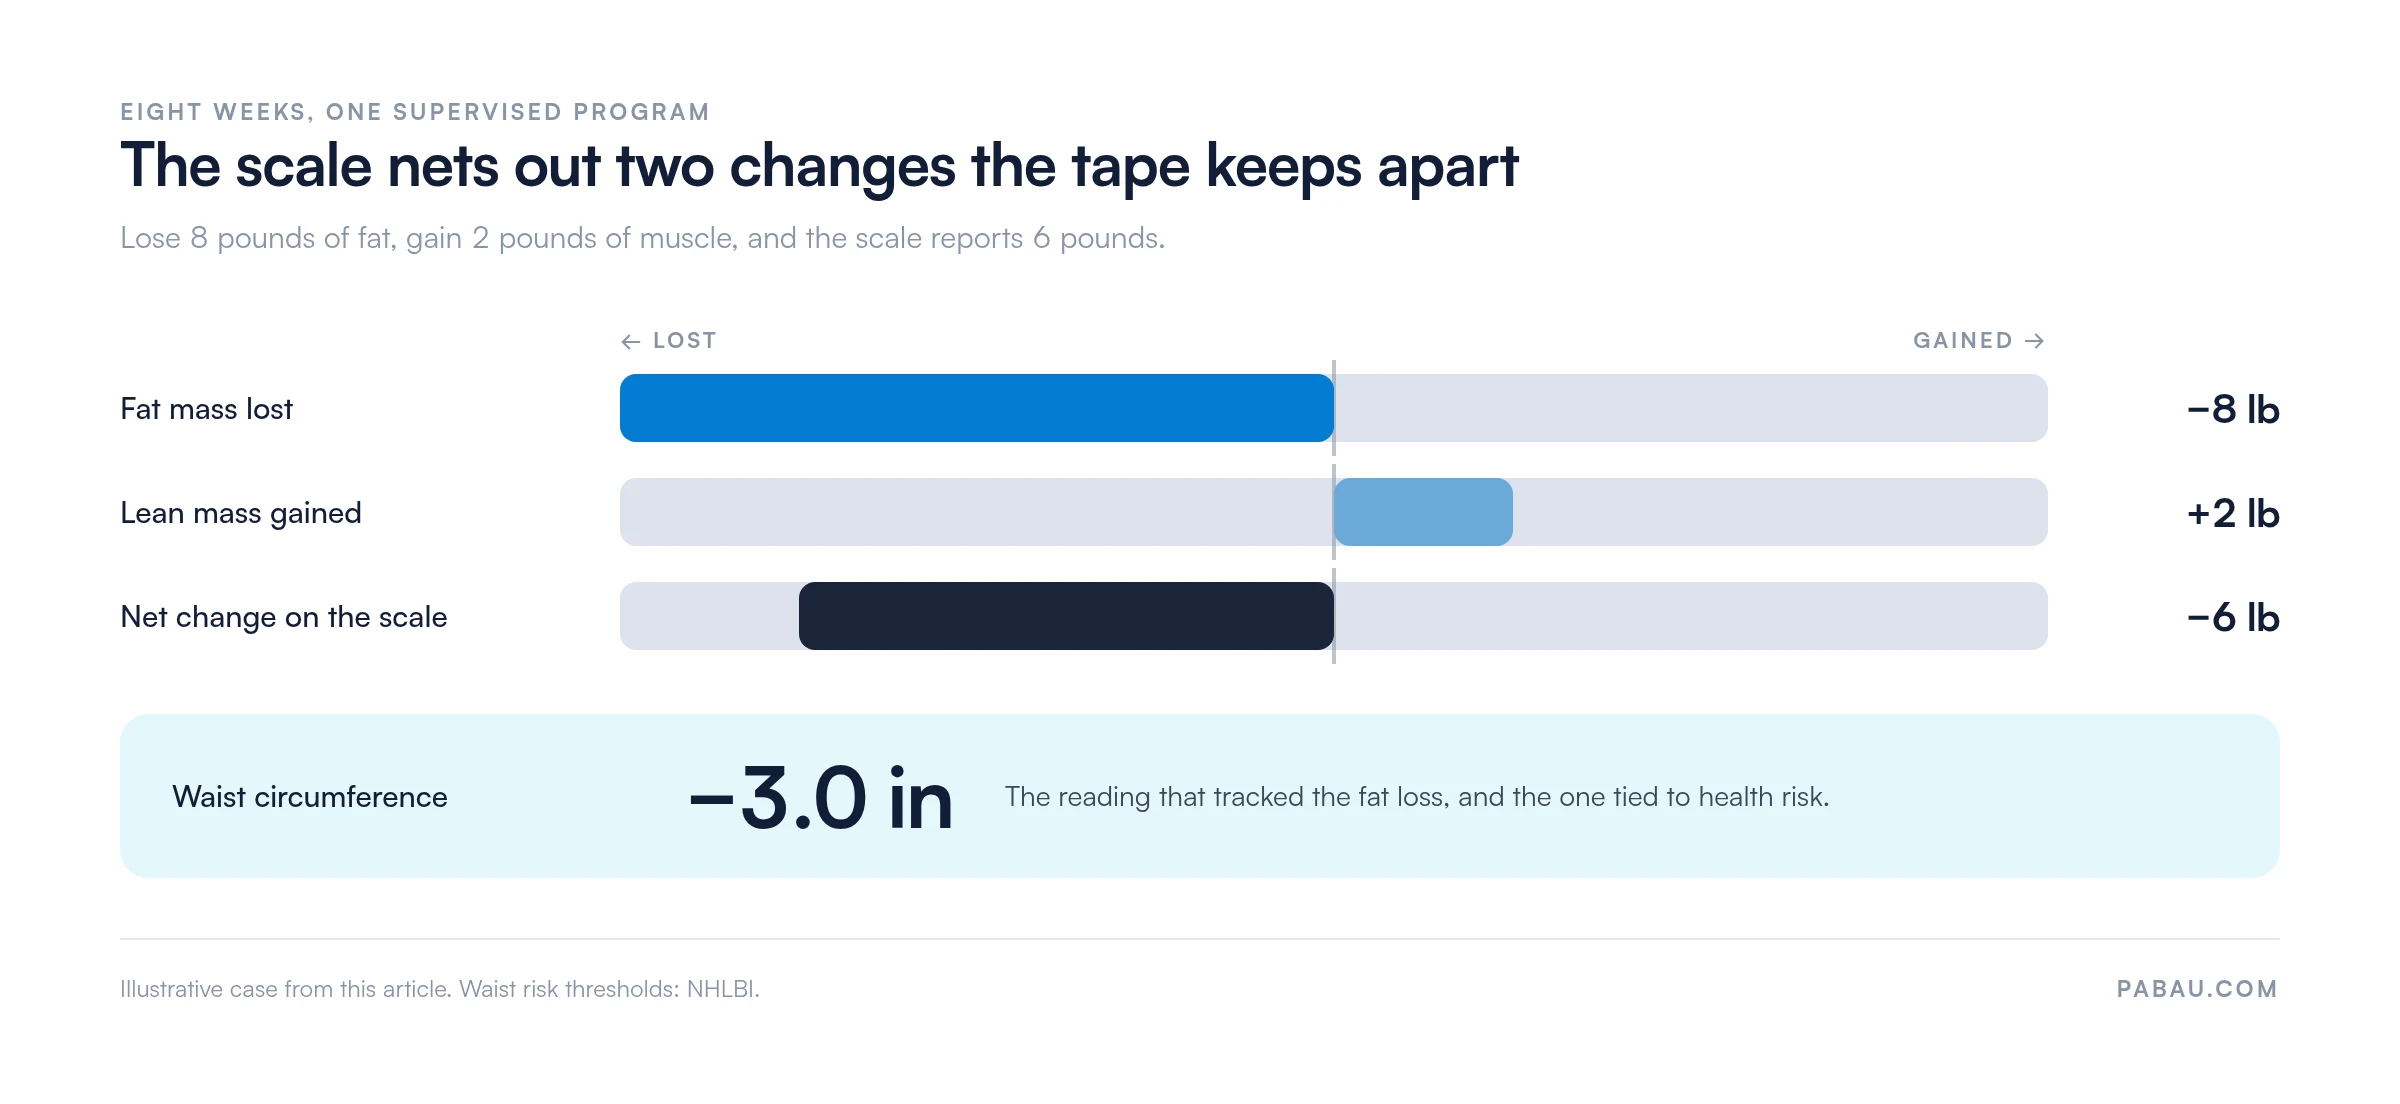
Take a patient eight weeks into a supervised program. She loses 8 pounds of fat and adds 2 pounds of muscle from resistance training. The scale shows 6 pounds, which reads like a middling result.
Her waist is down 3 inches, which reads like a very good one. Only the chart carries that second story. Set the two readings side by side and the divergence is hard to miss.
The same logic applies to patients on GLP-1 medication. Weight often falls quickly, and a share of what leaves is lean mass. Arm and chest readings flag that early, while there is still time to raise protein intake or add resistance work.
Eight fields cover a full program without turning each visit into a research protocol. Each one answers a different question, so drop any of them and you lose an answer.
Keep the readings in structured patient records rather than a printed sheet. Then the previous set is on screen while the patient is still in the chair, and the comparison takes seconds.

Repeatability beats precision on a measurement chart. A reading that is a quarter inch off every time still shows the trend correctly.
Move the tape 2 inches up from last month, though, and you invent a trend that never happened. So follow the same six steps at every visit.
Write the numbers straight into digital forms at the point of measurement. Reading them off a paper slip an hour later is where transcription errors get in.

Every two weeks suits most weight loss programs. Two weeks is long enough for change to clear the noise. It is also short enough to catch a plateau while you can still act.
Daily measuring rarely helps. Hydration, sodium, digestion and the menstrual cycle all move circumference by a fraction of an inch. A patient measuring every morning sees mostly static. Weekly readings should also land on the same weekday and roughly the same hour.
Whatever interval you pick, record the date and time with the numbers. Practices running structured programs treat those two fields as part of the reading, and so does the weight loss clinic software behind them.
Men and women need different thresholds, because essential fat and fat distribution differ. Two reference points do most of the work in a weight loss program.
The waist figures come from NHLBI guidance on weight and health risk, and the ratio cut-offs from the WHO expert consultation on waist circumference.
Two cautions before you print a generic chart. Lower waist cut-offs apply to some populations, including South Asian patients, so check the guidance for the people you treat.
Body fat reference ranges also differ between devices. That is why the chart above points you at the range your own scale or caliper publishes.
Most chart failures are mechanical. The numbers stop being comparable, so the trend stops being readable.
These five problems cause most of it:
Measuring takes about three minutes once the protocol is settled. Where practices lose time is the conversation afterwards, so give it a shape.
Measure all eight fields, then write down the landmarks you used. Explain that the waist number matters most, and that weight will sometimes disagree with it. Setting that expectation on day one prevents most later disappointment.
Measure first, then show the trend on screen. If the waist is down and weight is flat, say so plainly and hold the protocol. That pattern usually means fat loss with muscle gain, and changing course would waste it.
Check the technique before you change the treatment. Look at the dates, the times and who took each reading. If the method holds up, then adjust intake, add resistance work, or review medication with the prescriber.
Follow-up appointments are the easiest part of a program to lose. Automated workflows can send the next appointment reminder on your chosen interval, so a two-week program does not quietly become a six-week one.
Most practices start with a printed chart. It works for a visit or two, then it gets filed, photographed, or left in a treatment room. By month three the tape readings live in three places and nobody trusts the trend.
Pabau, our practice management software, stores each reading as a field on the patient record instead.
Staff enter waist, hips, chest, arms, thighs, weight and body fat percentage through measurements tracking, and the platform charts the change over time. The previous set is on screen while the patient is in the room, which is when a trend changes a conversation.
Around that, digital forms collect the intake history and automated workflows chase the next appointment on your interval. The patient portal lets patients follow their own progress between visits.
Every Pabau subscription includes every feature, so none of that sits behind a higher tier.

Pabau records weight, circumference and body fat readings as structured fields in the patient chart, then reminds patients when the next set is due. Staff open the file and see the trend, so nobody hunts for last month’s numbers.

A measurement chart earns its place the first time a patient’s weight stalls and their waist keeps falling. That is the visit where a tape measure saves a program, and where a scale would have talked you both out of it.
The work sits in the habits around the chart. Measure the same way every time, date every entry, and keep the readings where both of you can see them. Download the template above, agree one protocol with your team, and the numbers will start telling you something you can act on.
If those readings still live on paper, that is the next fix. Book a demo to see how Pabau keeps measurement history, forms and follow-ups on one patient record.

Running a bariatric follow-up program? Gastric sleeve weight loss chart template tracks post-surgery milestones on the same measuring schedule.
Need a way to mark progress when the scale stops moving? Weight loss reward chart turns non-scale wins into something a patient can see.
Setting a baseline at the first visit? Height weight chart covers the height, weight and BMI side of intake.
Building the paperwork around the program? New patient weight loss intake form template collects history, medications and goals before day one.
Comparing systems to hold all of this data? Top 7 weight loss clinic software in the US reviews the platforms weight loss practices shortlist.
That varies by patient, and genetics drives most of it. Many people see the waist respond first, because visceral fat is metabolically active. Others hold the waist and lose from the chest or thighs. Record every site, so you can show progress somewhere even when the waist stalls.
No guideline sets a target in inches, so read the tape against weight. Steady loss of 1 to 2 pounds a week is the usual clinical rate. When that holds, the waist tends to follow, although the timing differs by patient.
They are good enough for trends, not for absolute numbers. Bioimpedance readings swing with hydration, food and skin temperature. Keep one device, one time of day, and read the direction of travel rather than the exact percentage.
Treat the chart as part of the medical record, then follow your state retention rule. That commonly runs six to ten years for adults, and longer for minors. Readings held in the patient record are far easier to produce on request.
Take weight only, and note the refusal in the record. Some patients decline after weight-related distress or an eating-disorder history. Offer clothing fit or progress photographs instead, then revisit the tape at a later visit.