CRM for chiropractors: how to manage patients, bookings and marketing
A CRM for chiropractors is a patient relationship management system built around...

Last Updated: Oct 13, 2026

Patient experience metrics are countable events such as wait times, survey scores, no-shows, and review ratings, not general impressions of care.
Net Promoter Score, no-show rate, and retention rate are the three a private practice should put in place first.
A benchmark only earns its keep once you pair it with a warning threshold and a named first fix.
Hospital frameworks like HCAHPS assume a scale a four-room practice will never have, so the ranges here are private-practice ranges.
Practice management software like Pabau sends the surveys on checkout and calculates the operational metrics from your booking data.
Patient experience metrics are the numbers that tell you why a patient rebooked, or quietly didn’t. Patients rarely announce that they are leaving. There is no complaint, no confrontation, and no next appointment.
These metrics turn that silence into countable data: wait times, survey scores, no-show rates, review ratings. Track three of them properly and you will see a retention problem months before it reaches your revenue. Track none and you are guessing.
Below are the seven worth tracking in a private practice, the range to aim for, and the fix each bad reading points to.
Patient experience metrics are quantifiable data points that record what happened to a patient at each stage of care. Did they wait eight minutes or 35? Did they rebook? Did they leave a review?
Measuring patient satisfaction tells you how the visit felt. Experience metrics tell you what produced that feeling.
For a private practice, those events carry direct financial weight. A 5% improvement in patient retention can raise profits by 25% to 95%, according to research from Harvard Business Review.
Keeping an existing patient costs a fraction of winning a new one. Yet the marketing budget usually dwarfs whatever a practice spends on understanding why patients leave.
Reputation is the second lever. Google ratings, NPS results, and survey scores shape which practice a prospective patient books with.
That weighs heaviest in aesthetics and wellness, where one peer recommendation can outperform a month of paid ads.
The two terms get used interchangeably, and the confusion changes what you do with the data. One tells you where the process broke. The other tells you how the patient felt about it.
Programs that work run both. Operational metrics point at the broken step. Satisfaction scores tell you whether patients noticed. Run one without the other and you are reading half the page.
You don’t need all seven running on day one. Between them they cover the four stages where a private practice loses people: booking, waiting, the visit itself, and the follow-up.
Net Promoter Score comes from a single question. It asks: “On a scale of 0 to 10, how likely are you to recommend this practice to a friend or family member?” Nines and tens are Promoters. Sevens and eights are Passives. Zero to six are Detractors.
Subtract the percentage of Detractors from the percentage of Promoters, per the original Bain & Company NPS methodology.
Healthcare benchmark: Press Ganey’s annual benchmarking data puts the median for healthcare organizations between 58 and 72. Aesthetic and wellness practices usually sit higher, around 70 to 85, because the service is elective and relationship-driven. A score under 40 deserves a look this month, not next quarter.
How to collect it: one SMS sent within two hours of checkout gets the strongest response rate. Leave it 24 hours and responses can fall by up to 40%.
CSAT asks a patient to rate one interaction on a 1 to 5 or 1 to 10 scale, right after it happens. It is fast and transactional, which makes it good at isolating a single weak step.
The CAHPS survey system, published by the Agency for Healthcare Research and Quality (AHRQ), goes deeper. It uses validated question sets covering communication, responsiveness, and care coordination.
CAHPS is mandated for US hospitals reimbursed by Medicare under the HCAHPS program. A private practice can skip it. Borrow the question categories anyway, because they surface problems that a “rate us out of five” box never will.
A ready-made patient satisfaction survey gives you a starting set to adapt rather than writing one from scratch.
Patient Effort Score, or PES, measures how hard a patient had to work to get one job done. Booking an appointment. Reaching their records. Getting an answer to a question. Lower is better.
Research from Gartner and CEB found that reducing customer effort builds loyalty more reliably than trying to exceed expectations.
In an elective practice, PES is the most revealing of the seven. A patient who struggled to book, got vague pre-care instructions, or had to chase their own results will score high effort. They will also book somewhere else next time, even when the treatment itself was excellent.
Most of that effort piles up at the booking step, so start there. Online booking software takes out the phone tag and the voicemail chain that push the score up in the first place.
Wait time is the most widely tracked experience metric, and it hides two separate measurements. Time-to-appointment is the days between a patient’s request and the slot they get.
In-clinic wait time is the minutes between check-in and being seen. A practice can be excellent at one and dreadful at the other.
A no-show is rarely simple forgetfulness. A patient who felt rushed, found rescheduling painful, or never got a reminder is far more likely to skip the appointment. Industry estimates put the annual cost of missed appointments to US medical practices at around $150 billion.
Formula: no-show rate = (missed appointments / total scheduled appointments) x 100. A rate above 10% points at a communication or scheduling problem rather than unreliable patients.
Two-step reminders do most of the work here. The one at 48 hours gives the patient time to move the appointment, which saves the slot. The one at two hours catches whoever simply forgot.
Retention rate is the share of patients who come back within a set period, usually 12 months. It is the downstream result of the six metrics above.
Practices with strong NPS, short waits, and low no-show rates keep more patients, and the causation runs in that direction.
Formula: retention rate = ((patients at end of period – new patients acquired) / patients at start of period) x 100. A private practice usually targets 60% to 80% a year. Aesthetic practices often run 70% to 90%, because repeat-treatment protocols bring people back on a schedule.
Google, Trustpilot, and platform ratings are patient experience metrics that face outward. Someone reading them is judging your experience quality before they have met you.
In aesthetics and wellness, that judgment often drives more bookings than advertising does.
Track the average rating and the review count monthly. Then track your response rate, which matters more. A practice that replies to 80% of its reviews, good and bad, reads as attentive and accountable.
Online reputation management tools send the request and flag a new review the day it appears.
Most published benchmarks come from hospital data: HCAHPS results, CMS mandates, large-scale CAHPS programs. A four-room practice operates in a different world.
The ranges below are the ones aesthetic and wellness practices tend to hit when the experience is working.
This is a process you run, not a survey you send once. Five steps take a practice from nothing to a monthly review it will keep doing.
Automation is what keeps this alive past month three. Manual sends rarely reach the response rate you need. There are better ways of capturing patient feedback than a clipboard at the front desk.
Before you turn any of it on, settle five questions:
Four failures turn up again and again once a practice starts measuring. Each is cheap to avoid and expensive to discover a year in.
Hospital frameworks do not scale down. CMS-set NPS floors, HCAHPS mandates, and large CAHPS programs assume a size a small practice will never reach. Picture an injector with four rooms, or a physical therapist with 180 active patients.
The relationships are different too. They run longer, they are more personal, and they rest on trust. A hospital patient annoyed by a wait comes back anyway, because there is nowhere else to go. An aesthetics patient books with the practice down the street.
What holds the numbers together at this size is the effort-satisfaction-loyalty chain. Low effort at booking and check-in produces higher satisfaction scores. Higher satisfaction produces retention and referrals. Break one link and NPS drops within two or three appointment cycles.
Run a quarterly experience audit on your three worst NPS months. Pull the no-show data, the average wait time, and the staff assignment for each of those months, then look for overlap. Usually one pattern explains most of the low scores. It might be a single day’s scheduling model, one bottleneck at check-in, or one practitioner who consistently runs over time.
Data you never act on is noise with a spreadsheet attached. The practices that improve fastest treat these numbers as a weekly operational signal rather than a quarterly reporting exercise.
Every bad reading points at a specific workflow. A high no-show rate is a reminder problem. A low PES on booking is a friction problem. A low CSAT on communication is a pre-care or follow-up problem.
The table below pairs each warning threshold with the move to make first.
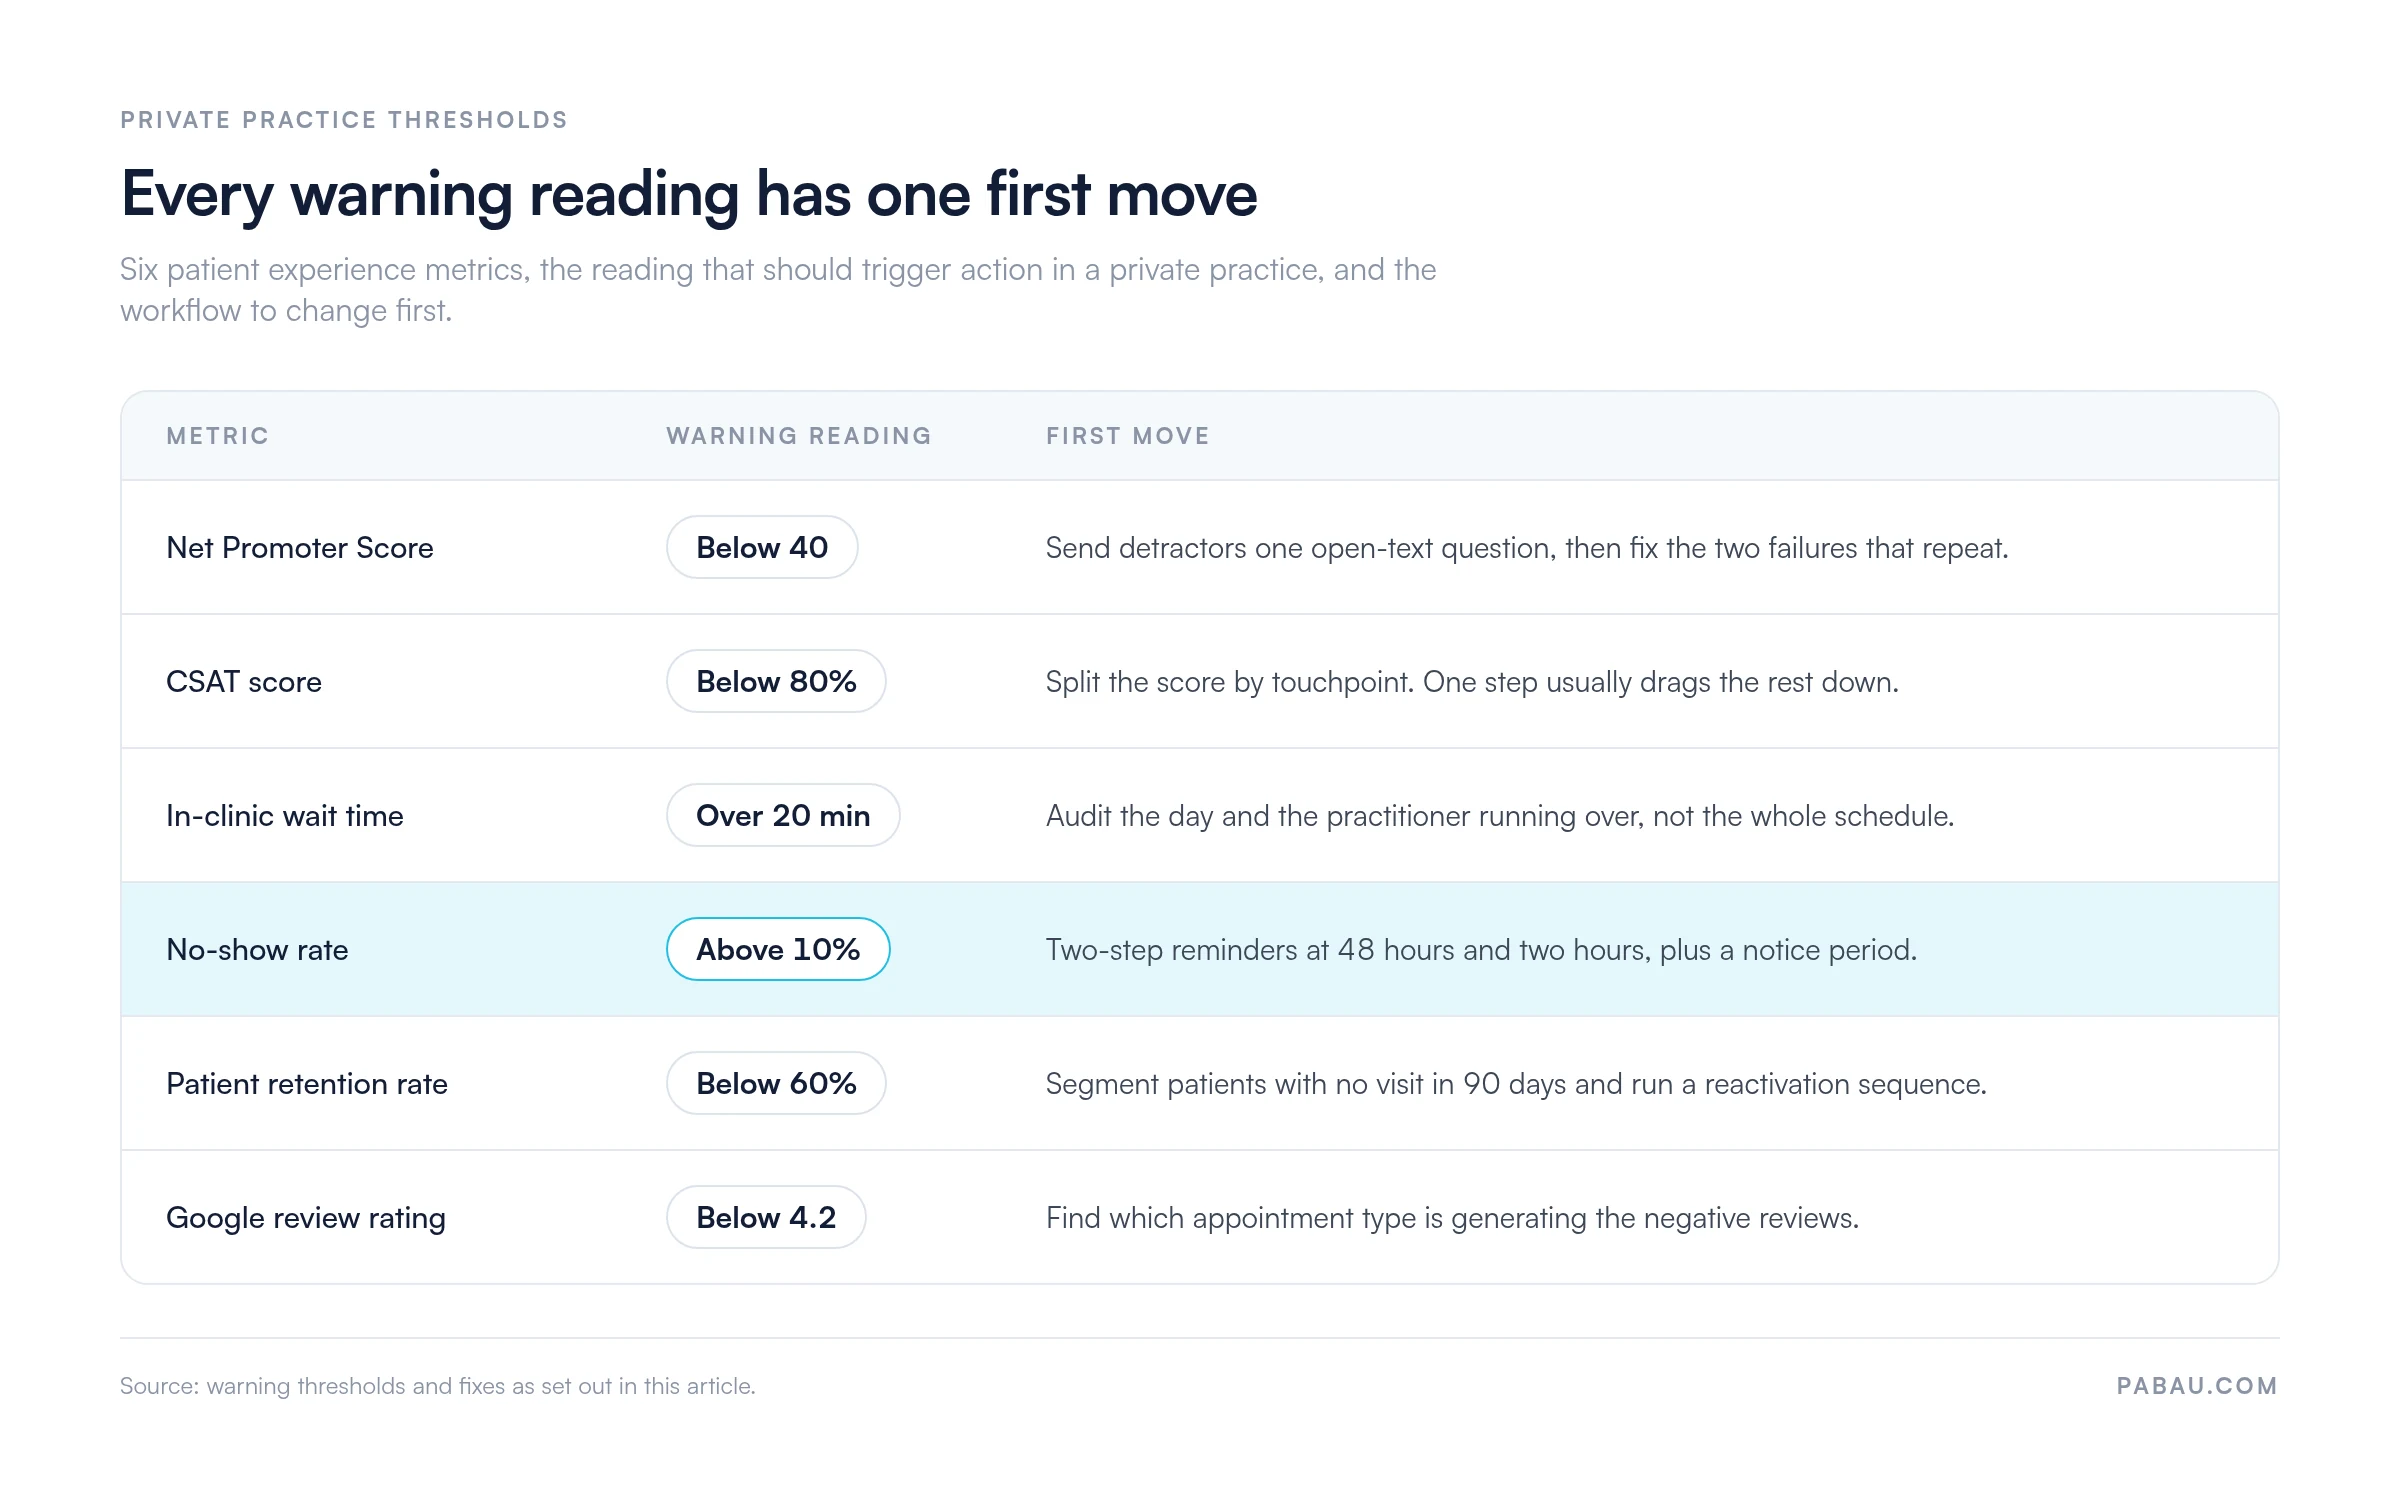
Take the retention row as a worked example. Say a practice is sitting at 54%. It pulls a list of patients with no visit in 90 days, finds 340 of them, and sends a two-message reactivation sequence. Even a 6% response brings back 20 patients. At an average visit value of $180, that one list is worth about $3,600 before anyone changes a single workflow.
Consistency does more for the score than any single fix. Review the numbers monthly and give each metric one owner. That beats an annual satisfaction survey and a year of wondering why the score never moves.
Manual tracking is what kills these programs. A practice manager who exports spreadsheets, cross-references three systems, and calculates NPS by hand will stop inside 90 days. The measurement dies quietly, and so does the improvement plan attached to it.
Practice management software like Pabau closes that loop inside the appointment workflow instead. When a patient checks out, the post-appointment survey sends itself, with no action from reception.
NPS and satisfaction scores land in Pabau’s built-in reporting, where you can see the aggregate score, the trend, and the individual responses in one view.
The operational half calculates itself. No-show rate, wait time, and retention rate come straight from your scheduling data, so there is no separate analytics setup to configure.
Automated reminders and review requests run off the same booking record, which means the metric and its fix live in one system rather than two.
Every Pabau subscription includes the reporting you need to run all seven metrics above. Insights Plus, an additional paid add-on, sits on top for practices that want to slice the data further.

Pabau sends the post-appointment survey on checkout and calculates no-show, wait time, and retention rate from your own booking data. Book a demo to see the setup for your practice.

The practices that get this right are not the ones with the biggest dashboard. They are the ones that picked three numbers, gave each one an owner, and looked at them every month without fail.
So start narrow. NPS, no-show rate, and retention rate will tell you most of what you need to know about whether patients are coming back. Add PES and review scores once the first three run without anyone having to remember them.
If you would rather the surveys sent themselves, and the no-show and retention figures came straight from your booking data, book a demo. We will walk you through the setup.

Still unsure which of the two you are actually measuring? Patient satisfaction vs patient experience works through the distinction with examples from private practice.
Retention rate sitting below the range above? Patient retention strategies covers the recall, reactivation, and loyalty tactics that move it fastest.
Ready to act on the scores rather than collect them? Improving patient experience turns each weak touchpoint into a concrete change at the front desk.
Want the wider care relationship behind these numbers? Patient care management covers the full lifecycle that retention rate ultimately reports on.
Shopping for a tool to run the surveys? Patient satisfaction survey software compares the options on response rate, automation, and reporting.
Aim for at least 30 responses per reporting period before you read a trend. Below that, two unhappy patients can swing an NPS by 20 points. A small practice sending after every appointment usually clears 30 within a month.
For most private practices, no. Hospital payment is tied to HCAHPS through Medicare’s value-based purchasing program. Clinicians reporting under MIPS can submit CAHPS for MIPS as a quality measure. Elective aesthetic and wellness practices sit outside both.
No. Google’s review policy prohibits soliciting reviews selectively from patients you expect to be positive. Send the request to everyone who completed an appointment. A genuine 4.6 with 200 reviews converts better than a filtered 5.0 with 12.
Expect three to six months. No-show rate responds fastest, often within 60 days of switching on two-step reminders. NPS and retention lag, because they only move as patients cycle back through for their next appointment.
Experience metrics record how a patient perceived your service, such as wait time or ease of booking. Engagement metrics record how actively they take part in their own care, such as portal logins and care plan adherence. One flags a service failure, the other flags a patient at risk of dropping out.