Trauma response test: Free template for clinicians
A trauma response test is a structured screening questionnaire that helps clinic...

1
Last Updated: Oct 15, 2026

The Outcome Rating Scale is a four-item self-report measure of client wellbeing across individual, interpersonal, social, and overall domains.
Scores run from 0 to 40, with a clinical cutoff of 25 for adults and 28 for ages 13 to 17.
A change of 5 points or more between sessions counts as reliable therapeutic progress.
The Child Outcome Rating Scale covers ages 6 to 12, and the comparison table below sets every version side by side.
Download the free PDF above, or rebuild the four items as a digital form clients complete before each session.
A printable four-item scale with 10-centimeter visual analog lines for individual, interpersonal, social, and overall wellbeing. The outcome rating scale PDF prints the scoring instructions and the adult clinical cutoff on the same sheet.
Download templateThe Outcome Rating Scale (ORS) is a four-item form that asks a client how life is going, scored out of 40. Adults below 25 sit in the clinical range. A move of 5 points or more between sessions counts as reliable change, and the whole thing takes under a minute.
Those figures are easy to find for the adult version. The rest of the family sits scattered across separate PDFs and licensing pages. So this page ends with one table covering the ORS, SRS, CORS and YCORS. It gives the age range, cutoff, reliable change index, reliability, cost and administration time for each. Assessment results kept on paper get filed and forgotten, so practice software for psychologists keeps them beside the notes.
Before that, it covers what the scale measures, how to administer it, and how to read the cutoffs. It also covers what to do when a score refuses to move. Finally, it shows how a mental health practice runs the whole routine as an automated workflow rather than a paper exercise.
The Outcome Rating Scale is a four-item self-report measure of client wellbeing, scored from 0 to 40. Scott D. Miller and Barry L. Duncan published it in 2003 as an ultra-brief alternative to longer outcome measures. Each item sits on a 10-centimeter visual analog line running from 0 to 10.
It is a self-rating scale, so the client’s own judgment produces the number and you never score it for them. You will see it written as the ORS, the ORS outcome rating scale, or simply the outcome rating scale. All three name the same one-page form.
Unlike a numerical rating scale, where the client picks a whole number from 0 to 10, the ORS line is continuous. A mark at 74 millimeters scores 7.4. Small shifts still register, which is what makes a four-item form usable as a week-to-week tracker.
Clients rate all four domains in under a minute, so the ORS fits a session opener. Long questionnaires tire clients out, and completion rates fall as a result. The form also sits naturally alongside your other digital intake forms.
Outcome rating scales in this family measure how the client says life is going. They do not tell you whether symptoms crossed a diagnostic threshold. Treat the ORS as a progress measure that sits alongside a fuller comprehensive assessment at the start of care, not in place of one.

The scale measures wellbeing across four distinct areas of a client’s life:
Those four lines are why the total is worth reading item by item. A client can climb in mood while stalling in relationships. One global number hides that split, and four numbers put it in front of you.
Hand the form to the client at the start of the session, before you discuss anything. Clients read the four statements and draw a perpendicular mark across each 10-centimeter line. The whole thing takes 30 to 60 seconds.
The adult form suits clients aged 13 and over. A parent or carer can complete the same four lines about a young person, which gives you two views of the same weeks. Score the two separately, because they answer different questions.
The visual analog format matters here. Fixed answer options carry an anchoring bias, since a default middle box or a strong endpoint word nudges the answer. Clients place their own mark instead, with nothing steering them toward the center.
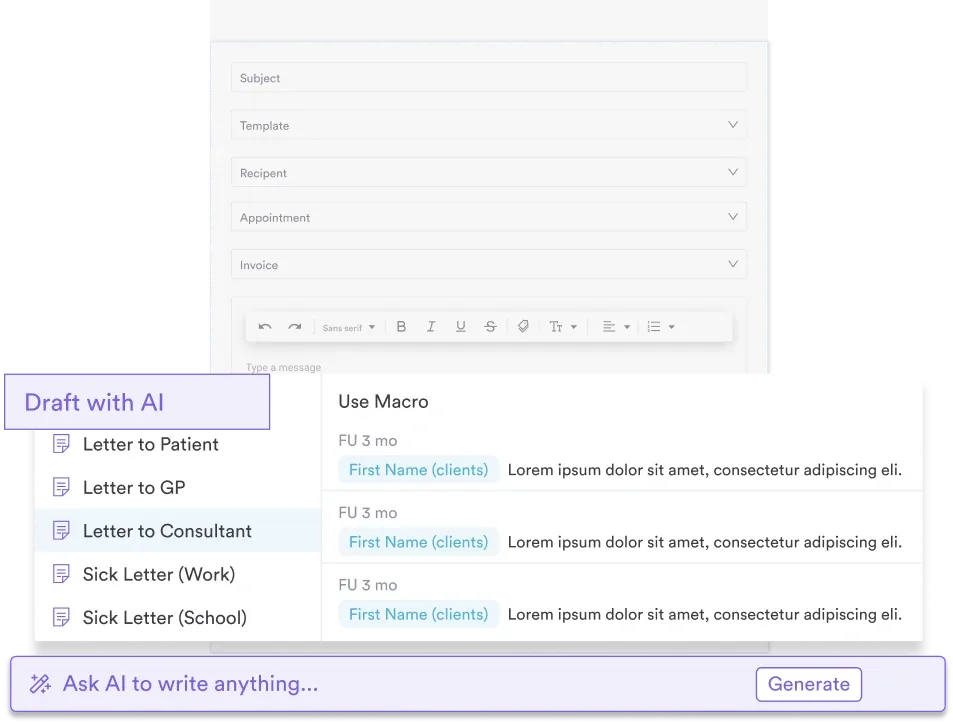
Sending the form ahead of the appointment takes the admin out of it altogether. An automated email or text collects the responses the day before, so the score is already waiting when the client sits down.
Outcome rating scale scoring takes two steps: measure the four marks, then add them up. Totals run from 0, meaning minimal wellbeing in every domain, up to 40, meaning optimal wellbeing. The arithmetic is trivial, and the interpretation is where the clinical judgment sits.
Measure each mark in millimeters from the left edge of its line, then convert to a score out of 10. A mark at 75 millimeters on the individual domain scores 7.5. Add the four numbers, so 7.5 plus 8.0 plus 6.5 plus 7.0 gives a total of 29.
The scoring guide printed on the template repeats those two steps in a couple of lines. That matters on a shared caseload, because anyone covering a session can total a form without being trained on it first.
For adults: the clinical cutoff is 25 out of 40. A score of 25 or above places the client in the non-clinical range. Below 25 places them in the clinical range, where distress or impairment warrants active therapeutic intervention.
For ages 13 to 17: the cutoff is 28. Use the adult figure with a teenager and a normal adolescent score reads as clinical. Check the age band before you interpret a total.
Reliable change index: a shift of 5 or more points between sessions counts as statistically reliable change. Anything smaller may be measurement error rather than progress. Watching that shift session to session tells you whether the work is landing.
A score that stays flat or falls across three consecutive sessions is a prompt to change something, not a reason to wait another month. In practice that means one of four moves:
Treat the score as a conversation opener rather than a verdict. That framing is one of three distinct uses clinicians make of the measure.
The two scales split one job in half: the ORS measures the outcome, and the Session Rating Scale (SRS) measures the alliance that produces it. Both sit inside the Partners for Change Outcome Management System, or PCOMS. Both are answered by the client, not by you.
Session rating scale scoring works the same way as the ORS. Four 10-centimeter lines, a total out of 40, and a cutoff of 36. Any total under 36, or any single line under 9, is worth raising with the client before they leave.
Because the pair is used as a set, training materials and templates usually list them together as ORS SRS. One session produces both numbers, and it is the combination that tells you what to change.
Together they support feedback-informed treatment, where you adjust your approach on what the client reports. Flat ORS scores open a conversation about barriers. A drop in SRS ratings is a signal to repair the alliance now, not next month.
The Child Outcome Rating Scale (CORS) adapts the ORS for children aged 6 to 12. It keeps the four domains and the visual format, with simpler wording and smiling or frowning faces to help younger clients read the lines. The Young Child ORS (YCORS) covers under-sixes and leans on caregiver report.
The cutoffs and change indices are validated separately from the adult version, and they differ. CORS uses a cutoff of 28 and a reliable change index of 6 points. Reading a child’s total against the adult figures of 25 and 5 misclassifies their progress.
Adult wording put in front of a nine-year-old also invalidates the clinical interpretation, so always use the age-appropriate form. Below age six, a developmental instrument such as the Bayley Scales answers a different question altogether.
Every version of these numbers normally lives on a different page, in a different PDF, or behind a licensing form. Here they are together, so you can pick the right form and the right cutoff in one look.
| Measure | Age range | Domains rated | Clinical cutoff | Reliable change (RCI) | Reliability (α) | Cost | Admin time |
|---|---|---|---|---|---|---|---|
| ORS | 13 and up, adult norms from 18 | Individual, interpersonal, social, overall | 25 for adults, 28 for ages 13 to 17 | 5 points | .93, up to .97 in later samples | Free on paper for solo practitioners, license for organizations | Under 1 minute, at session start |
| SRS | 13 and up | Relationship, goals and topics, approach, overall fit | 36, or under 9 on any one line | Not published | .88 | Free on paper for solo practitioners, license for organizations | Under 1 minute, at session end |
| CORS | 6 to 12, child and caregiver forms | Me, family, school, everything | 28, though the 2006 validation reported 32 | 6 points | Not published as a single figure | Free on paper for solo practitioners, license for organizations | Under 1 minute |
| YCORS | 5 and under, with caregiver support | Faces the child picks or draws | N/A | N/A | N/A | Free on paper for solo practitioners, license for organizations | Under 1 minute |
The blanks in that table are a finding, not an omission. YCORS carries no published cutoff or reliability figure, so treat it as a way to include a small child in the conversation. Score the caregiver’s CORS when you need a number for the record.
Licensing catches practices out more often than scoring does. Paper use is free for individual practitioners, while group practices, agencies and any electronic version need a license from the developers. Figures here come from CORC’s measure directory and the original validation papers.
The scale holds up well for its length, and the published figures are worth knowing before you defend it to a commissioner or a supervisor:
That validity figure is the one people query. A correlation of .59 with a 45-item measure looks modest until you remember the ORS asks four questions. Reducing 45 items to four costs precision, and the trade is a form clients still complete at session 20.
Rating scale psychology explains the format choice. Likert scale scoring collapses an answer into one of a few fixed values, so a small real change can land in the same box twice. A continuous line records the shift instead, which is what the 5-point index depends on.
PubMed indexes studies of the ORS across individual therapy, couples work, family therapy, group settings, and online counseling. That spread makes it one of the most tested brief measures in mental health.
Outcome monitoring on paper is cumbersome. Clinicians collect printed forms, work out the scores with a ruler, and file the results in paper charts. Half the value of a score is lost the moment it goes into a filing cabinet.
Practice management software like Pabau closes that loop for a therapy practice. You build the four ORS items once as a digital form. Pabau then sends it by email or text 24 hours before every appointment, without anyone remembering to.
Clients complete the scale on a phone or laptop, and the responses land in their client record. The form doubles as a scoring tool, totaling the four domains the moment a client submits it. Pabau then flags the result against the cutoff of 25 and plots the trend across months of therapy.
Pabau Scribe, our AI scribe, drafts the session note while you stay with the client. The note and the score then sit in the same file, so a review takes one screen rather than two systems.
Digitizing the scale changes three things:
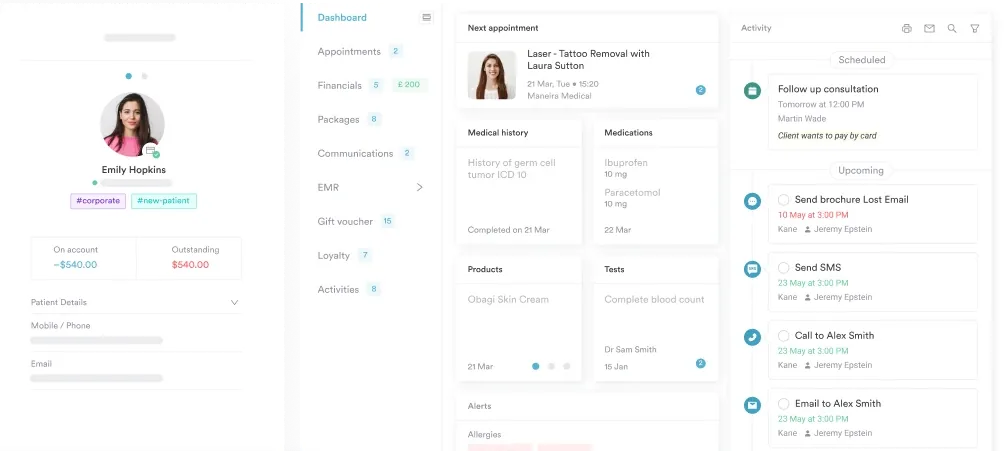

Pabau sends the ORS before each session, scores it automatically, and stores the result in the client record. You see the trend across months of therapy without chasing a single form.

Routine outcome monitoring only earns its keep if the score reaches you while you can still act on it. A number sitting in a paper file a week after the session has already lost most of its usefulness.
Get the age band and the cutoff right, and the measure does its job in under a minute a session. Get them wrong, and a normal teenage score reads as a clinical one.
The harder decision is whether the measure runs on its own, or depends on someone remembering it at 9am every Tuesday. The first version survives a busy caseload. The second quietly stops after a month.
Download the free template above and start with one caseload. Book a demo to see how Pabau sends the scale before each session and tracks every score in the client record.

Running a mental health practice across locations? EHR for multi-franchise practices covers what to look for in an EHR that scales across multiple practice locations.
Working with couples stuck in the same fight? Fair fighting rules offers a psychoeducation framework that replaces reactive conflict with regulated, solution-focused communication.
Struggling to keep your practice full? Therapy client growth guide explains why practice growth often has little to do with clinical skill alone.
Trying to read subtle mood changes accurately? Types of moods assessment guide helps you read the gap between what patients say and what their affect shows.
The ORS is a four-item self-report measure of client wellbeing across individual, interpersonal, social, and overall domains. Scott D. Miller and Barry L. Duncan developed it. It takes under one minute and produces a total score of 0 to 40.
ORS stands for Outcome Rating Scale, the four-item measure Scott D. Miller and Barry L. Duncan published in 2003. Outcome rating scales in the same family include the CORS for ages 6 to 12 and the YCORS for under-sixes.
For adults the cutoff is 25 out of 40, and for ages 13 to 17 it is 28. A score at or above the cutoff indicates non-clinical functioning, and anything below places the client in the clinical range. A change of 5 points between sessions counts as reliable progress.
Every session is best practice, and every other week is the practical minimum during ongoing therapy. Frequent measurement catches a decline early enough for you to respond to it.
Yes, for individual practitioners using it on paper. The ORS, the Child Outcome Rating Scale, and the related measures all download free as PDFs. You can get them from Scott D. Miller’s official site, from CORC, or from the template at the top of this page. Group practices, agencies, and electronic versions need a license from the developers.
It supplies the outcome half of feedback-informed treatment, known as FIT. Clinicians pair it with the Session Rating Scale, which covers the therapeutic alliance, then adjust the work on what both scores say.
Yes. The Child Outcome Rating Scale (CORS) is designed for children aged 6 to 12, and the Young Child ORS covers younger children. Use the age-appropriate version, because CORS carries its own cutoff of 28 and its own 6-point change index.
A Likert scale gives fixed options to choose from, and each option carries a whole number. The ORS uses a continuous line instead, so a client can mark any point along it. That records shifts a numerical rating scale would round away.