GLP-1 diet plan
A GLP-1 diet plan is a structured eating framework for patients taking semagluti...

2
Last Updated: Oct 13, 2026
A visual acuity test measures how sharply each eye resolves fine detail at a fixed distance. The patient reads rows of shrinking letters on a calibrated chart, and you record the smallest line they manage. Results are written as a fraction, with 20/20 as the reference standard.
So 20/40 means your patient reads at 20 feet what a standard observer reads at 40. That number shapes driving eligibility, referral urgency, and whether a prescription needs revisiting. The room itself produces plenty of poor readings, though. Distance, lighting, and chart choice all move the score before pathology does.

A visual acuity test measures central vision sharpness at a set distance, so it skips peripheral vision and contrast sensitivity.
Snellen 20/20 is the reference standard rather than perfect vision, and 20/200 best-corrected meets the US legal blindness threshold.
Chart choice follows the patient: Snellen for literate adults, Tumbling E or HOTV for children, LogMAR or ETDRS for research and low vision.
A pinhole that improves acuity by two or more lines points to a refractive cause, which changes where you refer.
Practice management software like Pabau can hold corrected and uncorrected results in the patient record and trigger the follow-up automatically.
A visual acuity test measures how sharply the eye resolves detail at a standard viewing distance. The result is usually expressed as a Snellen fraction such as 20/20 or 20/40. It quantifies the smallest optotype, meaning the letter or symbol, that a patient can correctly identify on a calibrated chart.
What it leaves out matters just as much. Peripheral vision, contrast sensitivity, color discrimination, and depth perception each need a separate assessment. Acuity captures central foveal resolution alone, which is why a patient can hold 20/20 and still lose visual field to glaucoma. Treat it as one part of a full eye physical examination.
It remains one of the most frequently performed procedures in primary care, optometry, and ophthalmology, and it serves a handful of distinct jobs.
Pick the chart before you pick the line. The right one depends on the patient’s age, literacy, and the setting you work in. A single-chart practice will produce unreliable numbers in pre-literate or non-literate patients, and those are exactly the patients screening is meant to catch.
Five chart types cover almost every case you will meet.
The HOTV and Lea Symbols charts come with a matching card, so the child points at the shape instead of naming it. That removes the language barrier completely. It matters clinically because amblyopia detection depends on testing each eye separately, at an age when letter recognition is still unreliable.
Standardized technique is what makes a result repeatable across visits and practitioners. Small deviations in distance, illumination, or instruction introduce measurement error that hides genuine change. StatPearls describes the following protocol as standard across clinical settings.
A projected chart lets you randomize letter presentation between visits, which reduces memorization artifacts. That is worth having in a practice that retests the same patients every year.
Run through this list before you write the result down. Each item shifts the score without anyone noticing.
The pinhole occluder separates refractive causes of reduced acuity from pathological ones. It limits incoming light to a narrow central beam, so only correctly focused rays reach the retina. Uncorrected refractive error stops mattering.
Here is the rule. If acuity improves by two or more lines with the pinhole, the deficit is mostly refractive, and glasses or contact lenses will correct it.
If it does not improve, suspect a pathological cause such as corneal opacity, macular disease, amblyopia, or optic neuropathy. The pinhole test needs no extra equipment, takes under two minutes, and changes the referral decision.
The Snellen fraction holds two numbers. The numerator is the testing distance, almost always 20 feet in the US. The denominator is the distance at which a standard observer could read the same line. So 20/40 means your patient reads at 20 feet what that observer reads at 40.
The fraction has no relationship to the percentage of vision remaining, which is the assumption most patients arrive with. Use the conversion table below when you need to move between Snellen, decimal, and LogMAR.
One caution on conversions. LogMAR-to-Snellen equivalents are mathematical approximations, so treat them as communication aids. Record the value you measured in the patient record, never a converted estimate.
20/20 vision is the reference standard for normal acuity. Your patient sees at 20 feet what a person with clinically normal vision sees at 20 feet. It is not the ceiling, and some people resolve detail at 20/10. Outside the US the metric equivalent is 6/6, measured at 6 meters.
Not all reduced acuity carries the same urgency. A primary care practice needs a decision rule tied to specific values, rather than a general feel for the Snellen scale. The table below groups acuity ranges into a clinical action framework you can apply at the chair.
These bands are a working clinical guide, not the WHO visual impairment categories. WHO uses different cut-offs, so quote those separately if you report against them.
The US legal blindness threshold is a best-corrected acuity of 20/200 or worse in the better eye, under the Social Security Administration definition. Other jurisdictions apply different criteria, so name the relevant authority whenever you document for legal or disability purposes.
LogMAR expresses acuity as the logarithm of the minimum angle of resolution, with 0.00 equal to 20/20. LogMAR 0.30 is 20/40, and LogMAR 1.00 is 20/200. The scale is linear and equal-interval, which is what statistical analysis needs. Snellen fractions are ordinal, so averaging them across a study group introduces error.
The ETDRS chart is the gold-standard version of that scale. It carries five Sloan letters per line, equal log-unit spacing between lines, balanced letter difficulty across rows, and a 4 meter testing distance. StatPearls notes that it repeats more reliably than Snellen, particularly at the low end where Snellen lines sit far apart.
Distance acuity says little about the most common complaint in patients over 40, which is difficulty reading. Near acuity uses a handheld card at 33 to 40 cm (13 to 16 inches), roughly a normal reading distance.
Two notation systems are in common use. Jaeger runs from J1, fine print equivalent to 20/20 at near, up to J10 for newspaper-sized text. N-notation runs from N5, the near equivalent of 20/20, up to N24 for large print.
Test near acuity whenever a patient reports reading difficulty, and during presbyopia evaluation from around age 40. Add it when distance acuity looks normal but the complaint is near-vision related. Record corrected and uncorrected near results separately from the distance figures.
Knowing the likely cause shapes both the workup and the referral route. The list below covers what a non-ophthalmologist meets most often, with a note on how each one behaves on the chart.
Referral thresholds vary by setting, so treat the following as general principles rather than a protocol. Clinical judgment still sits on top of the measured number. The path below is what a written practice protocol usually looks like.
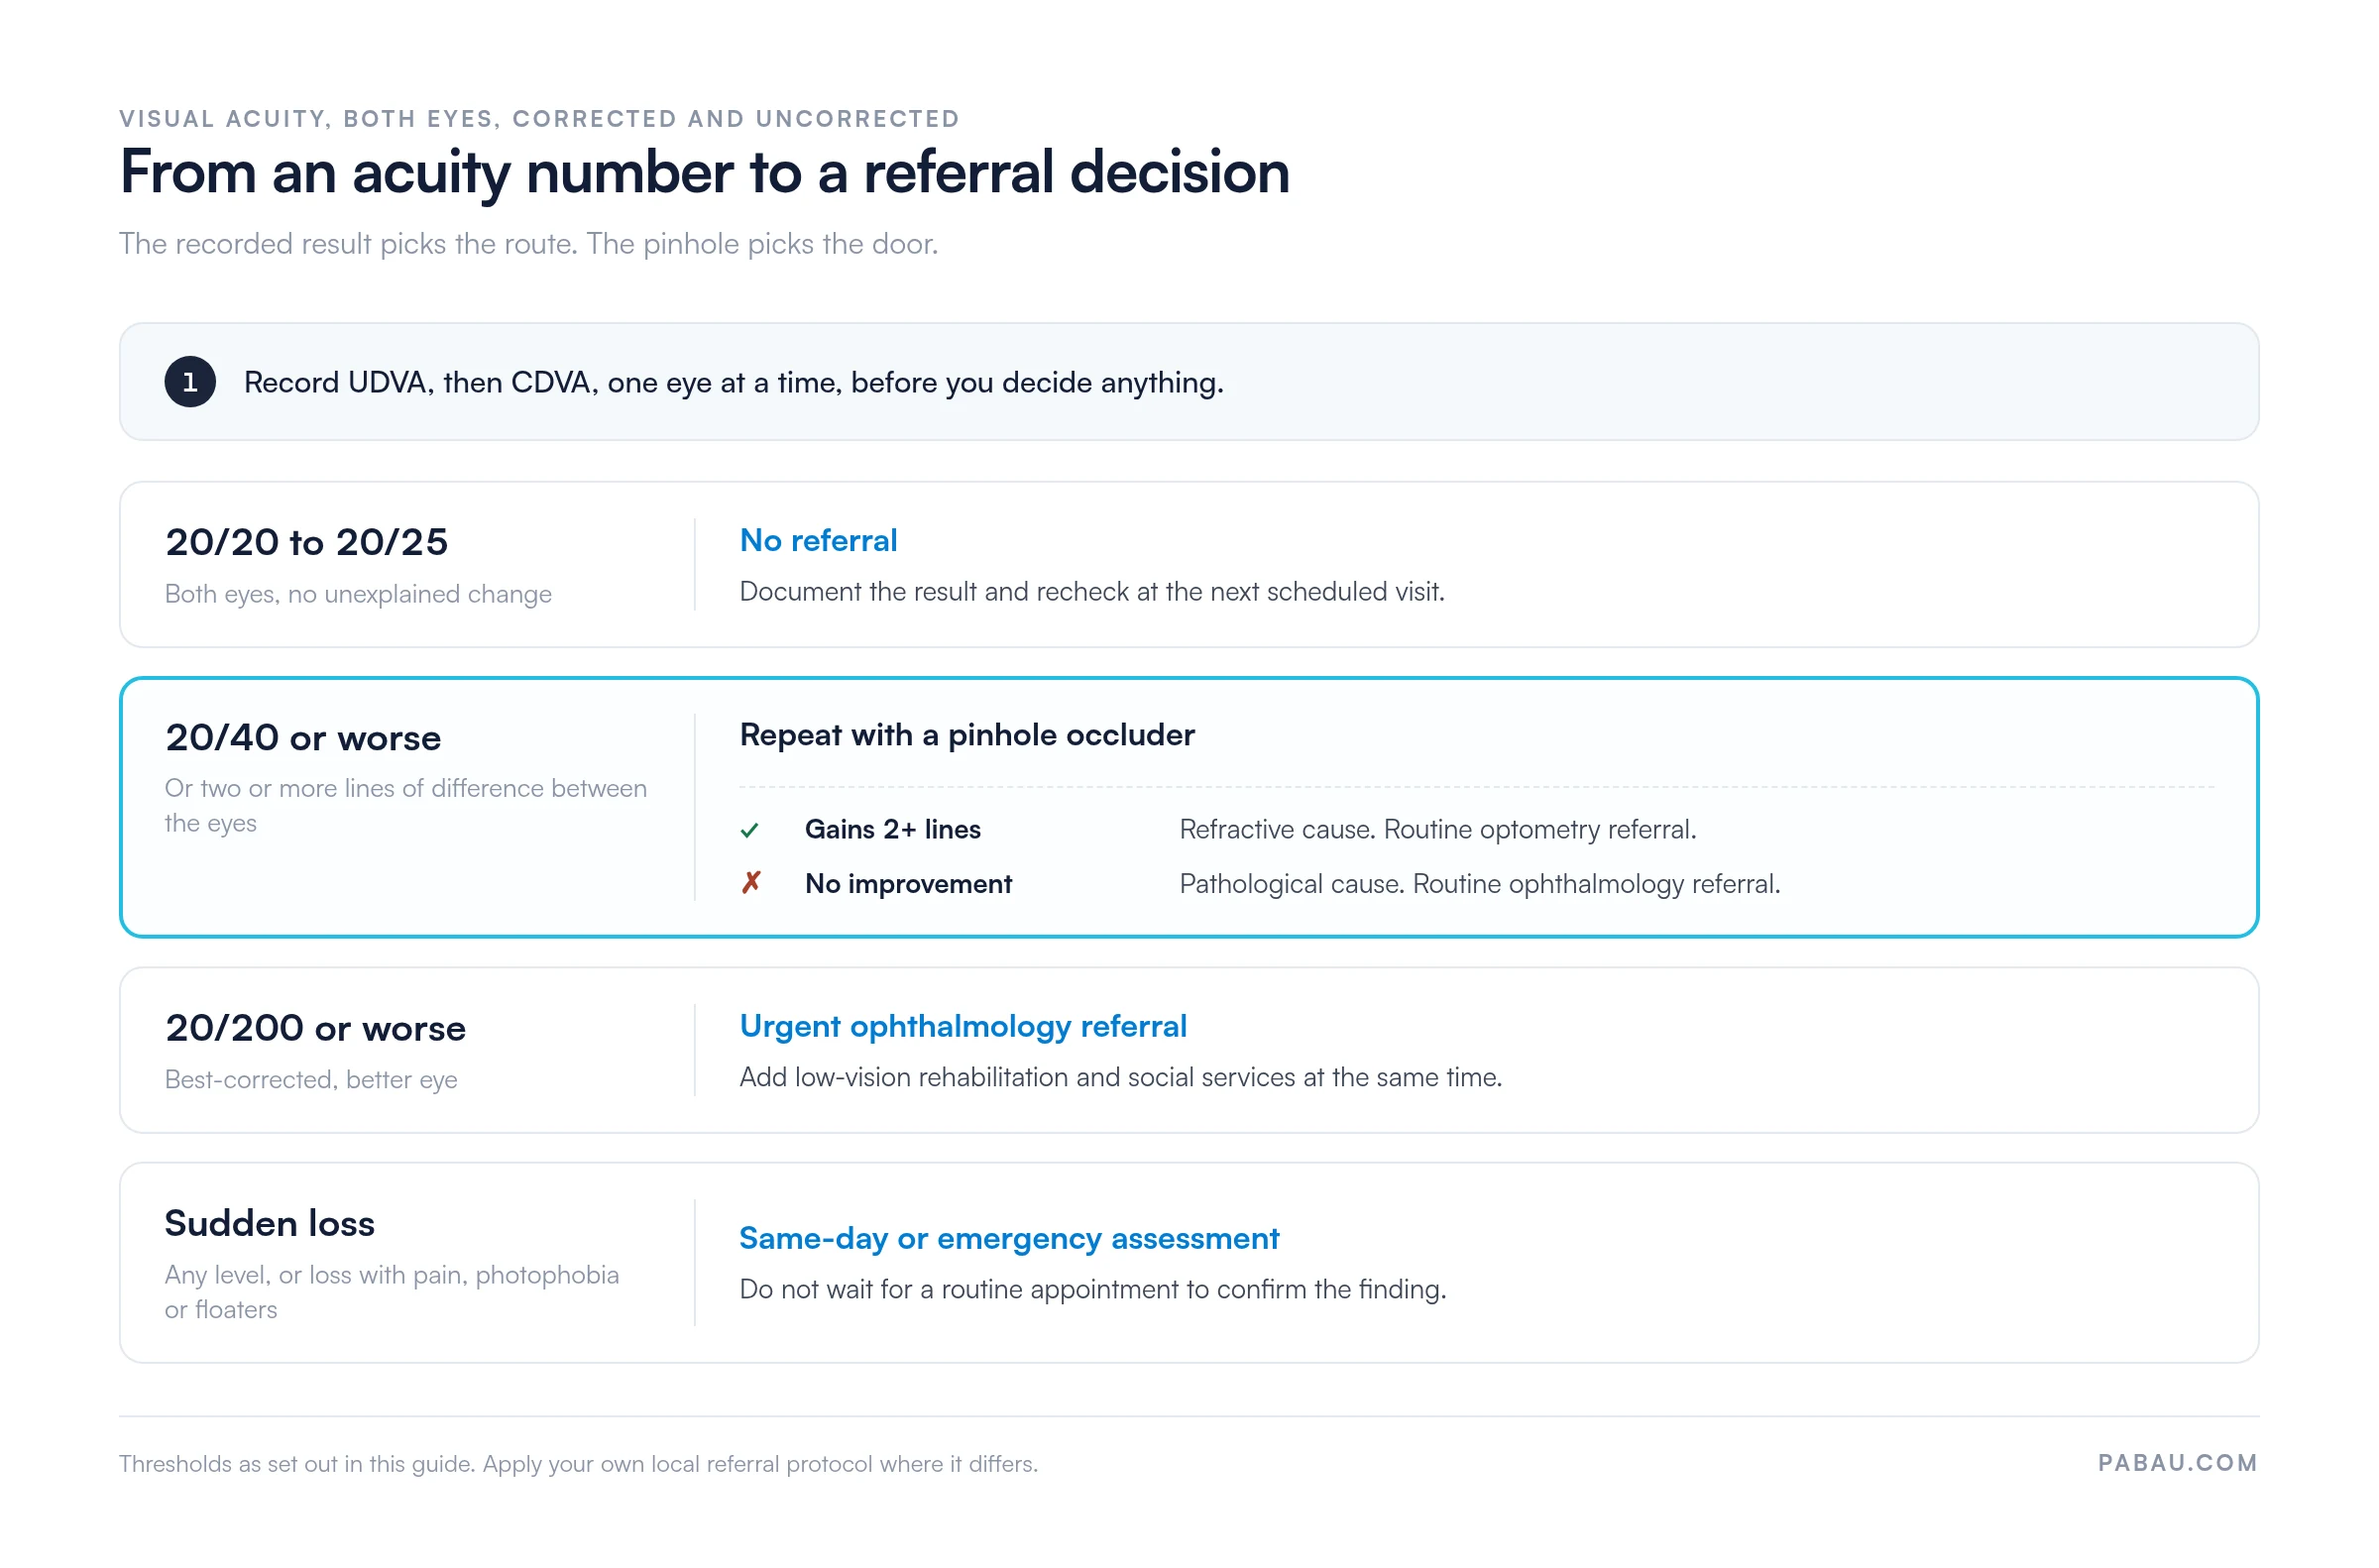
Flag any result of 20/40 or worse while you are still recording it, rather than at the end of the session. A same-day referral letter takes about five minutes. Tracking down a patient whose result was filed and never actioned takes far longer, and it carries medico-legal risk.
Most practices that run acuity tests write the result on paper, then retype it into the record later. Each clinician is left to judge when an abnormal finding gets actioned. Every retype adds a transcription risk, and every individual judgment adds variation across the team.
Practice management software like Pabau closes both loops. Its digital intake forms let you build an acuity screening form out of structured fields instead of free text. You capture UDVA and CDVA per eye, the pinhole result, the chart used, and the testing distance.
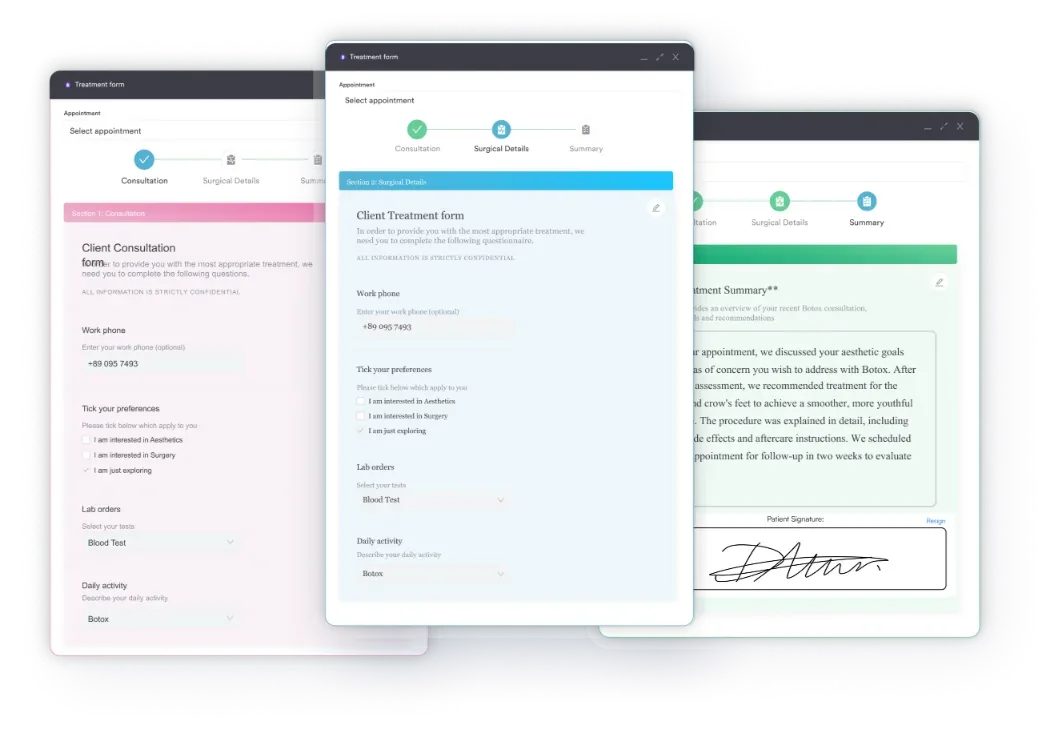
Results land in the client record the moment they are entered, so every practitioner works from the same history. Automated workflows then raise a follow-up task or a referral reminder when a reading falls below a threshold you set.
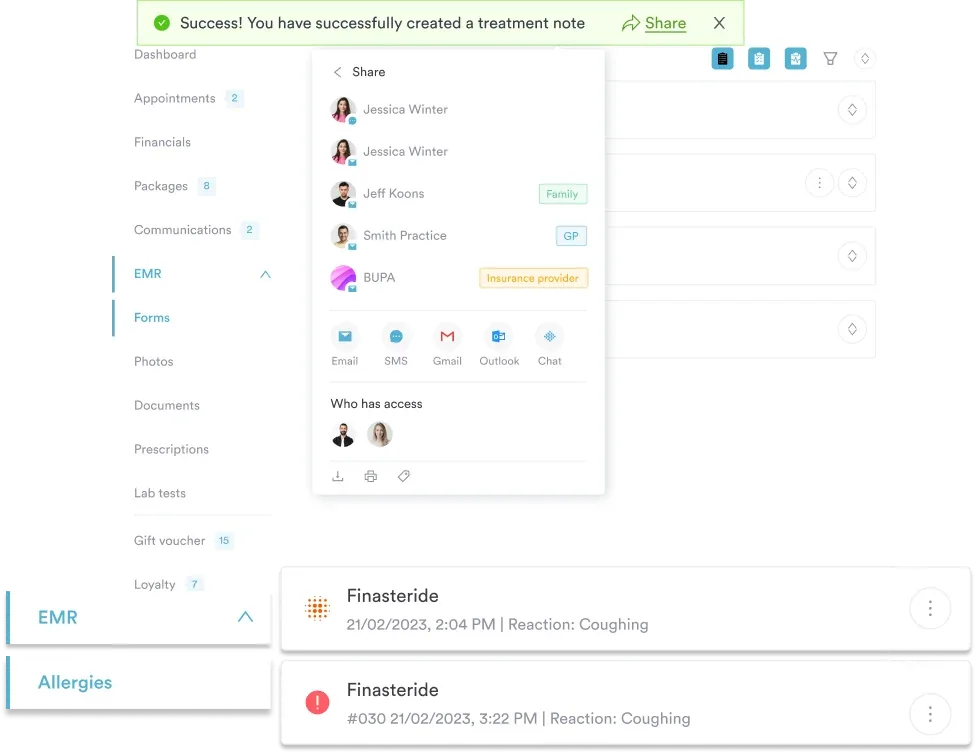
Pabau Scribe, our AI scribe, can capture the consultation note alongside those structured figures when a result needs narrative context. Your team writes the number once, and the follow-up is already scheduled.

Pabau’s digital forms capture corrected and uncorrected acuity for each eye and store the pinhole result. A follow-up task is raised automatically when a reading falls below your referral threshold.

The visual acuity test is simple to administer and easy to administer badly. Chart selection, room setup, monocular technique, the pinhole adjunct, and correct notation decide whether your recorded number reflects the patient’s acuity or your process.
Pick one chart family and stay with it. Run the pinhole on every reduced result. Write your referral thresholds down so a 20/40 reading stops being a judgment call for whoever happens to be in the room that day.
Recording is the part a busy practice can fix this week. Book a demo to see how Pabau keeps acuity results, pinhole findings, and referral follow-ups inside one patient record.

Want the full exam this test sits inside? Eye physical examination walks through the sequence from external inspection to fundoscopy.
Reduced acuity with no refractive explanation? Neurological eye exam covers the cranial nerve testing that explains the result.
Certifying commercial drivers? DOT eye test sets out the vision standards and the record you need on file.
Monitoring a diabetic panel? Diabetes eye exam structures the annual retinal screening record.
Patient reporting distortion rather than blur? Amsler grid chart gives you a printable grid for central field monitoring.
Move the patient to 10 feet, then 5 feet, and record the distance you used. Below chart range, use the standard descriptors in order: counting fingers, hand motion, light perception, then no light perception. Note the distance for counting fingers, such as CF at 2 feet.
Most healthy adults under 40 need screening every two years. From 40 to 64, annual or biennial testing is typical. From 65, test every year. Patients with diabetes, glaucoma, or a family history of eye disease follow their specialist’s schedule instead.
Home charts and phone apps give a rough indication only. Distance, screen size, and lighting are rarely controlled, so the result cannot stand in for a calibrated chart. Treat a poor home reading as a prompt to book a proper test.
A routine distance test on both eyes takes two to three minutes. Adding the pinhole and a near card brings it to about five. Pediatric testing with a matching card runs longer, because the child needs a practice run first.