Nitrates medication list
A nitrates medication list is a point-of-care reference that sets out the main c...

2
Last Updated: Oct 6, 2026
A prenatal growth chart plots fetal length, weight and biometric measurements against gestational age. Percentile bands beside them show the normal range for each week, so you can see at a glance where a scan sits.
At 12 weeks a fetus measures around 5.3 cm and 14 g. By 20 weeks that is 16.4 cm and 300 g, and at term it reaches roughly 51.2 cm and 3,400 g. A measurement below the 10th percentile counts as small for gestational age, and one above the 90th counts as large.
One detail catches practitioners out. Lengths up to about 20 weeks are measured crown to rump, while later figures are head-to-heel. The template below records each scan against your practice’s chosen standard, whether that is INTERGROWTH-21st, Hadlock or WHO.
A week-by-week reference chart for fetal length, weight and the four biometric measurements taken at ultrasound. It includes percentile bands, space for serial scan entries, and a note of which growth standard each figure follows.
Download template
A prenatal growth chart maps fetal measurements against gestational age and percentile bands, so growth problems show up early.
Ultrasound records BPD, HC, AC and FL, and abdominal circumference reacts first when growth is restricted.
A measurement below the 10th percentile is small for gestational age, and one above the 90th is large for gestational age.
Length is measured crown to rump up to about 20 weeks and head-to-heel from 24 weeks, so the scale changes mid-chart.
Pabau records BPD, HC, AC and FL in their own fields on the patient record, so serial scans can be trended and followed up.
A prenatal growth chart is the standard reference for assessing fetal development during pregnancy. It displays average fetal length, weight and biometric measurements against gestational age, with shaded percentile bands marking the normal range for each week.
Practitioners use it at routine antenatal appointments to interpret ultrasound findings and track the growth trajectory. Early detection of growth restriction or macrosomia gives you time to increase monitoring or escalate to specialist care.
The core of any growth chart is a week-by-week reference table. The table below shows average fetal length and weight from weeks 12-40, based on Hadlock equations used across North American practice.
Read the length column with care. Values through week 20 are crown-rump measurements, and from week 24 they are head-to-heel. Plotting both on one line makes it look as though a fetus grew 14 cm in four weeks.
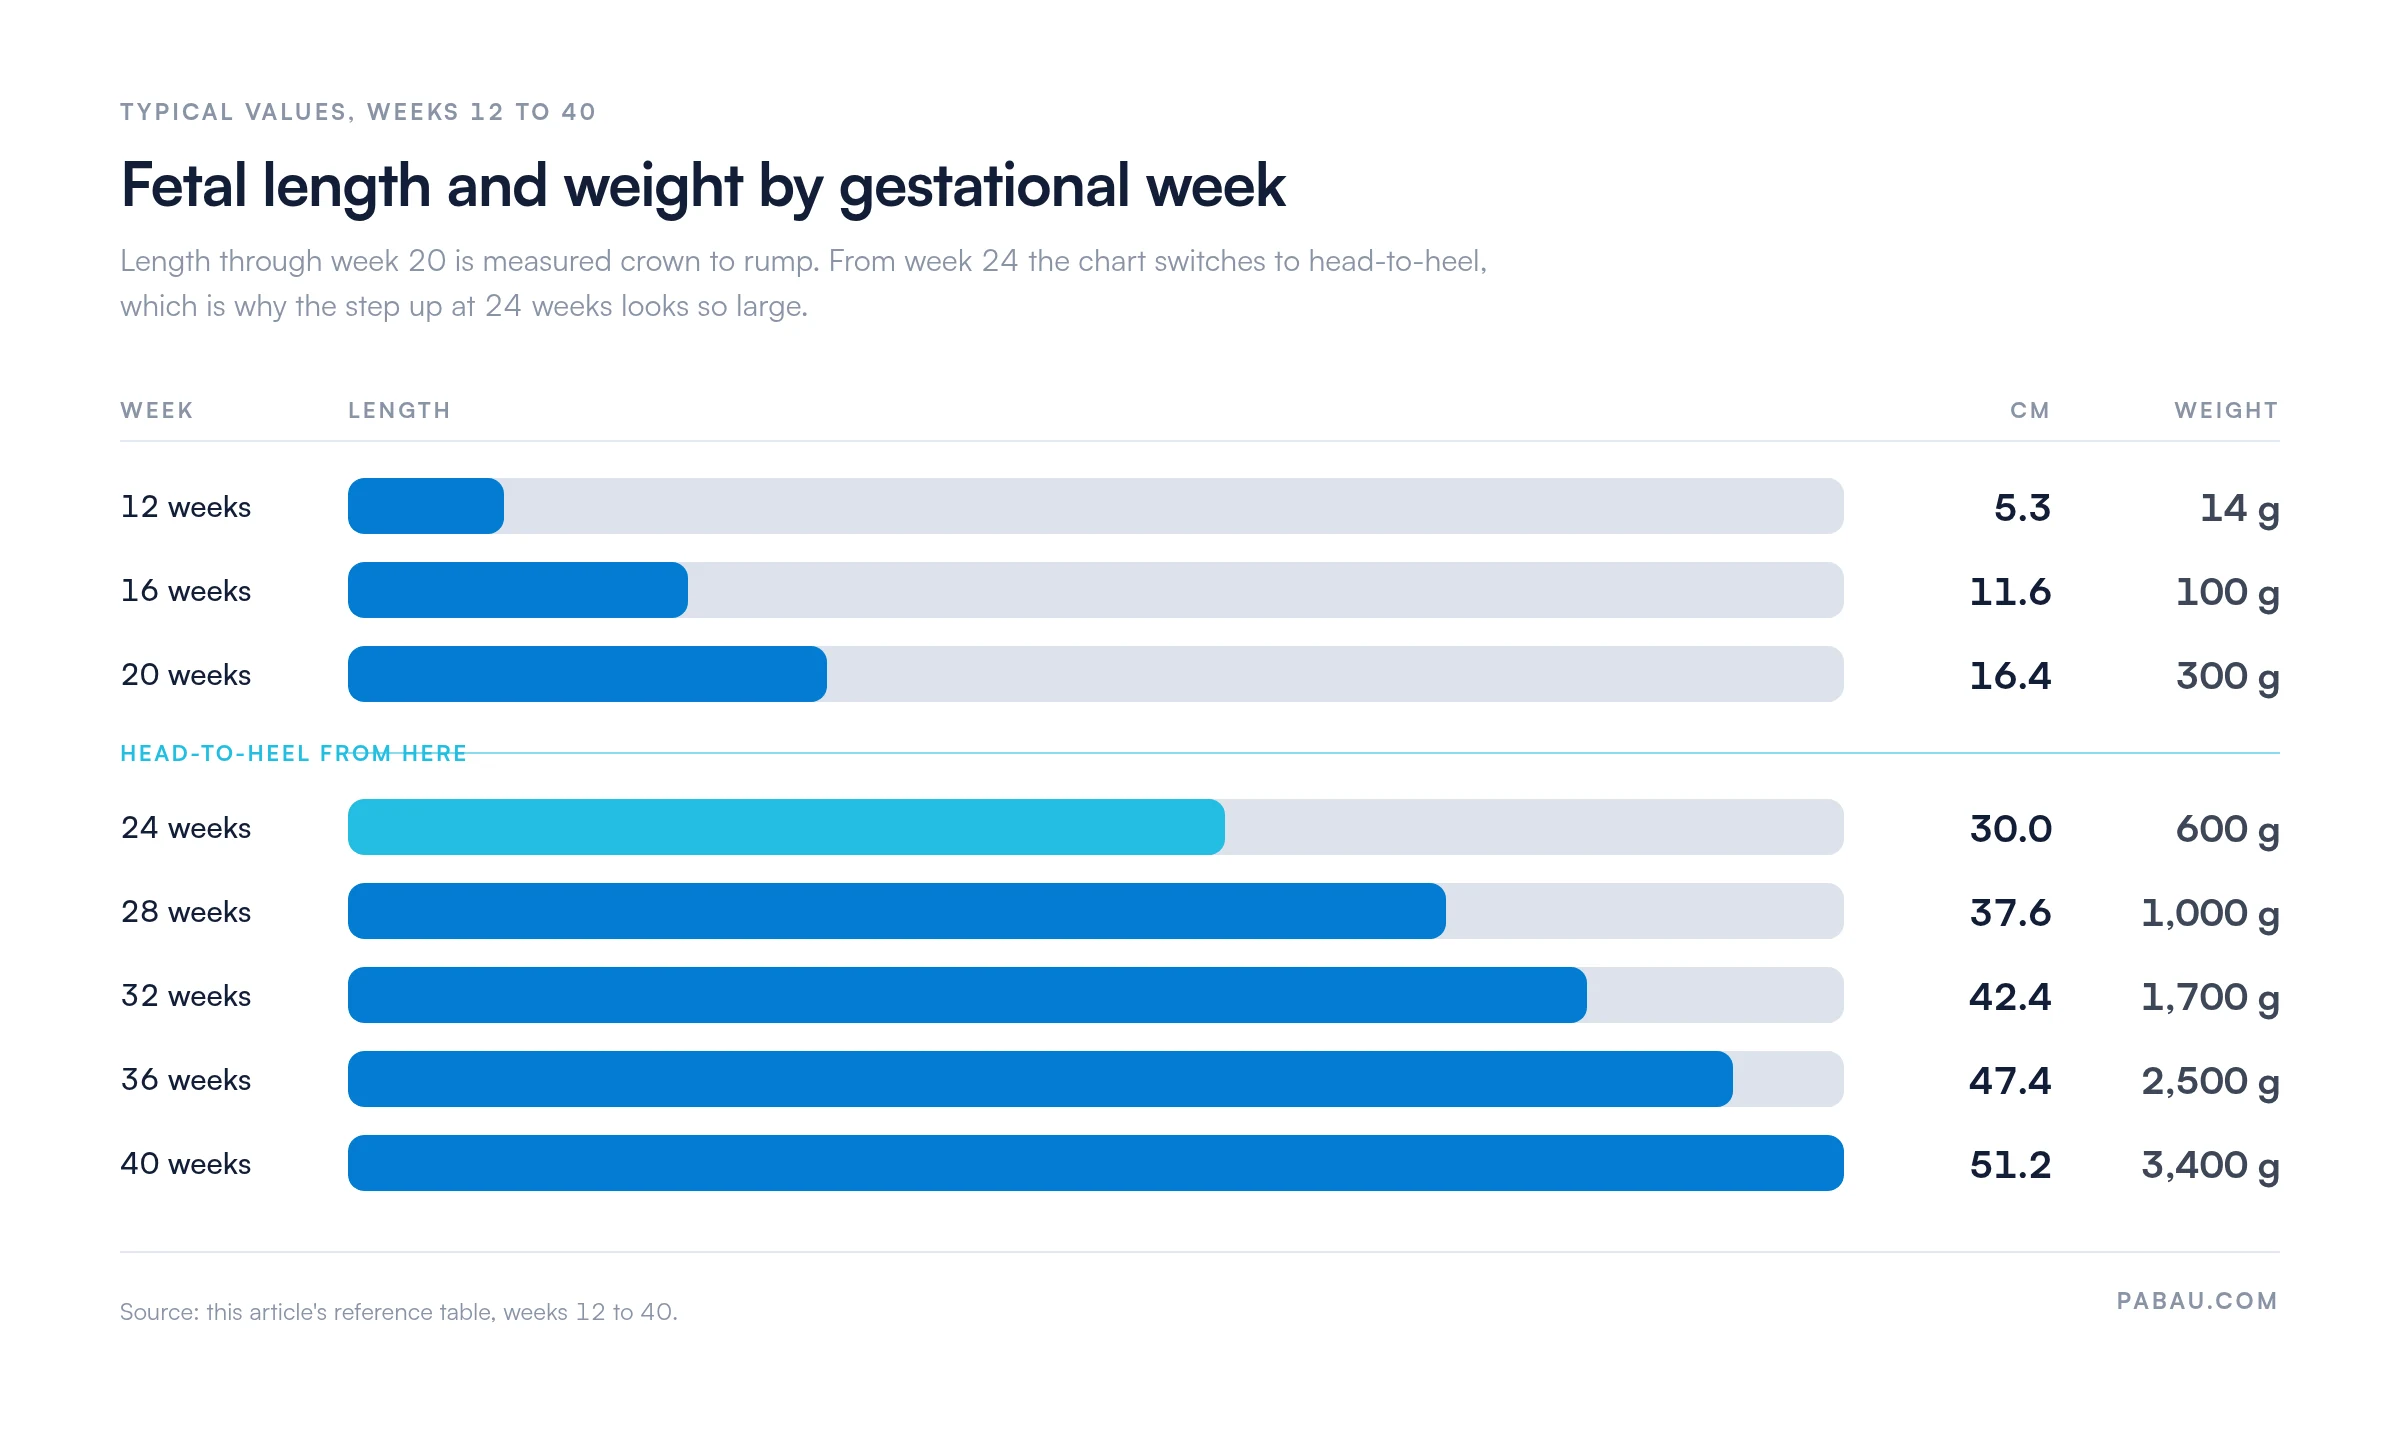
Use this alongside your practice’s chosen growth standard to place each patient’s measurements in the right percentile band.
Obstetric ultrasound measures four biometric parameters at each scan. Together they feed the equations that produce estimated fetal weight and a percentile rank.
AC is worth watching closely. A small abdomen next to a normal head and femur points to growth restriction, which calls for closer monitoring and specialist input.
Biometry is one part of the scan. Heart rate is another, and normal fetal heart rate ranges change with gestation, so both get read against the week.
A percentile tells you how a measurement compares with the reference population at that gestational age. A fetus at the 50th percentile is exactly median. One at the 10th percentile is smaller than 90% of fetuses at the same gestation.
A single measurement says far less than a series. Plot each scan on the chart and read the trend, because velocity is what separates a constitutionally small fetus from a failing one.
Where the trend suggests deceleration, fetal wellbeing testing usually follows. A nonstress test checks heart-rate reactivity and is a common next step after a borderline growth scan.
Three reference standards dominate practice, and they do not agree on every threshold. Name the one your practice uses in your clinical documentation, so a scan read by a colleague is interpreted the same way.
INTERGROWTH-21st is treated as the international reference because it was built from a global, ethnically diverse cohort of low-risk pregnancies. Hadlock stayed standard in North America through long use and regulatory familiarity. Pick one, document it, and apply it consistently.
Growth deviation usually has a cause worth finding. Knowing the common drivers helps you counsel patients, escalate at the right point, and avoid intervening in a fetus that is simply small.
Assisted conception raises the twin rate, so practices that run IVF alongside antenatal care see this more often. Purpose-built fertility clinic software keeps the cycle history and the scan record in the same patient file. That history matters when you read growth across a twin pregnancy.
When the chart shows a deviation, the workup covers maternal history, detailed ultrasound morphology, and referral to maternal-fetal medicine or neonatology where appropriate.
Most antenatal practices record scan measurements in whatever the ultrasound report produces, then file the PDF. Trending BPD, HC, AC and FL across visits then means opening each report in turn.
Practice management software like Pabau stores those four measurements in their own fields on the patient record. Each scan adds a dated row, so the series sits in one view instead of eight separate reports.
Medical records management and OB/GYN EMR software handle the rest of the pathway. Booking the next scan, recording consent, and storing the growth chart against the file all happen in the same system.
You still make the clinical call. Pabau records the measurements and schedules the follow-up, so the trend is in front of you at the next appointment.


Pabau stores BPD, HC, AC and FL against the patient record and schedules the next scan. The growth series is ready at each visit, with no report-hunting first.

The chart is only as good as what gets written on it. Decide which standard your practice reads against, write it on the form, and hold to it across the whole team.
The trade-off worth remembering is that a single scan cannot tell you much. Growth velocity carries the signal, and velocity needs every earlier scan to be findable in seconds.
Download the chart, use it at the next scan, and see whether it changes how quickly deceleration gets spotted. Book a demo to see how Pabau keeps antenatal measurements and follow-ups on one patient record.

Tracking maternal observations too? Blood pressure pregnancy chart gives you the thresholds and a place to record readings at each antenatal visit.
Need a record for the delivery room? Apgar score template covers the five signs scored at one and five minutes after birth.
Following up an abnormal screening result? Amniocentesis test documentation sets out what to record before, during and after the procedure.
Reading serum screening alongside growth? Alpha-fetoprotein test template explains what the AFP result means and how to document it.
Planning care after delivery? Postpartum care plan structures the six-week follow-up, from bleeding checks to mood screening.
A prenatal growth chart displays fetal measurements by gestational age alongside percentile bands. Practitioners read it during antenatal ultrasound to interpret findings, spot growth abnormalities, and set how closely to monitor.
A percentile shows how a measurement ranks against the reference population. The 50th is median, below the 10th is small for gestational age, and above the 90th is large for gestational age. A downward crossing of percentile lines across serial scans signals deceleration and needs investigation.
Normal values vary by standard and gestational age. At 20 weeks a typical fetal length is 16.4 cm and weight 300 g. At 36 weeks length is about 47.4 cm (18.7 in) and weight 2,500 g. Lengths through week 20 are crown-rump, and from week 24 they are head-to-heel.
SGA means an estimated fetal weight below the 10th percentile for gestational age. It calls for maternal and fetal assessment to find the cause. That may be placental dysfunction, infection, congenital anomaly, maternal hypertension, or a constitutionally small but healthy fetus. Not every SGA fetus has pathology, but each one warrants evaluation.
INTERGROWTH-21st is an international, prospective, multiethnic fetal growth study covering gestational ages 14 to 40 weeks. WHO and many fetal medicine societies treat it as the reference standard. It was built from a globally representative cohort of low-risk singleton pregnancies, using standardized ultrasound methods.
Estimated fetal weight comes from regression equations that combine BPD, HC, AC, FL and gestational age. The Hadlock equations are the most widely used. Most ultrasound machines calculate EFW once the four parameters are entered, and the result is then compared against percentile charts.