Healthcare risk management: A practical guide for private practices
Healthcare risk management is the process of finding, assessing, and controlling...

Last Updated: Oct 5, 2026

A newborn weight gain chart sets out expected weekly and monthly milestones from birth to 12 months, plotted against WHO and CDC growth standards.
Newborns lose 5-10% of birth weight in the first 3-5 days, regain it by day 10-14, then gain 5-7 oz (140-200 g) a week.
Breastfed and formula-fed babies gain at a similar rate for the first 3-4 months, after which formula-fed babies often gain faster.
Growth velocity matters more than the percentile band, so steady gain along any curve is reassuring.
Pabau stores every weight inside structured clinical notes, and automated recall reminders keep the 2-week, 6-week and 3-month checks on the calendar.
Page one sets out expected weight change from day one to month 12, the escalation thresholds, and a feeding-adequacy check. Page two is a blank weight record with columns for kilograms, pounds, percentage change from birth weight, and percentile.
Download templateA newborn weight gain chart tells you whether a baby’s first weeks are on track. Most newborns lose 5% to 10% of their birth weight by day three to five. They regain it by day 10 to 14, then add 5 to 7 oz (140 to 200 g) a week for the next three months.
Those two checkpoints matter more than any single number on the scale. Miss the regain window and a feeding problem can run for days before anyone acts.
Below are the weekly ranges, the breastfed and formula-fed difference, the red flags worth escalating, and a printable chart for every postnatal visit.
A newborn weight gain chart is a clinical reference tool that sets out expected weight milestones from birth to 12 months. It shows average gain by week and by month.
That lets you check one baby’s growth against norms published by the World Health Organization (WHO) and the Centers for Disease Control and Prevention (CDC).
Three data points do most of the work. The chart carries birth weight, age-specific weight percentiles (5th, 10th, 50th, 90th and 95th), and the expected weight range at each milestone. Together they support structured documentation of postnatal growth and early detection of failure to thrive.
Most clinical charts are built on the WHO Child Growth Standards or the CDC growth charts. Both line up with postnatal care guidance from the American Academy of Pediatrics (AAP).
In the UK, the NHS and NICE publish equivalent guidance. That shared basis is why one chart works across different care settings.
Five steps take you from birth weight to a documented escalation decision. They slot into standard postnatal assessment, so nobody has to learn a separate workflow.
A chart is only as good as the weights on it. Three everyday habits quietly wreck the trend, and all three are cheap to fix.
One more thing worth agreeing as a team: who weighs, and when. Most missed weight checks are not clinical misjudgments. They are a baby whose 2-week visit landed with nobody.
Postnatal weight monitoring crosses several roles, and each one picks up the chart at a different point. Obstetric teams on postnatal wards use it to screen for feeding complications before discharge. Midwives on home visits in the first two to four weeks use it to decide who needs urgent pediatric review.
Community nurses and health visitors lean on it when reassuring parents about normal newborn behavior. Pediatricians and primary care practices reach for it at the 2-week, 6-week and 3-month checks. Lactation consultants use it to show a breastfeeding family that the plan is working.
If you already document the full newborn check, the weight chart sits alongside it. Our newborn exam template covers the system-by-system assessment that the first visit needs.
Standardizing how weights get recorded buys three things. Clinical decisions get safer, visits get faster, and the record holds up under review.
Clinical safety. Catching poor gain early cuts the risk of dehydration, hypoglycemia and failure to thrive. Consistent measurement also makes it easier to separate normal physiologic loss from a loss that needs treating. A digital intake form can capture birth weight, feeding method and parental concerns at the first postnatal contact. That sets the baseline once, rather than rebuilding it at every visit.

Workflow efficiency. A standard chart removes ad-hoc assessment, so every clinician applies the same criteria. Teams stop recalculating percentiles or hunting for last week’s weight in a paper file.
Audit readiness. A complete, dated and signed weight record is the evidence you need in a regulatory review or a complaint. Showing that every baby was weighed at defined intervals protects the practice. Showing that a concerning weight triggered documented action protects the clinician.
Parent confidence. Plotting a baby’s weight on a chart with clear percentile bands reassures a worried family faster than any explanation. Handing over a copy reinforces what the discharge summary already said.
Weight loss in the first days after birth is expected, not a sign of feeding failure. Knowing the size of the normal dip is what lets you reassure a family with confidence.
Most newborns lose 5% to 10% of birth weight within the first 3 to 5 days. A 3.5 kg (7.7 lb) baby might weigh 3.15 to 3.32 kg by day three. The loss reflects fluid shifts as the baby adjusts to life outside the womb. Amniotic fluid is expelled, meconium is passed, and milk or formula intake has not yet caught up.
The dip and the recovery follow a predictable shape, and two points on it carry most of the clinical weight.
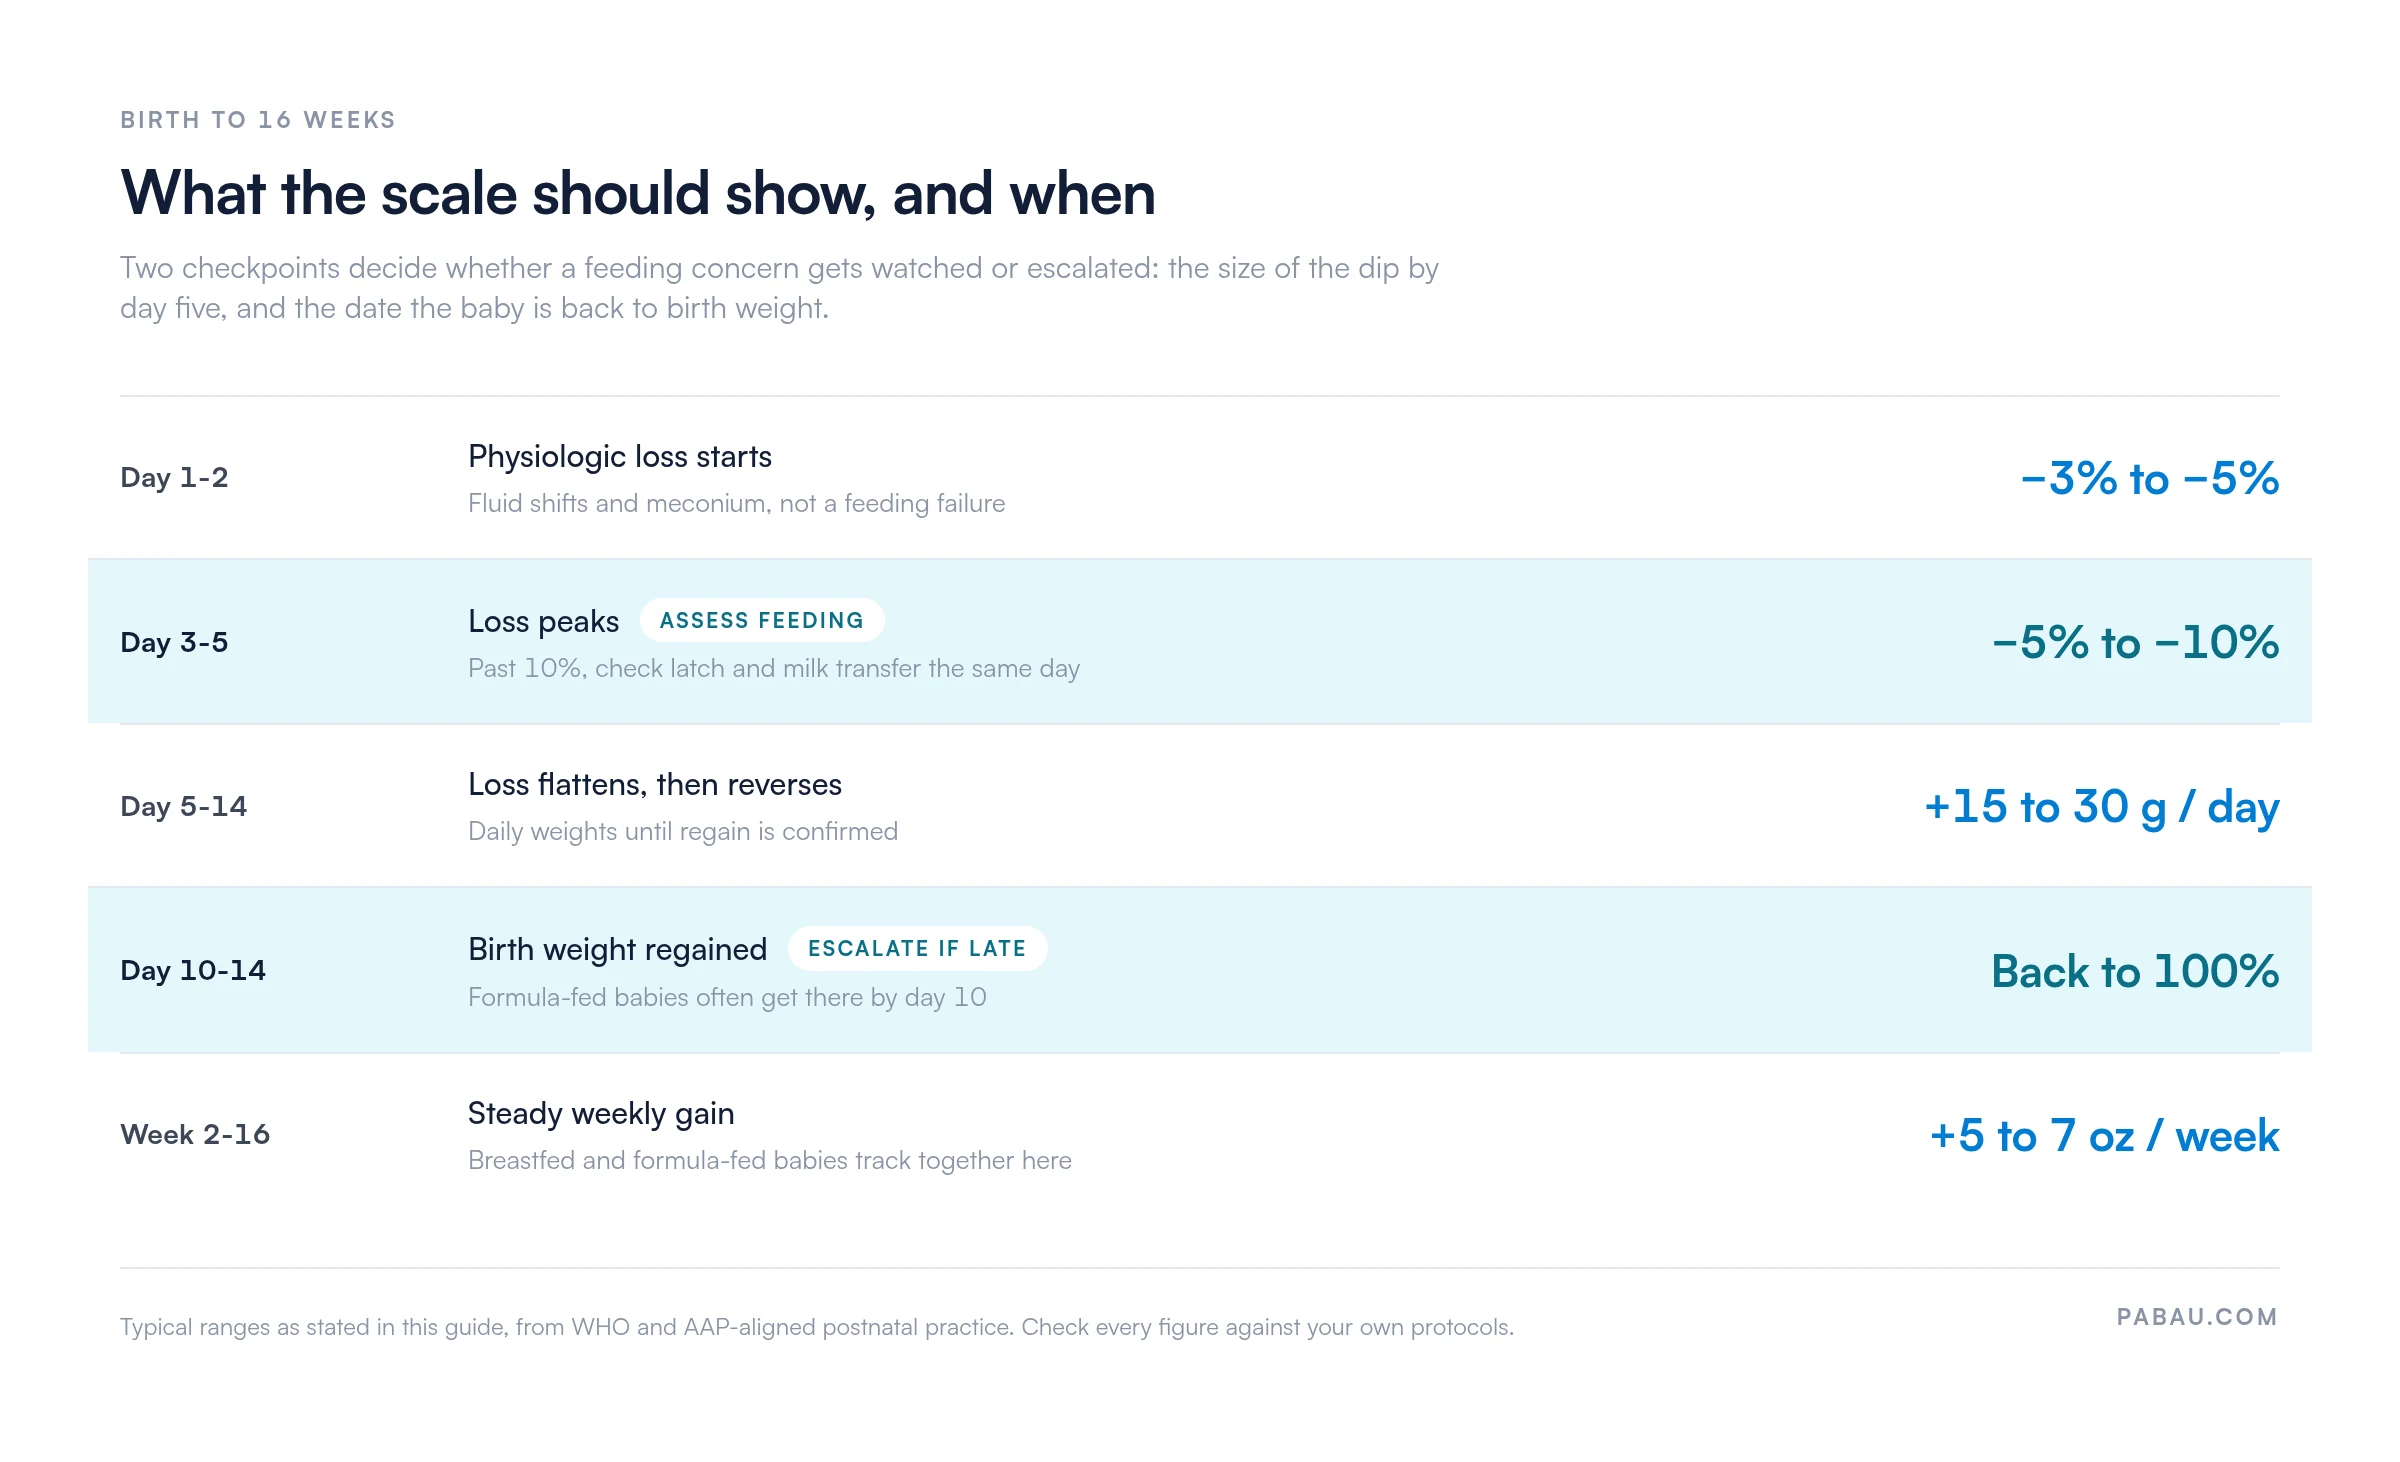
If a baby loses more than 10% of birth weight, or regain runs late, four things happen next.
For the first three to four months, the two groups gain at much the same rate. After that, formula-fed babies often pull ahead.
The WHO growth chart was built from a reference population of breastfed infants, which is why the difference shows up on the curve at all.
Growth velocity matters more than the band a baby sits in. Smooth, consistent gain along any percentile curve is reassuring. Tell parents the chart is a guide rather than a target. A baby who gains steadily, hits developmental milestones and shows normal output is thriving, whether the line runs at the 25th percentile or the 75th.
The scale is one signal among several. These markers tell you whether intake is adequate between weigh-ins.
Weight is also one line in a wider picture. Our pediatric vital signs chart carries the age-banded heart rate, breathing and temperature ranges that sit beside it at the same visits.
Some patterns cannot wait for the next routine visit. Each one below is a trigger for assessment, not a reason to watch and hope.
Read output and behavior alongside the weight. A baby with normal diaper counts and good alertness is often thriving even when gain is slower than average. Poor output, feeding difficulty and low gain together is the combination that needs same-day action.
Most practices record newborn weights in three places at once. The midwife writes it on a paper chart. Someone types it into the practice system later.
The percentage change gets worked out on a calculator at the visit. When a baby moves between the ward, a home visit and a primary care check, the trend spreads across three records. Nobody sees the whole line.
Practice management software like Pabau keeps the sequence in one place. Each weight goes into the baby’s structured clinical note, so the previous measurement is on screen when you record the next one. Digital intake forms capture birth weight, gestation and feeding method at the first postnatal contact, which sets the baseline once.
Automated recall reminders handle the calendar side. The 2-week, 6-week and 3-month checks get booked and chased from the delivery date. A baby who needs a weight check stops slipping through because a parent forgot to call.
You still make the clinical judgment. Pabau makes sure the numbers behind it are complete, dated and in one file.

Pabau holds each weight inside the baby’s structured clinical note, so the trend stays in one file from the ward through the 3-month check. Automated recall reminders book and chase the 2-week, 6-week and 3-month visits from the delivery date.

Two dates decide most newborn weight conversations. The day the loss stops, and the day birth weight comes back. Record those accurately and the rest of the first year is trend-watching rather than firefighting.
The chart is a guide, not a verdict. A baby tracking the 25th percentile with good output and steady gain needs reassurance, not investigation. A baby sliding down two bands needs a plan this week, whatever the absolute number says. The judgment stays yours. The chart is what makes it defensible.
So download the chart, agree who weighs and when, and give the numbers one home. Book a demo to see how Pabau keeps every newborn weight, clinical note and follow-up reminder in the same patient record.

Building out the wider pediatric assessment? Pediatric assessment walks through the structured approach that a weight check sits inside.
Need age-banded blood pressure values? The pediatric blood pressure chart gives you the percentile thresholds by age, height and sex.
Tracking the first-year vaccine schedule? An immunization record form keeps doses, dates and lot numbers in one auditable place.
Running a full pediatric review? The pediatric review of systems template prompts every body system in the order you ask about them.
Use the WHO Child Growth Standards from birth. They cover birth to 5 years and describe how breastfed babies grow. In US practice, most clinicians switch to the CDC charts at 2 years, and those run to 19 years. The WHO standards never covered the teenage years.
Subtract the current weight from the birth weight, divide by the birth weight, then multiply by 100. A baby born at 3.5 kg who now weighs 3.22 kg has lost 8%. Use the same units on both sides, and always measure against birth weight rather than the lowest weight recorded.
Weigh the baby undressed and without a diaper, on the same calibrated scale every time. Aim for a similar point in the feeding cycle, and record who took the measurement. Switching scales or leaving a wet diaper on can hide or invent a full day of gain.
No. Preterm babies are plotted on a preterm growth chart until around 50 weeks post-menstrual age, then move to the WHO chart using corrected age. Plotting a baby born at 32 weeks against term expectations looks like failure to thrive when growth is actually on track.