Detox diet plan
A detox diet plan is a structured eating protocol that cuts processed foods, add...

5
Last Updated: Oct 9, 2026
A food calorie chart lists the calories in common foods per standard serving, grouped by food type. It lets a patient or practitioner estimate a day’s intake in minutes, without an app.
The catch is portion size. One cup of cooked white rice carries 242 kcal, and a second scoop quietly adds another 242. Get servings wrong and a careful food diary can miss hundreds of calories, which stalls plans that look right on paper.
Below, you’ll find USDA-based tables by food group and daily calorie needs by age and activity. You’ll also get a five-step method for weight loss consultations.
A one-page A4 patient form with fields for age, weight, height, activity level and a daily calorie goal. It also has a servings log for 18 common fruits and vegetables. Used by 453+ clinics for nutrition counseling and weight management consultations.
Download template
A food calorie chart lists the energy in common foods per standard serving, so you can estimate daily intake without an app.
Food-group values are sourced from USDA FoodData Central; fast-food and Indian figures are approximate.
A 500 kcal daily deficit is often quoted as about 1 lb lost per week. That’s a rule of thumb that tends to overestimate loss over time, so plan targets with clinical supervision.
Portion size moves the total more than food choice, and doubling a cup of cooked rice adds 242 kcal to one meal.
Adults need roughly 1,600 to 3,000 kcal a day depending on age, sex, and activity, according to the Dietary Guidelines for Americans.
A nutrition label describes one packaged product in detail. A calorie chart works the other way round. It lines up dozens of everyday foods, including loose produce and home-cooked staples, with their energy content per serving.
That breadth makes it useful in consultations. A health coach can check a patient’s food diary against it to see whether they’re in a calorie deficit. A metabolic health practice might hand it out before a first appointment, so patients arrive with a shared reference. It doesn’t replace an assessment by a registered dietitian, but it gives both of you the same numbers.
For context, the FDA’s Nutrition Facts label uses 2,000 kcal a day as its standard reference value. That figure exists for labeling only. Individual needs vary with age, sex, body size, and activity level.
The values below come from USDA FoodData Central, the main US database of food nutrient values. Each row lists a common serving, from a medium apple to a tablespoon of butter. Rows marked cooked use cooked weights, so weigh those foods after cooking.
Portion size is one of the main reasons food diaries come in low. The same food can deliver very different energy depending on how much lands on the plate. This table shows how calories scale across three serving sizes for four foods patients eat often.
Doubling a serving doubles its calories, but the extra amount differs a lot from food to food. The chart below ranks the cost of a second helping.
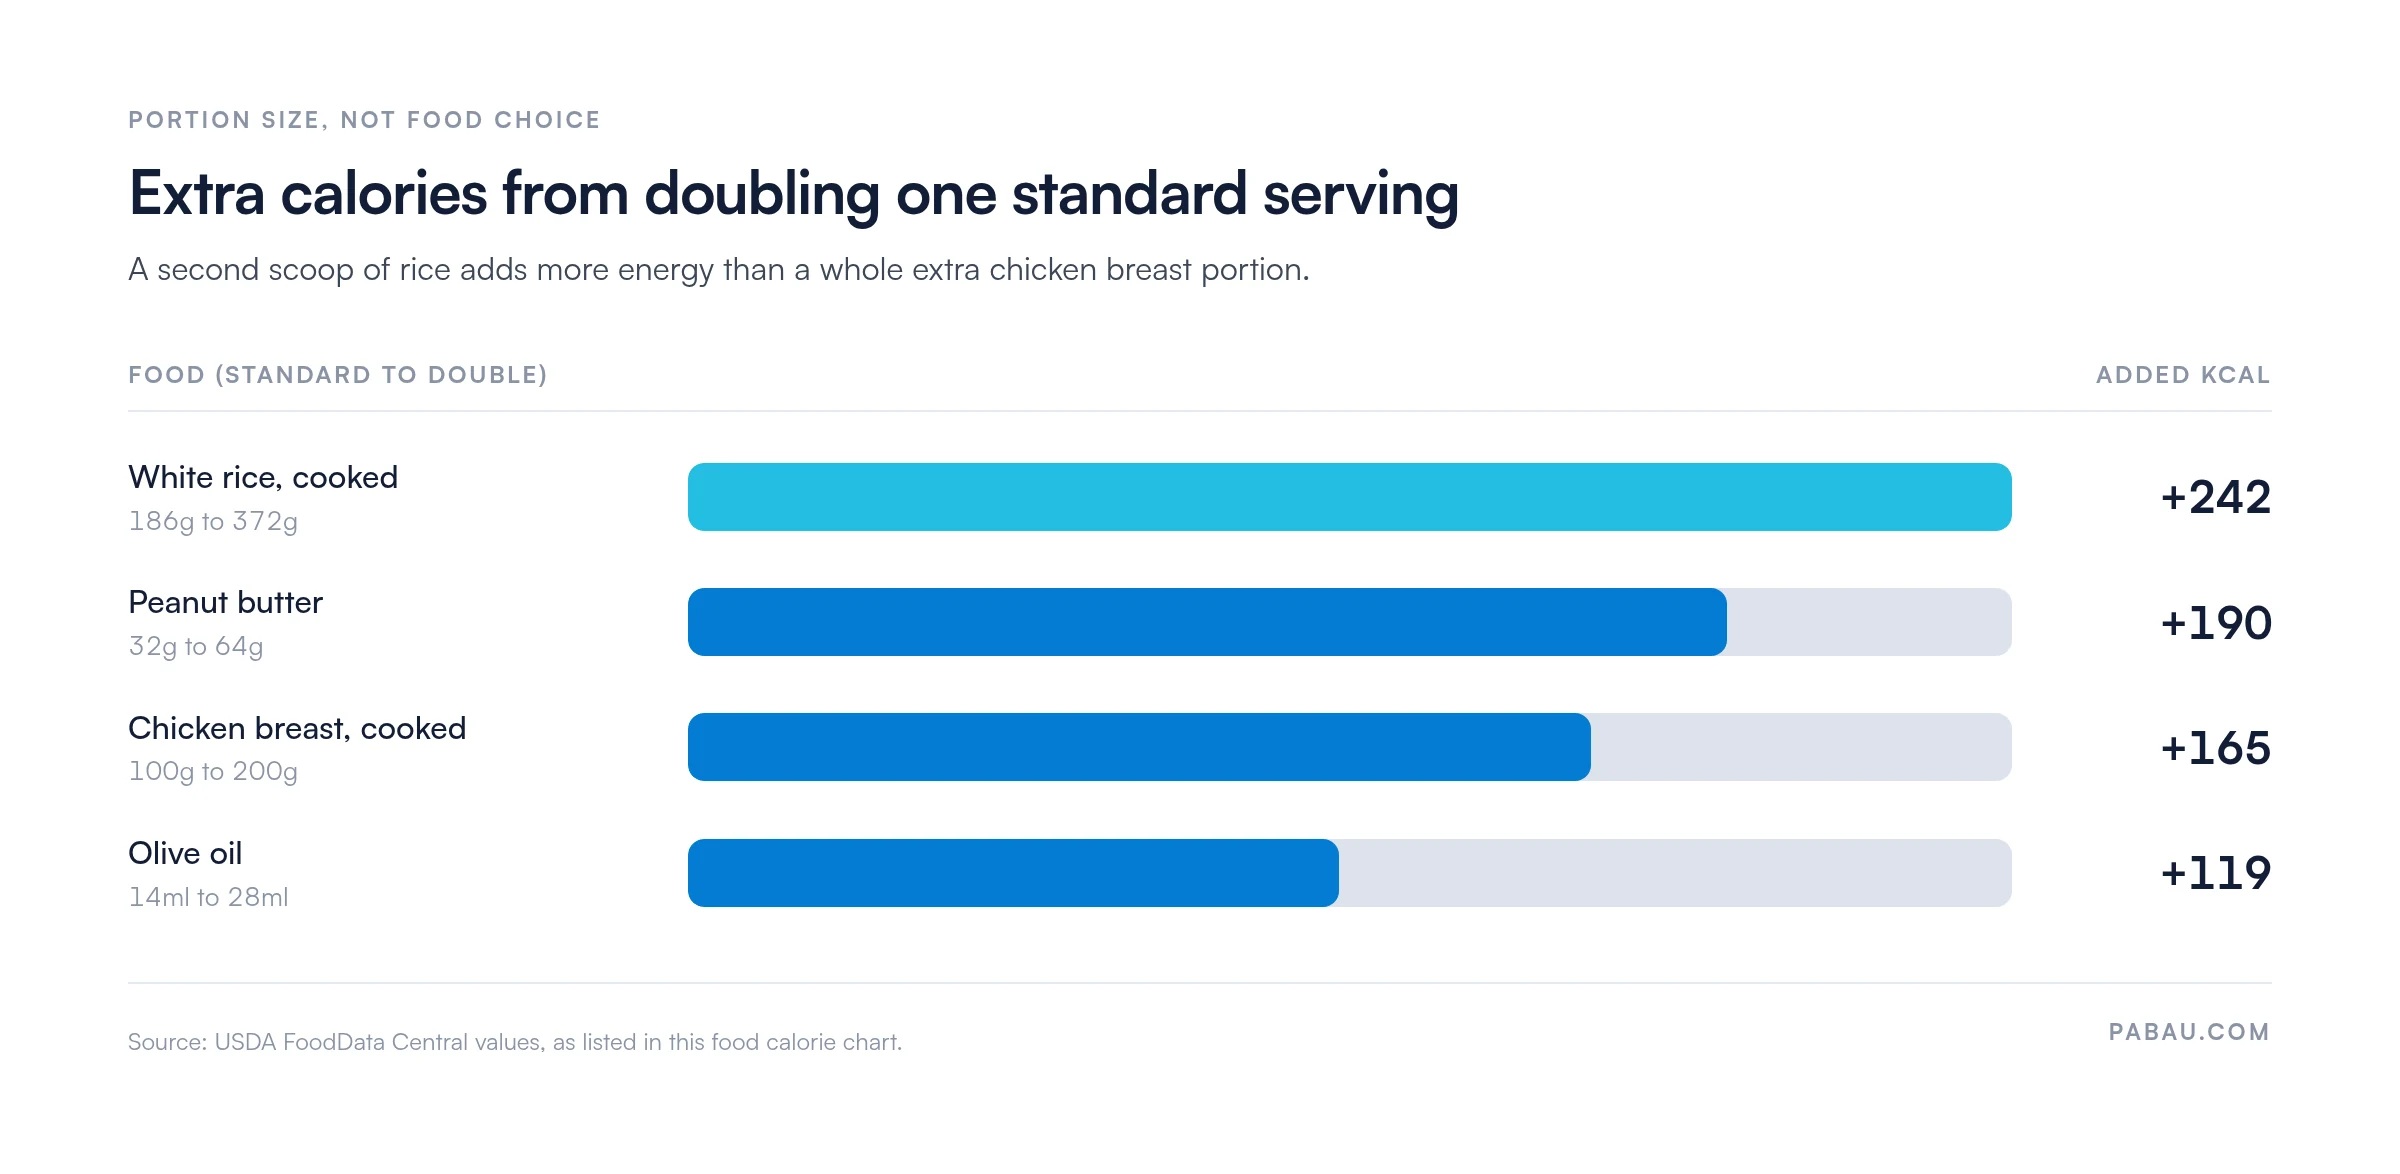
That’s the advantage of a clinical chart over a consumer app. Showing a patient that doubling their rice portion adds 242 kcal is far more memorable than a macronutrient pie chart.
Fast food and Indian takeout come up often in food diaries, so they get their own table. These figures are approximate rather than USDA values. Brands reformulate products, and portions vary by market and restaurant. For current numbers, point patients to the brand’s own nutrition page.
Most adults need between 1,600 and 3,000 kcal a day to maintain their weight, depending on age, sex, and activity level. The ranges below come from the Dietary Guidelines for Americans. They’re maintenance estimates, meaning the intake that holds current weight steady.
UK guidance is simpler. The NHS uses 2,000 kcal a day for women and 2,500 kcal for men as general guidelines.
These are population-level estimates, not prescriptions. Patients with diabetes or thyroid conditions, and those taking weight loss medication, may need different targets. Advise them to set a personalized target with a registered dietitian or their primary care physician.
Used well, the chart links a patient’s food choices to an energy target. Handed over without a plan, it becomes a forgotten leaflet. A deficit of about 500 kcal a day is often quoted as roughly 1 lb of loss per week. That’s a rule of thumb that tends to overestimate loss over time, so set targets under clinical supervision.
Practitioners in well-run weight loss clinics tend to follow the same five steps:
Say a patient logs lunch as chicken, rice, and broccoli cooked in olive oil. From the chart, 100g of cooked chicken breast is 165 kcal and a cup of cooked white rice is 242. A cup of broccoli adds about 31, and a tablespoon of olive oil adds 119.
That’s 557 kcal, and the oil alone is over a fifth of it. If the diary only says “chicken and rice,” the estimate drops to 407 kcal and misses 150. Once the target is clear, a 7-day nutrition plan turns it into a week of meals.
Most tracking errors come from measuring habits, not food knowledge. Patients who know which foods are calorie-dense often underestimate their intake anyway. These fixes target the usual causes.
A two-minute handover decides whether the chart gets used. Run through these points before the patient leaves:
The chart earns its place well beyond dedicated weight loss programs. These practice types use it most:
In many practices, the calorie chart is a paper handout. The food diary comes back on paper too, notes go into a separate document, and weight sits in a spreadsheet. By the third visit, the full picture is spread across three places.
Pabau, the practice management platform we build, keeps those pieces together. Its digital intake forms go out before the first appointment, so patients complete their food diary at home. Completed forms and consultation notes then sit in the patient’s medical records.
At each follow-up, measurements tracking logs weight and body measurements, so you can set dietary changes against results. Pabau Scribe, our AI scribe, can draft the consultation note while you talk, which cuts typing after the session.
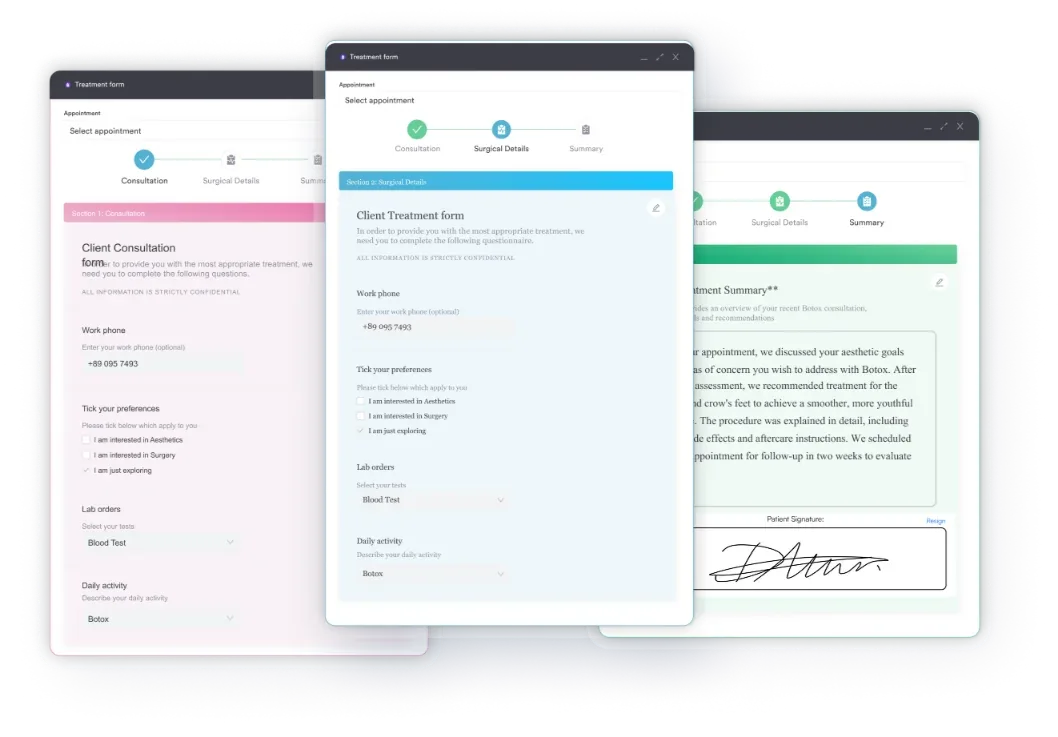

Pabau sends intake forms before the visit and stores food diaries and consultation notes in the patient record. It also tracks measurements at every follow-up.

A calorie chart earns its place when it’s tied to a target and a follow-up date. Start with a three-day diary, check portions before food choices, and weigh food in the state the chart lists.
Treat every total as an estimate. The 500 kcal rule overstates loss over time, so judge progress by measurements across several visits rather than one week on the scale.
Book a demo to see how Pabau keeps food diaries, dietary reviews, and measurements together for your weight management patients.

Ready to turn a target into meals? 1200 calorie diet plan gives patients a structured template for a supervised calorie deficit.
Planning a month-long program? 30-day meal plan for weight loss lays out four weeks of meals you can adapt per patient.
Need to track progress between visits? Weight loss measurement chart records weight and body measurements at each follow-up.
Using BMI to set goals? Body mass index assessment explains the formula, the ranges, and where BMI falls short.
Choosing software for your practice? Best EMR for weight loss clinics compares seven platforms on charting, programs, and follow-up.
Yes. The free PDF near the top of this page is a one-page A4 patient form. It records age, weight, activity level, and a daily calorie goal, plus servings of 18 common fruits and vegetables. Use the tables on this page for calorie values.
On food labels and charts, they mean the same thing. A food Calorie is one kilocalorie (kcal), the energy needed to warm 1 kg of water by one degree Celsius. UK and EU labels also show kilojoules, and 1 kcal equals 4.184 kJ.
Protein and carbohydrates provide about 4 kcal per gram, fat about 9, and alcohol about 7. That’s why oils and drinks add up fast. Alcohol rarely appears on food charts, so ask patients to log drinks separately.
Each source uses different databases, product versions, and rounding rules. US rules also let a product’s calorie content run up to 20% above the label. Small differences are normal, so pick one reference and use it consistently.
Start from your maintenance intake and eat a little less. A 500 kcal daily deficit is often quoted as about 1 lb a week. That’s a rule of thumb that tends to overestimate loss over time, so review targets with a clinician.