Blood type O food list
A blood type O food list sorts foods into what people with type O should eat, li...

Last Updated: Oct 6, 2026

The downloadable VSG weight loss chart is a one-page log that records patient details, surgery date, pre-op weight, one dated weight, and comments.
Print one sheet per follow-up visit and file them in order, because the form holds a single weight entry rather than a multi-visit grid.
There is no BMI or excess weight loss field on the sheet, so work those figures out yourself and write them in the comments box.
Most patients lose 60 to 70 percent of their excess body weight within 12 to 18 months, and months one to three are fastest.
Practice management software like Pabau stores weight as a structured field and books the standard follow-ups, so the paper record has a searchable counterpart.
A printable one-page weight log for vertical sleeve gastrectomy follow-up. It records patient name and ID, date of birth, VSG surgery date, pre-VSG weight, one dated weight entry, and a comments box for clinical notes.
Download templateTracking weight after gastric sleeve surgery keeps the clinician and the patient working from the same numbers. This VSG weight loss chart is a printable sheet for recording a patient’s baseline and one follow-up weight. Print a fresh copy for every visit, and the filed sheets build a dated record of progress.
This guide covers what is on the form, how to fill it in, and how to read the numbers it produces. It also sets out the month-by-month figures most VSG patients follow, so you can tell an expected plateau from a result that needs attention.
A VSG weight loss chart is a form for recording a patient’s weight at a set point after vertical sleeve gastrectomy. The surgery removes roughly 75 to 80 percent of the stomach. The remaining sleeve-shaped pouch limits how much a patient can eat at one sitting. Weight is the outcome measure the whole care team watches afterward.
Bariatric practices keep that record for three reasons.
The template is a single printed page with eight fields. It is not an interactive PDF and it does not calculate anything, so you write on it by hand.
There is no BMI field, no built-in excess weight loss calculation, and no grid of future visits. BMI, excess weight loss percentage, and diet phase all go in the comments box, or into the patient’s record in your practice management system.

One sheet per visit keeps each entry legible, and a missed appointment never leaves a half-empty grid in the file. Date every sheet and keep them together, and the sequence reads as a progress record. Note that the date lines are printed in day, month, year order.
The figures below are reference benchmarks for interpreting a patient’s numbers, and they are not part of the printable form. Averages move a long way with starting weight, metabolic rate, dietary adherence, and activity levels.
The fast loss in months one to three reflects both the metabolic effect of surgery and the reduced stomach capacity. By month six, most patients slow down as the body adapts. Setting that expectation early stops a patient from reading a normal plateau as failure.
Excess weight loss percentage measures pounds lost against a patient’s excess weight rather than their total weight. Excess weight is the difference between the pre-op weight and an estimated ideal body weight for that height. The distinction matters, because two patients at the same weight can be very different distances from a healthy range.
Take two men who both weigh 280 lbs before surgery. At 5 feet 6 inches, an estimated ideal weight of 142 lbs leaves 138 lbs of excess. At 6 feet 2 inches, an estimated ideal weight of 190 lbs leaves 90 lbs. If both lose 60 lbs, the first man is at 43 percent EWL and the second at 67 percent. Pounds lost makes the two look identical, and excess weight loss percentage does not.
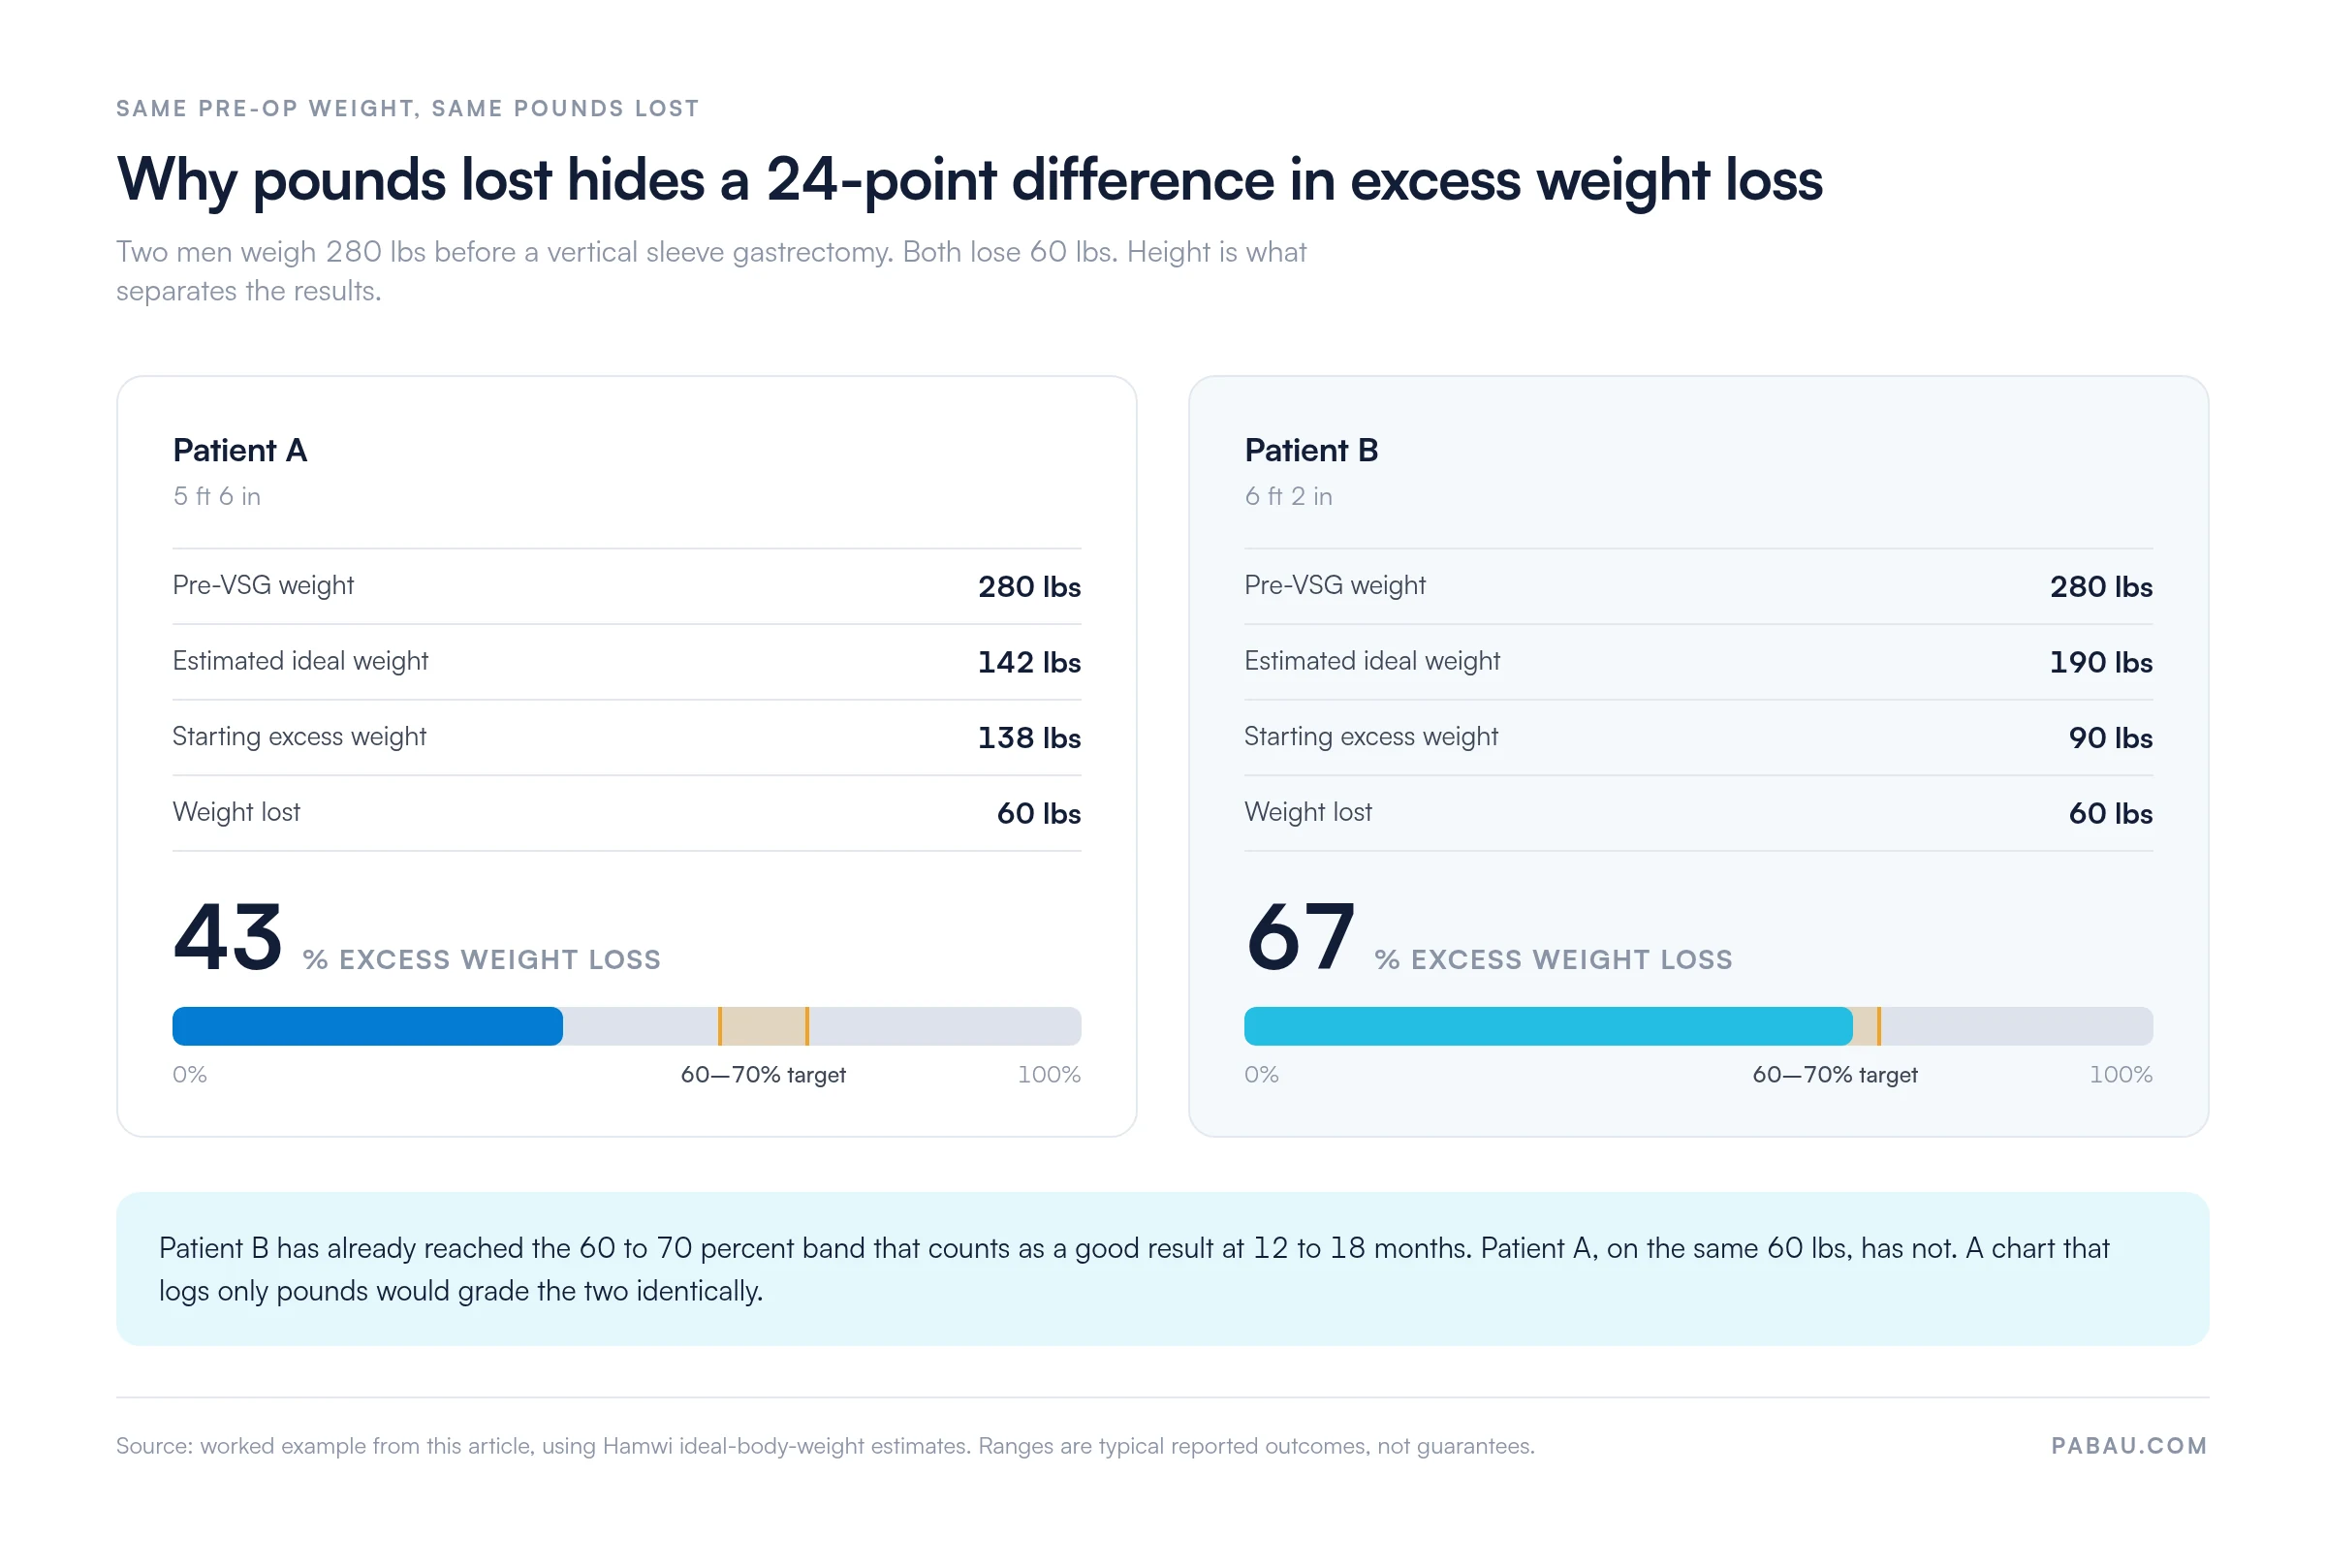
Always measure against the starting excess weight, not against the previous visit. A visit-to-visit calculation produces a small percentage every time and hides how far the patient has actually come.
Stalls are plateaus that last four weeks or longer, and most VSG patients have at least one. A dated run of sheets is what lets you see a stall as it happens rather than at the annual review.
The common windows are weeks three to four after surgery, months three to four as metabolic rate normalizes, and month six onwards as adherence slips. A stall under four weeks is expected. One that runs past eight weeks despite good dietary compliance is worth investigating for thyroid dysfunction, medication effects, or a rare surgical complication.
Population benchmarks are a starting point, and the figures a given patient reaches depend on where they started and what happens after surgery. Personalizing the expectation improves counseling accuracy and patient satisfaction.
Before surgery: starting BMI, age, sex, metabolic rate, and comorbidity burden all shape the result. Patients with a very high starting BMI often lose more total pounds while reaching a lower percentage of excess weight. Older patients tend to lose more slowly than younger ones.
After surgery: dietary adherence carries the most weight, particularly protein targets, portion control, and avoiding liquid calories. Exercise consistency matters too, with 150 minutes of weekly aerobic activity and two resistance sessions a common recommendation. Sleep quality and mental health belong in the same list, since stress, low mood, and disrupted sleep all work against weight loss.
Print the sheet before the visit and complete it while the patient is with you. Six steps cover the whole form.
Give the patient a copy at the end of the visit and file the original in date order. Print a fresh sheet for the next appointment. If you want a running trend rather than a stack of pages, transcribe each weight into the patient’s record as you go.
The table below is on-page reference material rather than part of the download. It estimates ideal body weight by height using the Hamwi method. That is the shortcut most bariatric teams reach for when they need a starting excess weight quickly.
The Hamwi method allows 100 lbs for the first 5 feet of height, plus 5 lbs for every additional inch in women. For men it is 106 lbs plus 6 lbs per inch. The range around each figure is the conventional plus or minus 10 percent used to account for frame size.
Treat these as arithmetic for calculating excess weight, not as clinical targets. Health agencies define a healthy adult weight through BMI, at 18.5 to 24.9. A BMI-based goal is the more defensible one to discuss with a patient.
Set the goal weight with the patient rather than for them. Someone with arthritis may prefer to sit 10 to 15 lbs above the estimate to protect joint function. Someone whose blood pressure and glucose normalize at 55 percent EWL has already reached the outcome that mattered clinically.
Most VSG patients reach their lowest weight between 18 and 24 months. After the first year the sheet stops being about losing weight and starts being about holding it, which is a different conversation. Weight regain in years two and three is common enough to plan for.
Keep recording weight and %EWL at months 18 and 24, then annually. Three things are worth watching at each of those visits.
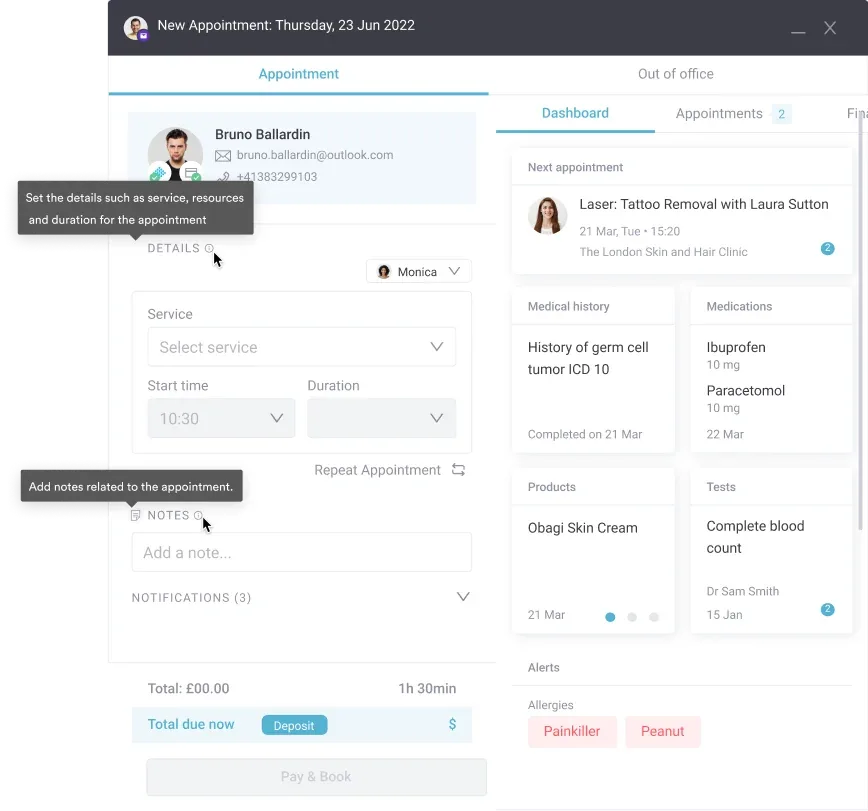
A printed sheet records one visit well. It does not book the next appointment, and a folder of paper will not answer a question about average %EWL across your bariatric caseload.
Practice management software like Pabau covers that side of the work. Automated reminders book patients at the standard VSG intervals of one week, one month, three months, six months, and twelve months. Follow-up then stops depending on someone remembering. Weight and BMI live as structured fields on the patient record. A year of entries can be pulled as a report instead of counted by hand.
The practical outcome is fewer patients lost between visits and a caseload you can report on. For a weight loss practice, that reporting is what turns a drawer of charts into evidence for insurers, accreditation, and your own audits.

Pabau books VSG follow-ups automatically, stores weight and BMI as structured fields, and keeps every visit in one patient record. Your team spends less time chasing appointments and more time with patients.

A weight chart earns its keep through the habit it enforces. Print a one-page sheet for each visit and file them in date order. That record is easier to trust than a grid someone completed from memory two visits later.
Be straight with patients about what the sheet does and does not do. It holds a date and a weight. The %EWL, the judgment about whether a stall matters, and the decision to bring the dietitian back in all come from you. That part is what keeps a patient in the program through the slow months.
Download the template, print a stack, and set the follow-up dates before the patient leaves the room. Book a demo to see how Pabau schedules those visits and keeps every weight entry in one searchable patient record.

Need a structured plan for the post-op diet phases? Bariatric diet plan template sets out the liquid, puree, soft, and normal stages you record in the comments box.
Want a framework for goal-setting conversations? Performing consultations that convert covers how to counsel patients on realistic expectations and personalize a target to their health priorities.
Looking at the drivers of regain after year one? Lifestyle vs pharmacologic interventions in metabolic health explains the hormonal and behavioral factors behind sustained weight loss.
Setting up a new bariatric patient? Bariatric intake form captures the pre-operative history and baseline weight that this chart measures every later figure against.
No. The downloadable sheet records patient details, the surgery date, the pre-VSG weight, one dated weight entry, and comments. Calculate BMI and excess weight loss percentage yourself, then write them in the comments box or store them in the patient record.
Most VSG patients lose 15-35 lbs in the first month, which works out to roughly 3-8 lbs per week. The pace slows to about 2-5 lbs per week across months 2 and 3. Average total excess weight loss is 60-70% within 12-18 months, though results vary by starting weight, age, and adherence.
Men often lose more total pounds in the first months, largely because they start heavier and carry more lean mass. Percentage of excess weight lost tends to converge by 12 to 18 months. Compare each patient against their own starting excess weight rather than a mixed-group average.
A realistic goal is 60 to 70 percent excess weight loss within 12 to 18 months. Most patients reach their lowest weight between months 18 and 24. The more meaningful goal is the weight at which a patient’s comorbidities improve. Blood pressure, glucose, and joint pain often respond before the population average target is reached.
Track weight and excess weight loss percentage at months 1, 3, 6, 12, 18, and 24, then annually. Most practices move to annual follow-ups after 24 months. Continued monitoring catches weight regain early, while it is still small enough to act on.