Vegan based diet plan: Free template and nutrition guide
A vegan based diet plan is a structured dietary plan that builds every meal arou...

2
Last Updated: Oct 14, 2026
A preemie weight chart tracks a premature baby’s weight, length and head circumference against a preterm growth reference, most often the Fenton 2013 chart. Each measurement is plotted by post-menstrual age rather than weeks since birth, so the percentile reflects the baby’s stage of development.
NICU teams, neonatologists and pediatricians use the chart to spot poor weight gain early and guide feeding decisions. The free template below gives you a row for every visit, from birth through post-discharge follow-up.
A printable chart for logging weight, length and head circumference in premature infants against the Fenton growth reference. It has fields for gestational age, corrected age, percentiles and clinical assessment notes.
Download template
A preemie weight chart plots weight, length and head circumference against the Fenton 2013 preterm reference, using post-menstrual age rather than chronological age.
NICU preemies should gain about 15-20 g/kg/day, roughly 160-210 g a week at 1,500 g, and gain below that range calls for a feeding review.
Use the Fenton chart until 50 weeks post-menstrual age, then switch to the WHO growth standards with corrected age, usually until age 2.
In Pabau, the practice management platform we build, digital forms and Pabau Scribe, our AI scribe, record growth assessments straight into the patient record.
A preemie weight chart is a clinical record of repeated weight, crown-heel length and head circumference measurements for a premature infant. Head circumference is also called occipito-frontal circumference (OFC). Each measurement is mapped onto percentile curves from the Fenton 2013 reference, which draws on data from nearly 4 million preterm births in six countries.
The main difference from standard infant charts is the age you plot against. Post-menstrual age is gestational age at birth plus chronological age, and it runs along the Fenton chart’s horizontal axis. Corrected (or adjusted) age is chronological age minus the weeks born before the due date. Take a baby born at 28 weeks who is now 16 weeks old. Their corrected age is 4 weeks, and their post-menstrual age is 44 weeks, as the timeline below shows.
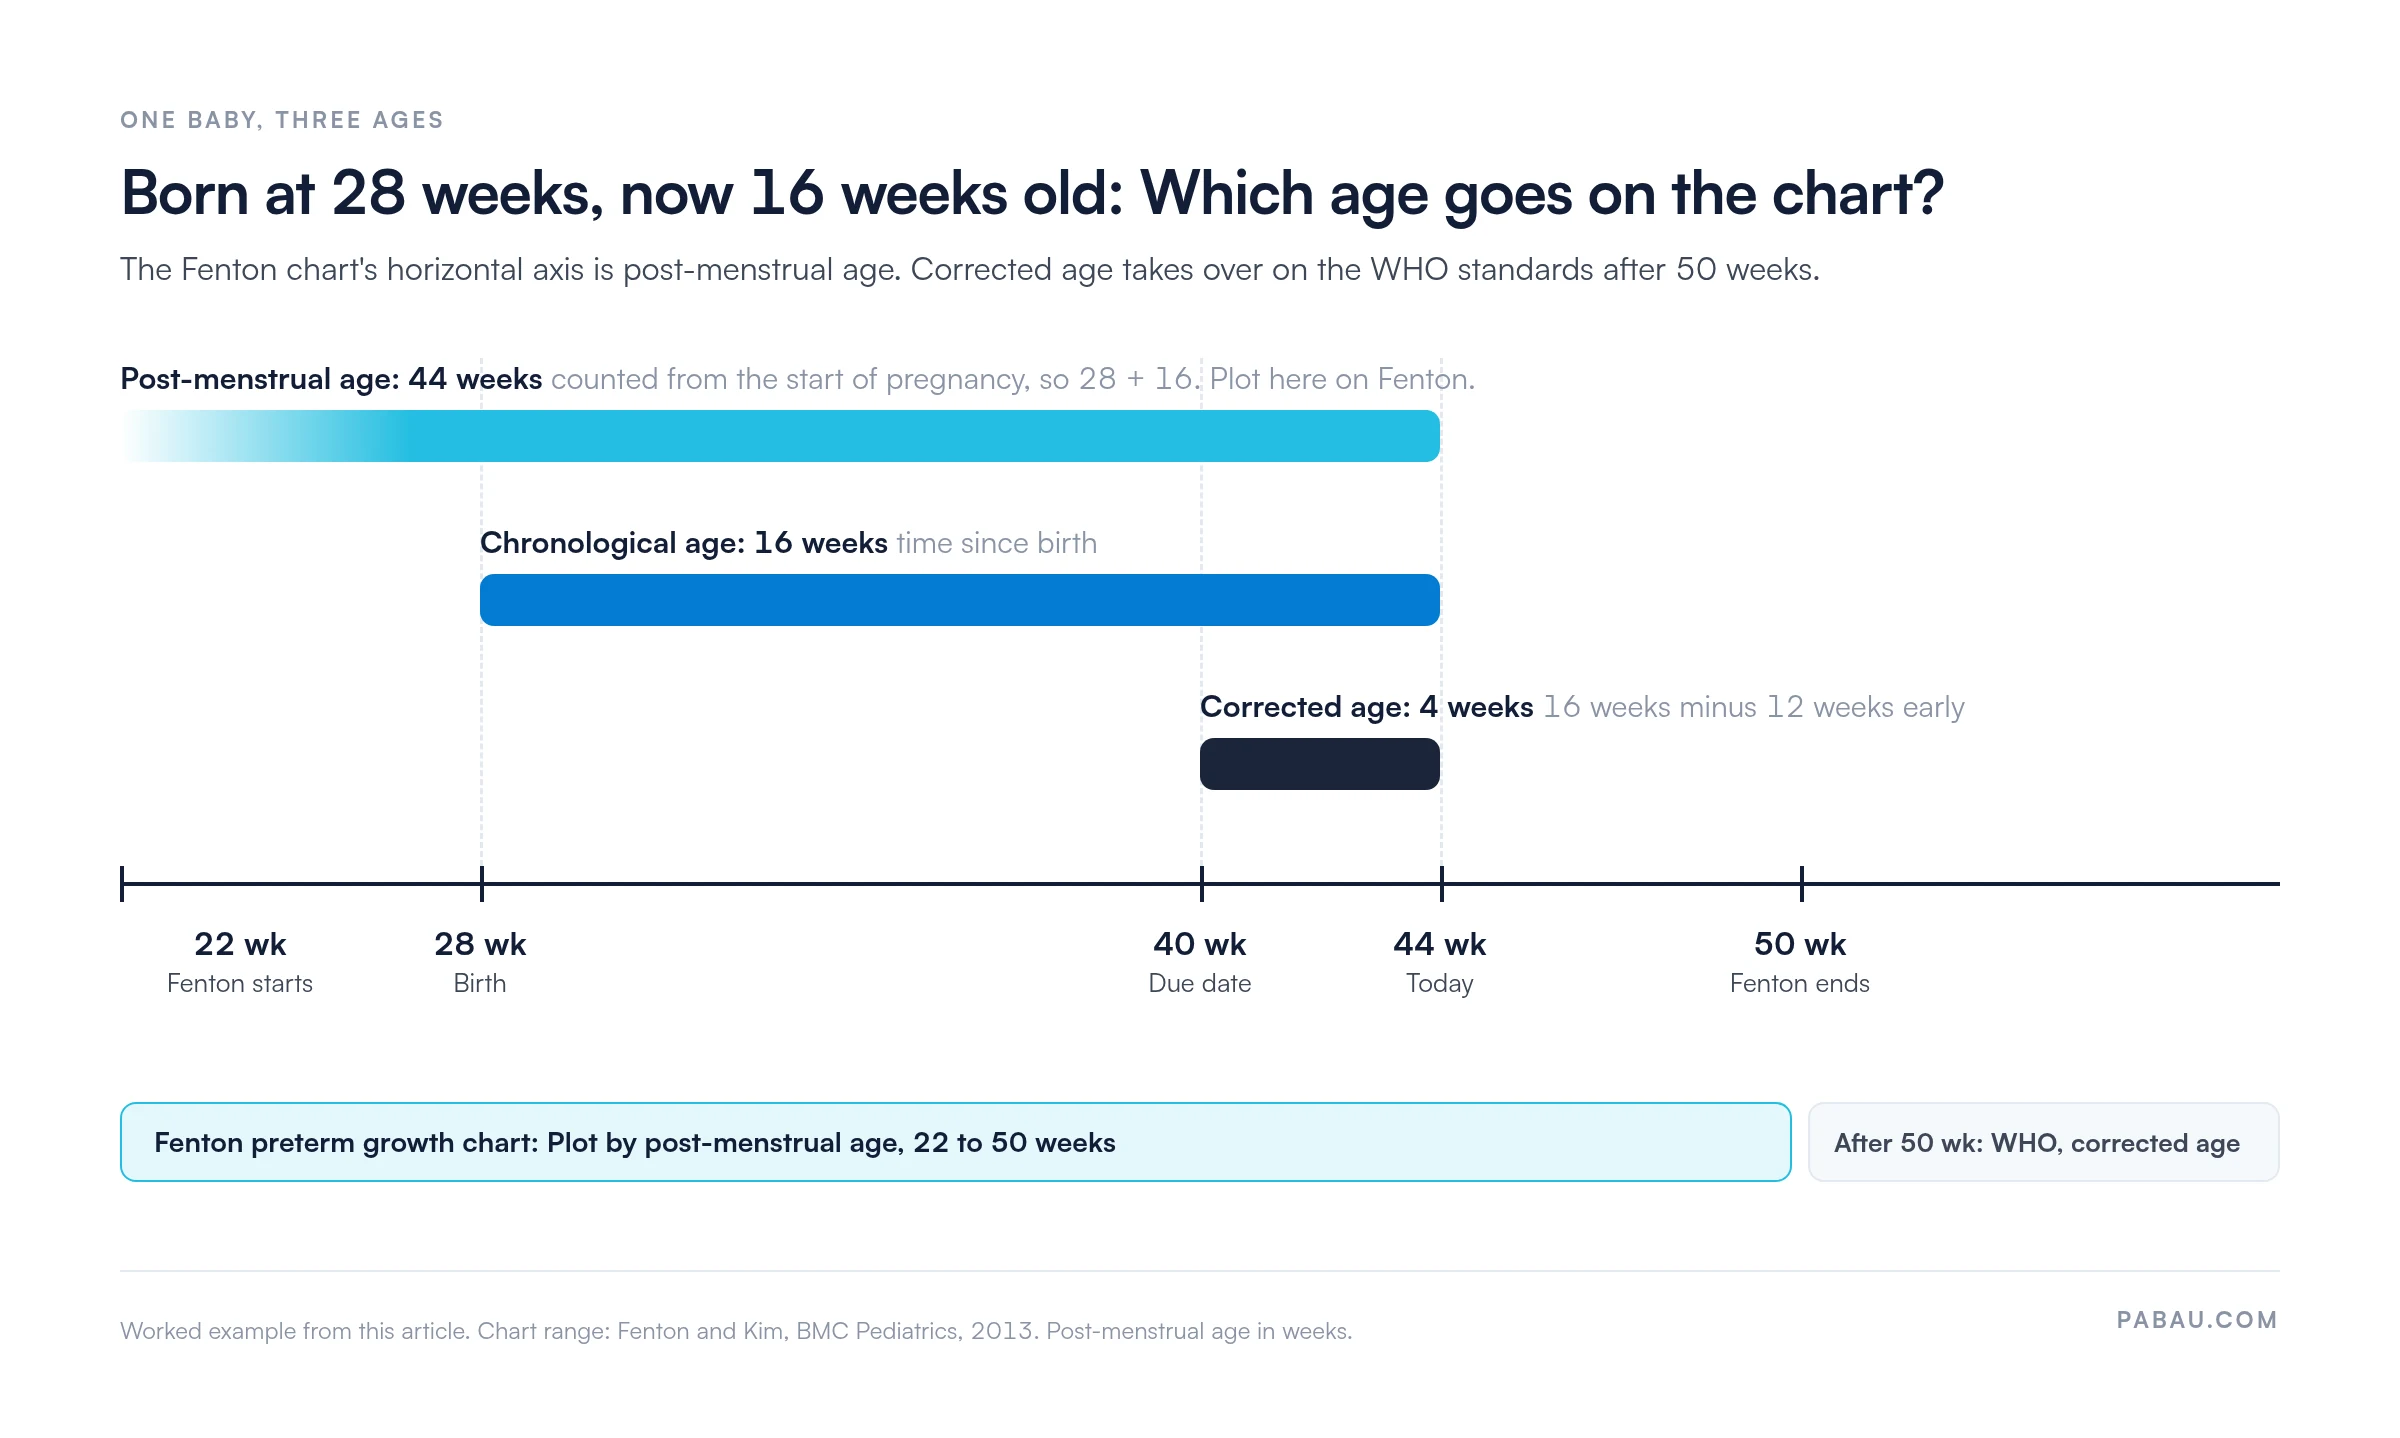
Why this matters: Premature infants follow different growth curves than term infants. Plotted on a standard newborn chart, a micro preemie’s normal growth could be wrongly flagged as failure to thrive. A preemie chart avoids that mistake and gives you objective data for nutrition decisions. It also helps you reassure families that their baby is growing as expected.
Premature infants are classified by birth weight and gestational age. The category guides clinical management, the level of NICU care and growth expectations.
The Fenton growth chart is the most widely used reference for preterm infant growth worldwide. It was published by Tanis R. Fenton and Jae H. Kim in 2013 in BMC Pediatrics. The chart covers infants from 22 weeks gestational age through 50 weeks post-menstrual age, which is about 10 weeks past term.
The Fenton chart gives percentile curves for weight, length and head circumference, in separate versions for boys and girls. Boys and girls grow along slightly different trajectories, so the sex-specific curve prevents false alarms about growth.
The process is simple, but the age calculation has to be exact.
NICU clinicians track weight gain velocity, which is how fast an infant gains relative to body weight. It guides nutrition decisions and shows when feeds need adjusting. The usual NICU target is 15-20 g/kg/day, and the table turns it into grams per week at three common weights.
*Weekly gain = current weight in kg × daily target × 7. Your unit’s protocol may set different targets.
Inadequate gain means crossing percentile curves downward, or sitting below the 10th percentile for more than one measurement. It warrants investigation. Common causes include low feeding volume, malabsorption and metabolic stress. A structured chart makes the trend visible early, so you can act sooner.
After the NICU, growth monitoring moves to outpatient pediatrics. Keep plotting on the Fenton chart until 50 weeks post-menstrual age. After that, switch to the WHO growth standards using corrected age, usually until age 2, or follow your center’s protocol. Our pediatric growth chart calculator template covers plotting against those standards.
Catch-up growth is the faster gain many preterm babies show after discharge. Most show it over the first 2-3 years, moving toward their own genetic growth trajectory. Extremely preterm and ELBW infants may stay below the 50th percentile.
Using the same chart in follow-up keeps continuity with the NICU record and cuts missing data. Many pediatric and family practices run connected primary care software, which keeps the discharge weights and every later visit in one record.
NICU staff record weight in grams, while parents often want pounds and ounces. A conversion reference on your template removes manual math and cuts transcription errors.
NICU clinical teams (neonatologists, nurse practitioners and registered nurses) use it for daily weight checks, feeding decisions and nutrition assessment in hospitalized preterm infants.
Pediatricians and family medicine clinicians in primary care and follow-up practices use it to track post-discharge growth and confirm catch-up is on course.
Midwives and child health nurses in community settings use it as families move from hospital to home, so growth records stay continuous.
Pediatric nurse practitioners and neonatal nurse specialists rely on it for standardized assessment. It keeps growth monitoring documented the same way at every visit, which holds up well in a chart review.
Standardized documentation. A structured template has every clinician record weight, age and percentile in the same format. That cuts transcription errors and makes trends across visits quick to spot.
Audit readiness. Documented growth monitoring supports audit and inspection evidence. Local NICU protocols set the requirements.
Clinical safety. Plotted percentiles show inadequate gain or worrying trends faster than a column of raw numbers. Early detection means feeds can be adjusted, or underlying causes investigated, sooner.
Family communication. Visible growth curves reassure parents that their preemie is progressing. They give you concrete evidence to discuss at follow-up visits, in a form families understand.
The downloadable template is built for direct use in NICU and pediatric settings.
Many follow-up practices still keep the growth chart on paper, or as a PDF scanned into the record. Each weight then sits apart from the visit note that explains it.
In Pabau, the practice management platform we build, you can rebuild the chart as one of your digital forms. Entries sync to the patient record, so weight, age and percentile sit beside every visit.
Pabau Scribe, our AI medical scribe, drafts the clinical note from the consultation. The reasoning behind a feed change is written at the time of the measurement, which strengthens the record if the chart is ever reviewed.

Pabau keeps digital growth forms, clinical notes and Pabau Scribe in the same patient record. Your follow-up team sees the whole growth trend at every visit.

A preemie weight chart is only as reliable as the age you plot against. Use post-menstrual age on the Fenton chart until 50 weeks, then corrected age on the WHO standards. Write the age you used on every row.
Then judge growth across visits. One low reading can be scale noise, while two readings that cross percentile lines downward call for a feeding review.
Download the template, add your unit’s own gain targets and escalation steps, and keep it with the visit notes. Book a demo to see how Pabau keeps preterm growth checks and clinical notes together for your follow-up team.

Moving past 50 weeks post-menstrual age? Pediatric growth chart calculator template shows how to plot weight, height and head circumference against age- and sex-matched references.
Managing newborn jaundice alongside growth? Infant bilirubin chart sets out phototherapy thresholds by age in hours and gestational age.
Checking development at follow-up visits? Infant reflexes chart lists the seven primitive reflexes and when each should integrate.
Triaging a skin concern in an infant? Pediatric rash chart matches morphology, location and age of onset to likely conditions.
Normal weight for a premature baby depends on gestational age and sex. At 28 weeks, many babies weigh 1,000-1,500 g (2 lbs 3 oz-3 lbs 5 oz). At 32 weeks, the range is about 1,500-2,000 g (3 lbs 5 oz-4 lbs 7 oz). Plot the birth weight on the sex-specific Fenton chart at the baby’s gestational age to find the percentile. Babies between the 10th and 90th percentiles are considered within the normal range for their age.
Weigh the infant at the same time each day, usually before an early-morning feed, on the same calibrated scale in grams. Plot each weight on the preemie weight chart at the infant’s post-menstrual age. Then work out gain velocity in grams per kilogram of body weight per day. Gain below 15 g/kg/day suggests feeding needs review.
The Fenton 2013 growth chart is a preterm growth reference with percentile curves for weight, length and head circumference. It runs from 22 to 50 weeks post-menstrual age. Clinicians plot each measurement at the infant’s post-menstrual age and read the nearest percentile curve. The chart comes in separate versions for boys and girls.
A preemie in the NICU should gain about 15-20 g/kg/day. For a 1,500 g infant, that is roughly 160-210 g per week. After discharge, aim for gain that keeps the infant on, or climbing toward, the same percentile curve. Poor gain calls for a feeding review or a check for malabsorption or other medical causes.
One pound equals 453.6 grams, and one ounce equals 28.35 grams. Divide grams by 453.6 to get pounds, then multiply the decimal part by 16 to get ounces. For example, 1,500 g divided by 453.6 is 3.31 lbs, which is 3 lbs 5 oz. A conversion table printed on your template speeds this up.
Most premature babies show catch-up growth over the first 2-3 years, moving toward their own genetic growth trajectory. Extremely preterm and extremely low birth weight babies may stay below the 50th percentile. Use the Fenton chart until 50 weeks post-menstrual age. After that, plot on the WHO growth standards using corrected age, usually until age 2.