Medical disclaimer template: 6 clauses + free PDF
A medical disclaimer is a legal statement that your health content is educationa...

2
Last Updated: Oct 12, 2026
A normal ECG values chart lists the expected range for every measurement on an electrocardiogram, so you can spot an abnormal tracing at a glance. A resting adult’s normal heart rate is 60–100 bpm, with a PR interval of 120–200 ms and an axis between −30° and +90°. QRS duration stays under 110 ms in men and 100 ms in women, and QTc tops out around 450 ms and 470 ms respectively.
Children run on different numbers. Their heart rates are higher, their PR and QRS limits are lower, and their QT values shift with age and rate. Our free PDF covers both groups, and this guide walks through the reading order clinicians use to apply it.
A one-page reference of adult and pediatric normal ranges, from heart rate and PR interval to QT/QTc, ST segment and cardiac axis. Print it for the ECG room, or save it to your practice’s digital records.
Download template
In adults, a normal ECG shows a heart rate of 60–100 bpm and a PR interval of 0.12–0.20 s. QRS duration stays under 110 ms in men and 100 ms in women.
Every value assumes the standard 25 mm/s paper speed and 10 mm/mV calibration. At those settings, one small box is 0.04 s and one large box is 0.2 s.
Pediatric ECG values differ substantially from adult ranges, with higher heart rates and shorter PR intervals. Pediatric QT/QTc is age- and rate-dependent rather than simply shorter, so compare every child against an age-stratified chart.
Practice software such as Pabau lets you record ECG findings in custom forms and notes, keeping them in the patient record for compliance audits.
It is a clinical reference table that defines the expected range for every measurable parameter on a 12-lead electrocardiogram. A measurement outside its range signals a possible abnormality that needs clinical correlation and, often, further investigation.
The ranges draw on guidance from the American Heart Association (AHA), the American College of Cardiology (ACC), and the European Society of Cardiology (ESC). These bodies publish slightly different limits, based on different populations and correction formulas. Whichever chart you use should name its source standard.
A complete chart covers 10 parameters. These are the adult resting values this guide and the PDF use.
The chart works best inside a fixed reading order: rate, rhythm, axis, intervals, then morphology. Following the same sequence every time means no parameter gets skipped.
After the intervals, compare P and T wave shape with the chart’s lead-specific norms, and check for ST elevation or depression. When ST changes appear alongside chest pain, a troponin levels chart helps you judge whether the biomarkers support myocardial injury. Correlate any abnormal value with the patient’s history, symptoms and prior ECGs before deciding it matters.
Any clinician who orders, reads or documents ECGs gets value from a shared set of reference ranges. The main users are:
In primary care, the chart earns its place at annual physicals and pre-operative visits, where one physician may read several ECGs a day. If your practice is comparing primary care software, check that ECG findings can be recorded in the same patient file as the visit.
Applying adult values to a child is one of the most common errors in ECG interpretation. Children have higher resting heart rates, faster conduction and different chamber proportions. Read a child’s ECG against an adult chart and normal findings start to look abnormal.
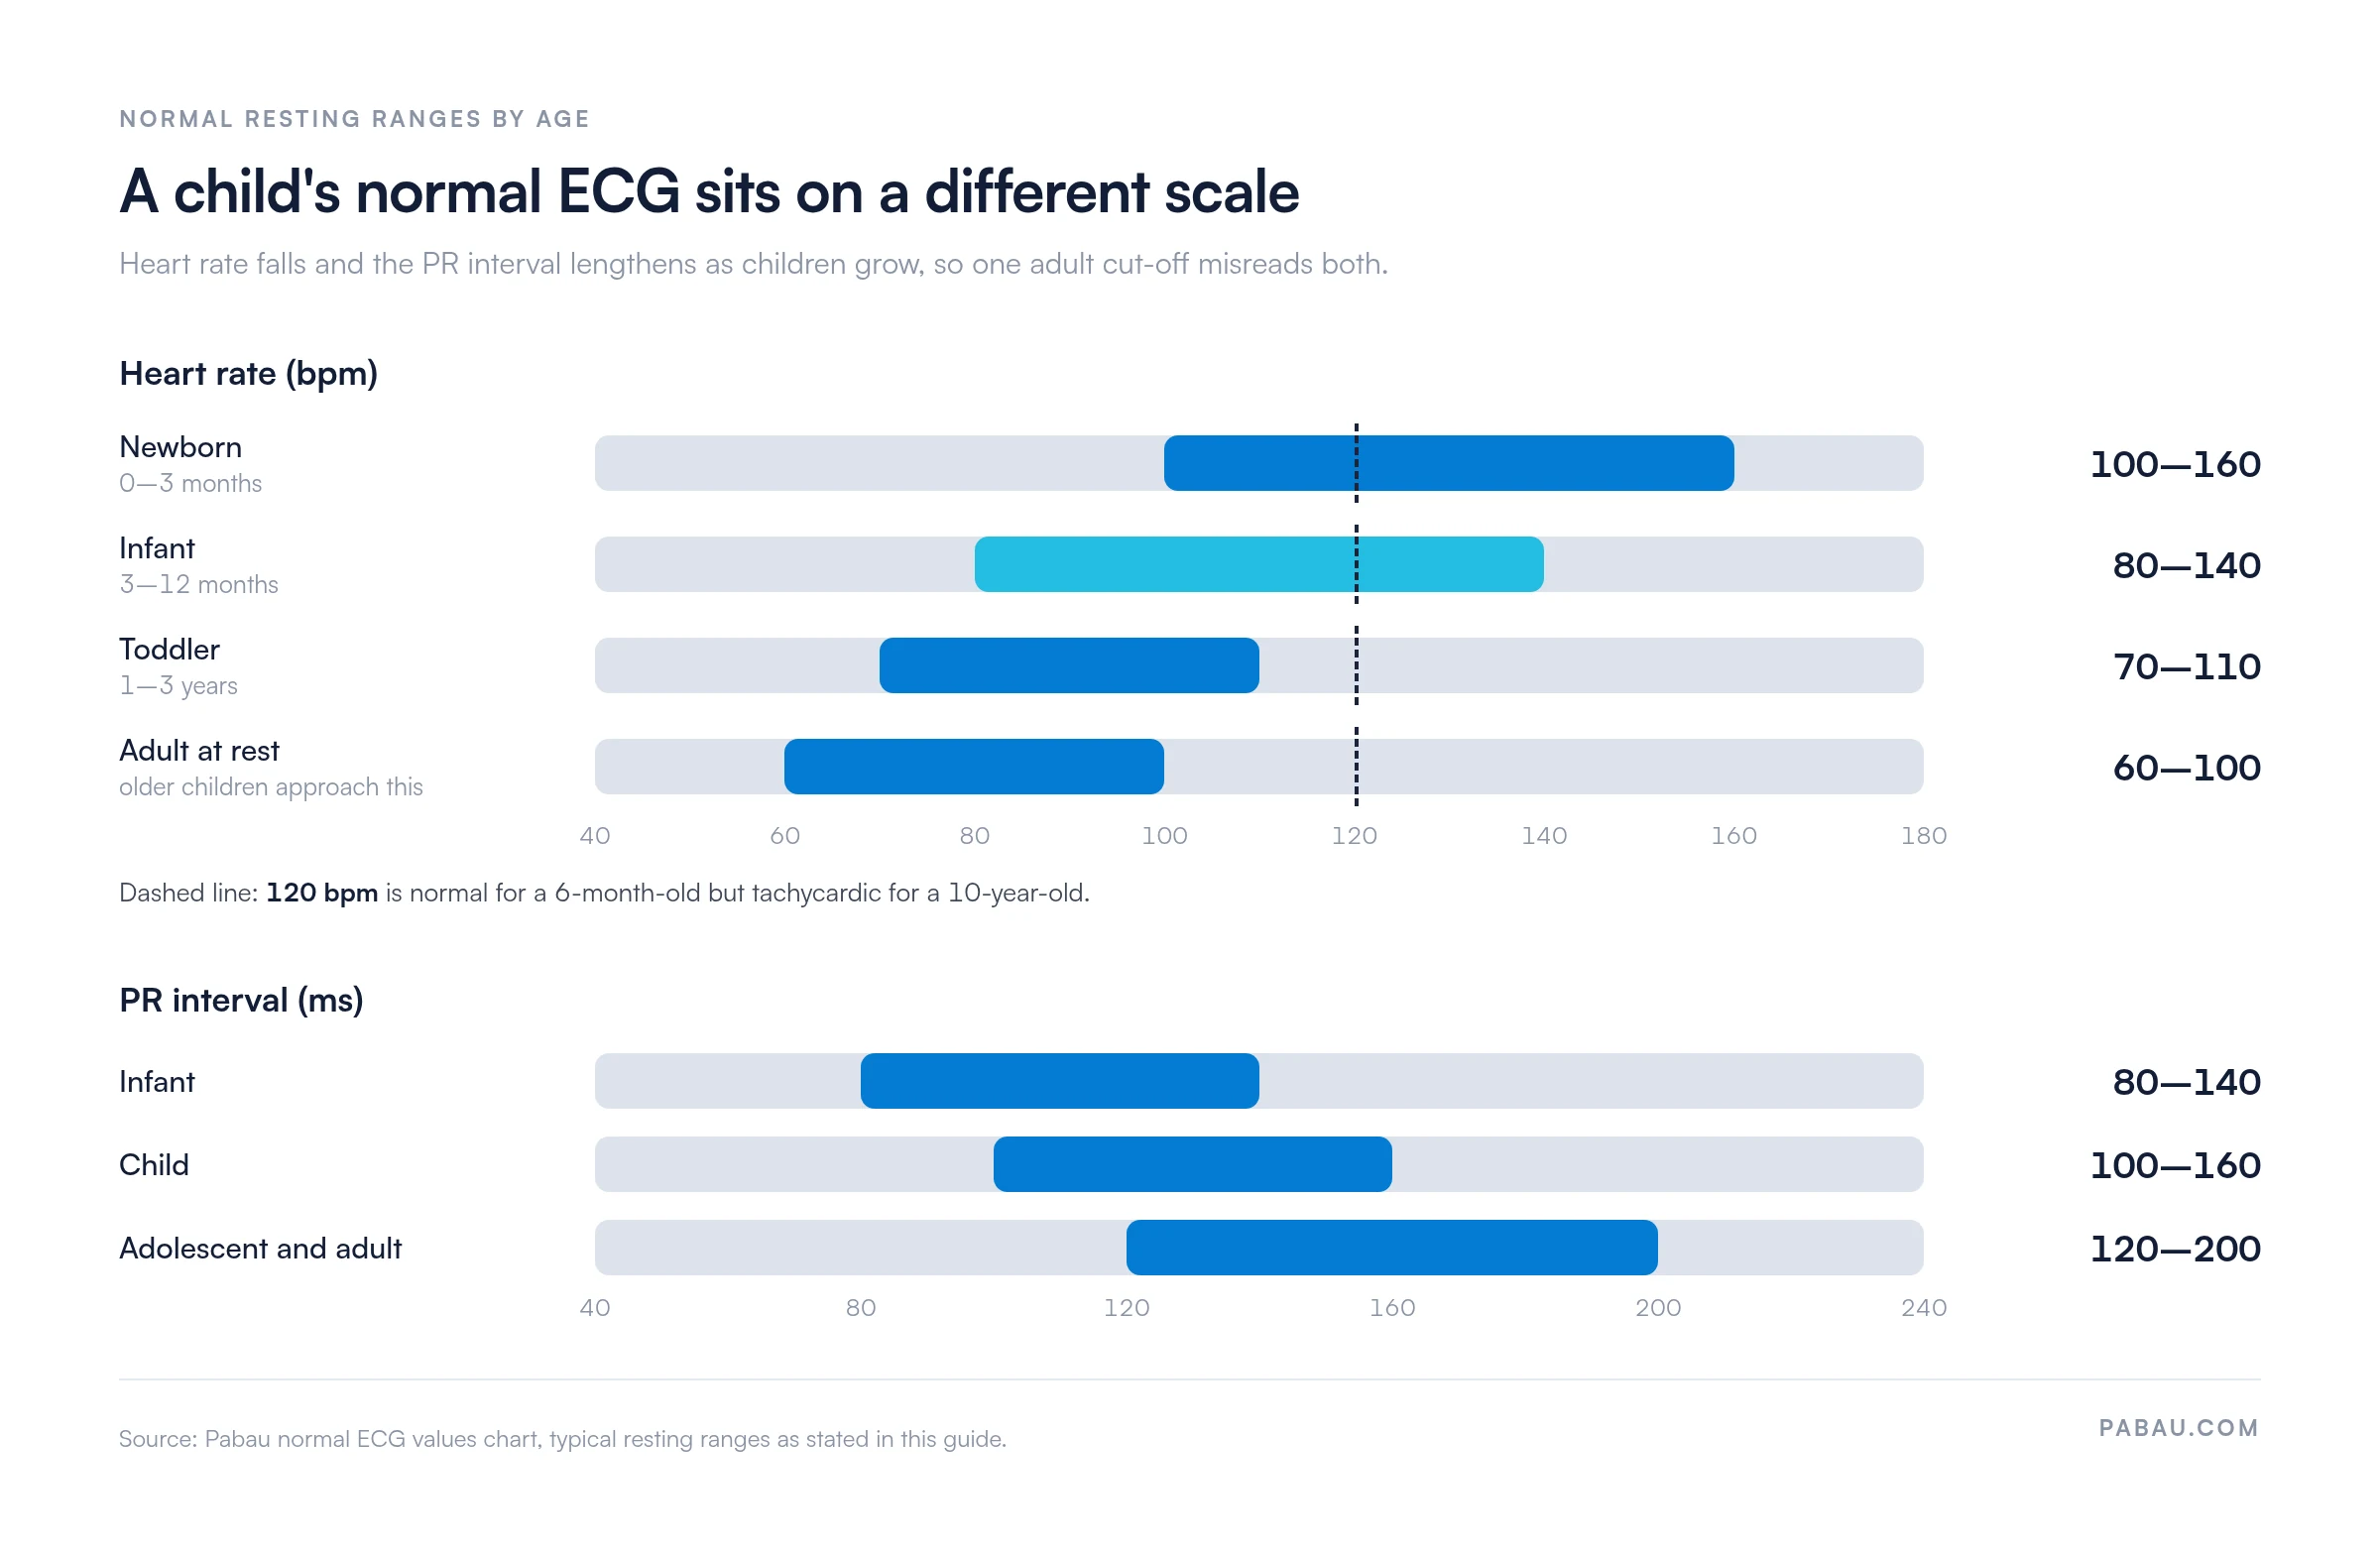
Heart rate. Newborns (0–3 months) run at 100–160 bpm, infants (3–12 months) at 80–140 bpm, and toddlers (1–3 years) at 70–110 bpm. Older children approach the adult 60–100 bpm. A rate of 120 bpm is normal in a 6-month-old but tachycardic in a 10-year-old.
PR interval. It is shorter in children because conduction is faster. Infants measure 0.08–0.14 s, children 0.10–0.16 s, and adolescents reach the adult 0.12–0.20 s. Don’t apply the adult threshold to a child under 12. The chart below plots both sets of bands on one scale.
QRS duration. The QRS is narrow in children, and its upper limits are lower than in adults. Infants stay under 0.08 s, children under 0.09 s, and adolescents under 0.10 s, close to the adult 0.10–0.11 s. A QRS of 0.10 s is borderline in an adult but prolonged in a 5-year-old.
QT interval. It depends heavily on age and rate in children. Infants have relatively longer QT intervals, with QTc up to 440 ms, and the interval shortens progressively through childhood. Adolescents approach the adult QTc limits of about 450 ms in men and 470 ms in women. Always correct the QT before comparing a child’s value.
A full pediatric reference should give each age band its own table. Pair it with a pediatric vital signs chart so heart rate, breathing and blood pressure are judged against the same age band.
Record your ECG measurements in a consistent format within your clinical note. You can build custom fields in Pabau’s digital forms to capture heart rate, PR interval, QRS duration, QTc interval, and cardiac axis. Check each value against this chart as you enter it, and add a note on clinical correlation for any value outside the normal range. A consistent format makes compliance audits faster and cuts documentation errors.
In many practices, ECG findings end up scattered. Some sit in a free-text note, some on a scanned printout, and some on a paper form filed with the tracing. Comparing this year’s QTc with last year’s then means digging through all three.
Pabau, the practice management platform behind our software for GP practices, lets you build your own ECG form in its digital forms builder. Add a field for rate, rhythm, PR interval, QRS duration, QTc and axis, and the completed form is saved to the patient record.
The next clinician sees the previous intervals before reading a new tracing. If you prefer to dictate your interpretation, Pabau Scribe, our AI scribe, turns what you say into a clinical note. That way, you aren’t retyping findings at the end of the day.

Build custom forms and clinical notes in Pabau to record ECG findings, intervals and interpretations your way. Each entry stays on the patient record, ready for audits and follow-up.

Use the chart as a first filter. A value outside its range shows you where to look, and the patient’s history, symptoms and prior tracings tell you what it means.
Two habits keep it reliable. Check paper speed and calibration before you measure, and compare children only against their own age band. Skipping either one can turn a normal tracing into a false alarm.
Print the chart for the ECG room, and record each reading the same way every time so trends stand out across visits. Pabau lets you record ECG findings in your clinical notes alongside the rest of the patient file. Book a demo to see how it keeps your ECG documentation consistent and audit-ready.

Managing a patient with chest pain? Chest pain nursing care plan structures the assessment, interventions and evaluation for a cardiac presentation.
Need to link heart rate to pump function? Cardiac output equation explains how heart rate and stroke volume combine, with normal ranges.
Monitoring heart rate at rest? Sleeping heart rate chart sets out normal resting ranges by age.
Checking the rest of the vital signs? Normal blood pressure chart lists the reference blood pressure categories to record next to the ECG.
Following up an abnormal ECG with an echo? Normal ejection fraction by age chart gives the reference ranges for reading the result.
A normal ECG reading means every measured parameter falls within its expected range for the patient’s age and sex. That covers heart rate, PR interval, QRS duration, QT/QTc interval, cardiac axis and waveform shape. The rhythm is regular normal sinus rhythm, with no ST elevation, ST depression or T wave abnormalities.
Normal PR interval is 0.12–0.20 seconds (120–200 milliseconds) in adults. A PR interval longer than 0.20 s indicates first-degree atrioventricular block. Children have shorter normal PR intervals, from 0.08–0.14 s in infants to 0.10–0.16 s in older children. Always use age-appropriate values when interpreting pediatric ECGs.
Normal QRS duration in adults is less than 110 ms in men and less than 100 ms in women. A QRS of 120 ms or more is considered widened and suggests a bundle branch block or other conduction delay.
The QT interval varies with heart rate, so it must be corrected (QTc). Using the Bazett correction, typical adult QTc upper limits are about 450 ms for men and 470 ms for women. A QTc above 500 ms is considered prolonged and is associated with arrhythmia risk. Check which correction formula your laboratory uses, because Fridericia and other formulas give different values.
Normal sinus rhythm means regular P-P and R-R intervals at a rate of 60–100 bpm. Each QRS complex is preceded by one upright P wave in leads II, III and aVF, and the PR interval is 0.12–0.20 s. Irregular intervals, missing P waves or an abnormal rate point to an arrhythmia that needs further assessment.
Your ECG is normal if the report reads “normal sinus rhythm” or “within normal limits.” That means every interval and amplitude falls within the reference range for your age and sex. It also means there are no ST segment changes or T wave inversions, and the cardiac axis is normal. If any value is flagged, ask your clinician what it means and whether you need follow-up testing.