HD Brows consultation form: Free template and guide
HD Brows is a seven-step brow treatment that combines consultation, tinting, wax...

2
Last Updated: Oct 13, 2026

The Lund and Browder chart estimates total body surface area (TBSA) burned using percentages that change with the patient’s age.
The head falls from 19% of TBSA at birth to 7% in adults, while each leg rises from 14% to 20%.
Neck, trunk, buttock, genitalia and arm percentages hold steady at every age, so only the head and legs shift.
The free download is a one-page documentation form for recording burn depth and TBSA by region, not a percentage chart.
Practice management software like Pabau stores the completed assessment with the patient’s notes, so the figure and its timestamp stay together.
A one-page printable form for recording a burn assessment. It holds patient details, medical history, and a partial-thickness and full-thickness field for every body region. The form totals both columns, so you only need the age-adjusted percentages from the tables on this page.
Download templateGet burn size wrong and everything after it goes wrong too. Total body surface area (TBSA) sets the fluid volume, the admission decision, and the call to a burn center. A few percentage points either way changes the treatment a patient receives.
That’s why the Lund and Browder chart is still the reference method. Its percentages move with the patient’s age, so a toddler’s head is never scored like an adult’s. A newborn’s head is 19% of body surface, against 7% in an adult.
The percentages below are the six-column figures burn units work from. Read them next to the free documentation form on this page, which is where your findings get written down.
The chart measures how much of the body a burn covers, region by region. Charles Lund and Newton Browder published it in 1944. It divides the body into anatomical regions and gives each one a share of total surface area, listed by age.
That age column is what separates it from simpler estimates. TBSA then drives the clinical pathway, because the figure decides who needs admission, intensive care, or a specialist burn center. It also feeds the Parkland formula, which sets the fluid volume for the first 24 hours.
Only two parts of the body move between the six age columns. A newborn’s head is 19% of total surface area, while an adult’s head is 7%. Each leg runs the other way, from 14% at birth to 20% in adults.
Every age column adds up to 100%, so you can check a transcription by totaling the column you used. For an age between two columns, interpolate between the two nearest values.
Burns rarely take a whole limb. The full chart splits each arm and leg into segments. That way you can record a burn that covers only the forearm, or only the foot.
The segment figures add up to the composite values in the first table. Each arm totals 9.5% at every age, and a 5-year-old’s leg totals 17%. TBSA is re-checked as the burn declares itself.
Five steps take you from examination to a documented TBSA figure.
Many teams laminate the printed table or build it into a digital assessment form, so the numbers are on hand during the first survey.

Most errors come from the same handful of habits. Run through this list before you commit a figure to the notes.
With a tool that tracks clinical measurements, baseline and follow-up scores sit side by side in the patient record.
The free form on this page is a record sheet rather than a reference chart. It carries no body outline and no percentage table, so work the figures out from the tables above first. The form’s fields then line up with those table rows one for one.
Depth belongs in the record for two reasons. Redness alone stays out of the resuscitation figure, while partial and full thickness both count. Full-thickness areas also head for excision and grafting.
Note the time of the assessment as well, since TBSA is re-checked as the burn declares itself over the first 48 hours. The same sheet tells the ward what comes next.
Wallace’s Rule of Nines is quicker but blunter. It assigns 9% per arm, 18% per leg, 18% for each trunk surface, and 9% for the head. The genitals count as 1%. Those fixed figures suit adults. In young children they understate the head and overstate each leg.
Burn services treat the chart as the reference method, and keep the Rule of Nines for rapid adult screening. The difference shows up in the fluid order.
A 5-year-old with the whole head burned scores 13% TBSA on the chart, against 9% on the Rule of Nines. For a 20 kg child, the Parkland formula gives 1,040 ml over 24 hours instead of 720 ml.
Infants and young children carry different proportions from adults. The skull and brain grow before the limbs lengthen, so a newborn’s head takes up a large share of body surface. By about age 15, proportions are close to adult ratios.
Score a 2-year-old’s head burn with the Rule of Nines and you get 9%, when the age-matched figure sits nearer 16%. That shortfall carries into the Parkland formula and can leave a child under-resuscitated. The Rule of Nines percentages also overstate a toddler’s legs, so errors run in both directions.
Once TBSA is settled, it goes into the Parkland formula. That formula is 4 ml × body weight in kg × TBSA% = total volume in ml over 24 hours. Half is given in the first 8 hours, and the rest across the following 16 hours.
The Muir and Barclay formula uses different ratios, but it depends on the same TBSA figure. Whichever formula your unit follows, the fluid order is only as good as the estimate behind it. Recording the estimate and the time it was made lets the next clinician re-check the arithmetic.
Refer on depth and site as readily as on size. The American Burn Association asks for immediate burn center consultation for any full-thickness burn, and for partial-thickness burns at 10% TBSA or more.
Escalate straight away when any of these apply.
The largest injuries go a step further, and those thresholds vary between systems. NHS Scotland’s transfer criteria send adults above 25% TBSA and children above 15% TBSA to the National Burn Centre.
Depth shapes those decisions too. The same criteria flag adults needing more than 10% TBSA of deep burn excision, and children needing more than 7%. Either way.
A laser or IPL burn in an aesthetic practice rarely reaches 1% of TBSA, so the record matters more than the total. Photograph the area, then write down the region, the depth, and the time.
For anything patchy, use the palm rule instead of a whole region. The patient’s palm without fingers is roughly 0.5% of TBSA, and the palm with fingers is roughly 1%. Measure against their hand, not yours, because hand size tracks body size.
In laser and IPL practices, using the chart’s regions keeps every incident note consistent. The referral triggers don’t change either, so a deep burn on the face or over a joint still goes to a burn service.
Both versions share the same region percentages, so the arithmetic is unchanged. A 2019 comparative study in Acute and Critical Care set out what did change.
The modified chart divides each region into small quadrilaterals worth 0.25% each. Assessors count squares instead of estimating fractions, and the study found their totals varied less.
The form on this page is a documentation sheet rather than either diagram. Take the percentages from the tables above, then record them on the form.
No estimation tool is exact. The chart carries three well-documented limitations.
The chart also says nothing about burn depth, which stays a separate clinical judgment. It remains the reference method because it beats the alternatives on accuracy, and because it gives every team one language for handover.
Most teams record a burn assessment on paper, then retype the figures into the patient record later. The estimate and the note drift apart, and the time of assessment often goes missing.
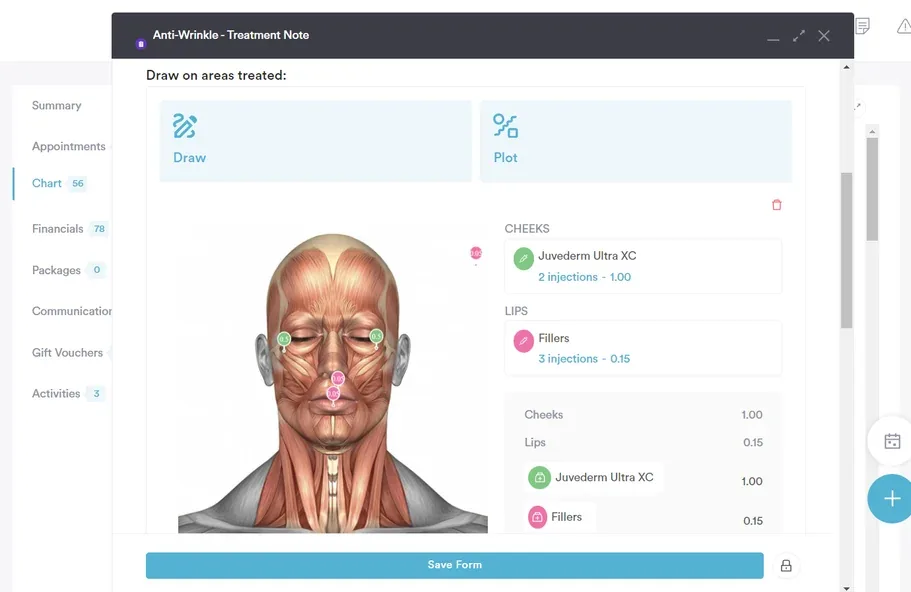
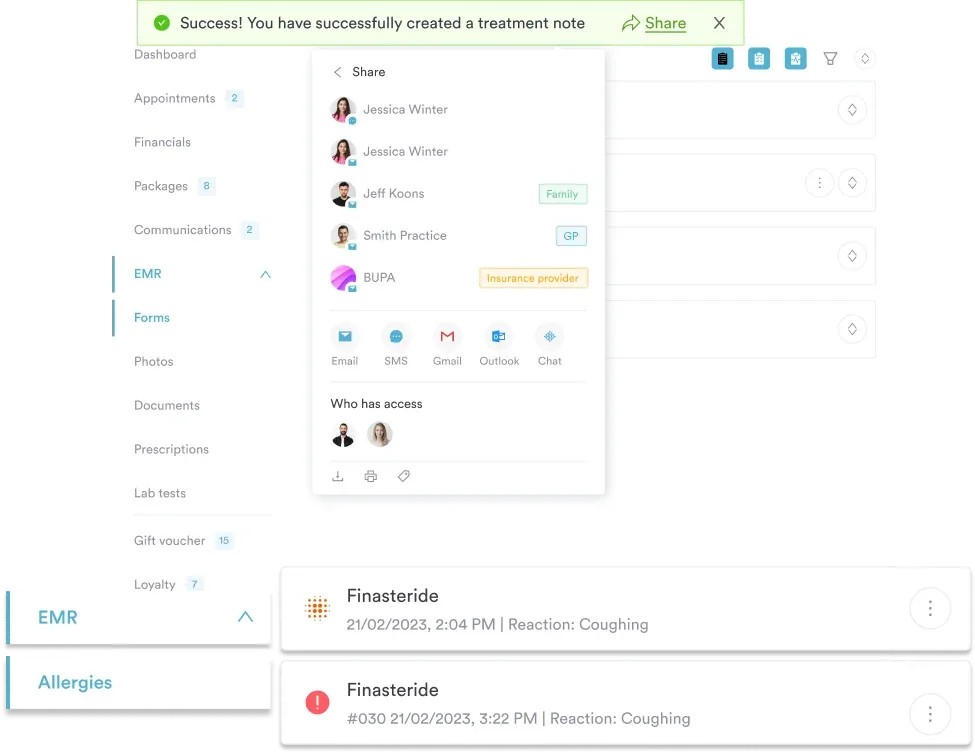
Practice management software like Pabau keeps the form and the record in one place. You can build the Lund and Browder regions into a digital form, so each region’s partial-thickness and full-thickness figures are entered once. The completed form is stored against the patient’s file with a date and time. Patient intake that feeds the record directly keeps what was asked and what was filed identical.
Notes dictated during the assessment can be written up by Pabau Scribe, our AI scribe, so the detail behind the figure isn’t lost. Your staff spend less time on paperwork, and the burn record stays complete for audit.

Pabau’s digital forms capture Lund and Browder percentages region by region, timestamp them, and store them with the patient’s notes. Your team records the figure once and finds it again in seconds.

Burn size is an estimate, but it doesn’t have to be a guess. The chart gives you age-matched percentages, and the six columns take about a minute to read. Use it for every burn rather than only the pediatric ones, so your team works from one method.
Then write the figure down properly, with the depth split and the time of assessment. That record is what the next clinician checks their own estimate against. Book a demo to see how Pabau keeps burn documentation with the patient’s notes.

Need the adult shortcut as well? Body burn percentage chart sets out the Rule of Nines alongside the pediatric figures and burn degree classification.
Handing off a deteriorating patient to the next provider? SBAR report template gives a one-page form for the four SBAR sections plus a signature and timestamp.
Need a fast way to chart a patient encounter? SOAP progress notes template gives a one-page PDF with blank Subjective, Objective, Assessment, and Plan fields.
Want a consistent format for clinical notes? SOAP notes guide explains the four-part format that keeps notes consistent across clinicians and audits.
Writing up assessments faster? Clinical documentation software compares the tools practices use to keep notes complete and audit-ready.
Charles Lund and Newton Browder published it in 1944. Both surgeons worked at Boston City Hospital. Their percentages came from treating hundreds of burn patients, including victims of the 1942 Cocoanut Grove fire.
Yes. Mersey Burns works out TBSA using the Lund and Browder method, then fluid volumes using the Parkland formula. NICE has reviewed it. Keep a paper chart to hand as well, since phones and batteries fail.
Estimates drift, and usually upward. Teams outside burn care tend to overestimate burn size, so the burn service often revises the figure down. Record the time with every estimate, so the two can be compared properly.
No. Redness with no blistering stays out of the resuscitation figure. Partial-thickness and full-thickness areas both count, so your depth assessment decides what goes into the total.
Use the download box near the top of this page. The file is a one-page record sheet with partial-thickness and full-thickness fields for every region. The percentage tables stay here on the page.