Nitrates medication list
A nitrates medication list is a point-of-care reference that sets out the main c...

1
Last Updated: Oct 6, 2026

A genogram symbol sheet is the legend that tells you what every shape and line on a family diagram means.
Squares mean male, circles female, and diamonds non-binary or unknown gender. An X through a shape marks a death.
Solid lines mark marriage, dashed lines mark cohabitation or adoption, and vertical lines connect parents to children.
Shading marks a diagnosed condition, and initials inside a symbol record substance use or a mental health diagnosis.
Practice management software like Pabau keeps the finished genogram in the client record, so family history sits with the chart.
This printable genogram symbols PDF covers gender notation, relationship lines, emotional patterns, medical conditions, reproductive events, and adoption. Each entry pairs the symbol with its meaning and the clinical situation where you would use it.
Download templateA genogram symbol sheet is the key that tells you what every shape and line on a family diagram means. Squares, circles, dashed lines, and shaded symbols each carry a fixed clinical meaning. Without a shared genogram key, two clinicians can read the same diagram two different ways.
This page sets out the full genogram legend by category: gender notation, relationship lines, emotional patterns, medical conditions, reproductive events, and adoption. Every family genogram symbol below is paired with its meaning and its clinical use, so your notes stay readable across the team.
A genogram symbol sheet is a one-page reference listing every standard symbol used to draw a family diagram, with what each one means. The genogram itself is a multi-generational map of relationships, emotional patterns, and health history. The sheet is what keeps everyone reading that map the same way.
Genogram signs look similar to the symbols for family tree diagrams, but they carry clinical information a genealogy chart never does. Shading marks a diagnosed condition. A zigzag line marks conflict. Those genogram symbols and meanings are what make the diagram usable in an assessment.
Standardized notation also reduces ambiguity during assessment and informed consent documentation. When a client sees their genogram during a session, they understand what each symbol means. A colleague reviewing the record months later reads the same language.
The standard genogram symbols most teams use come from the McGoldrick and Gerson framework, published in 1985. It covers gender, relationships, emotional dynamics, medical conditions, pregnancy status, and adoption. Mental health, primary care, nursing, and social work have all adopted it.
Every genogram starts with the individuals. The basic genogram symbols are plain geometric shapes that record gender and whether the person is living.
These four shapes carry most of a genogram. Trainees learn them first, then add relationship lines and emotional patterns on top.
Genogram relationship symbols are the lines drawn between people. They record partnership status, separation, and which generation someone belongs to.
Vertical lines build the generational structure. The oldest generation sits at the top, and each tier below it is younger. Getting these lines right first is what makes the emotional lines readable when you layer them on.
Running this form inside a GP practice system keeps clinical documentation in one place.
Emotional symbols show how family members actually relate, not just who is related to whom. This is the layer that separates a genogram from a family tree.
Emotional lines are often the richest part of the diagram. A therapist reading a completed genogram sees which alliances hold the family together, which relationships are strained, and where a child is being triangulated. That reading shapes the treatment plan.
Medical genogram symbols record health history inside the family map. Shading shows that a condition exists, and a label inside the shape says which one.
There is no single diagnosis symbol in the standard set. The two conventions work as a pair: shading tells you a condition exists, and the label tells you which one. A row of shaded squares marked HTN across three generations is a hypertension pattern you can act on at the next appointment.
Pregnancy, loss, and family planning belong in the family history. Standard notation records them without forcing the client to retell the story every review.
Use these symbols sensitively. Ask about a loss once, record it properly, and the client is not asked to repeat it at every review. There is no agreed IVF symbol in the McGoldrick set. Most clinicians write IVF beside the child’s symbol and explain the annotation in the legend.
Family membership extends past biology. The adopted genogram symbol, together with foster, step, and guardianship notation, shows how each child joined the family.
In child welfare, family therapy, and trauma-informed work these lines carry weight. A dashed line tells a clinician the relationship is not biological, which changes both the genetic risk picture and the attachment history worth asking about.
The sheet earns its place in the session, not in a folder. Here is how therapists, social workers, nurses, and counselors put it to work during intake and afterwards in the record.
Consistency is the whole point. When everyone on the team draws from the same sheet, the genogram is a clinical instrument rather than one clinician’s private shorthand.
Pair the symbol sheet with a structured digital intake form and the session starts further along. The client supplies names, dates, and relationships in advance. You spend the appointment on the emotional lines and the health history, which is the part only you can draw out.
The McGoldrick and Gerson standard is widely adopted, but every discipline adapts it. Knowing the variations saves confusion in a multi-disciplinary team, or when you inherit records from another service.
Mental health and family therapy: Therapists use the full emotional set, because relational dynamics are the treatment target. The genogram gets revisited across sessions as those lines change, so date each version before you file it.
Nursing and medical assessment: Nurses lean on the medical and reproductive notation more than the emotional lines. In obstetric nursing, pregnancy and loss symbols do most of the work. Nursing training often circulates nursing symbol images covering only the medical notation, so emotional lines can be unfamiliar to newer staff.
Social work and child welfare: Adoption, foster care, guardianship, and safety notation come first here. The genogram becomes a map of risk and protective factors. Many agencies add local flags for custody status and safeguarding concerns. A bold outline around a child at risk is one common convention, and it belongs in the legend on every copy.
Genetic counseling: Here the genogram becomes a pedigree. Carrier status, age of onset, and penetrance get added, which are layers well past the basic McGoldrick sheet.
The baseline stays standard. Each discipline adds its own emphasis on top. When you join a new team, ask what local notation they use before you file your first diagram. Consistent client record organization keeps those diagrams readable across shared systems.
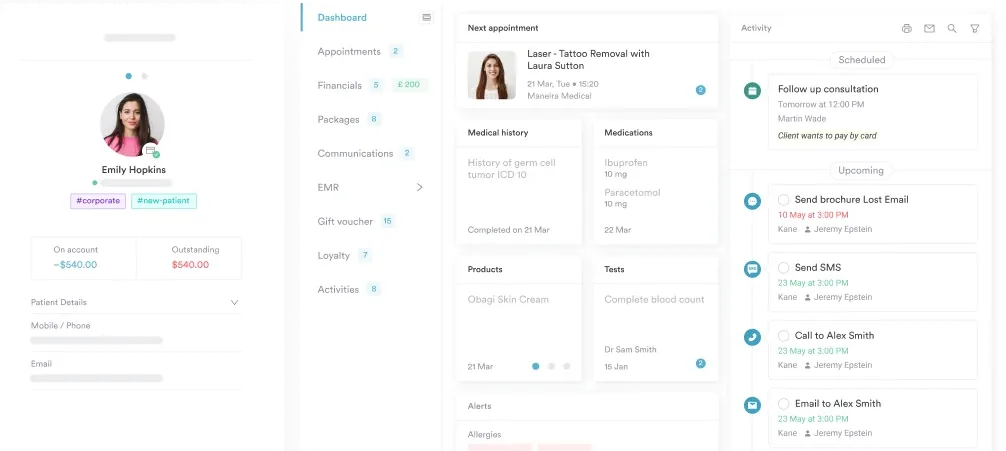
A paper genogram lives in one folder, in one office. Stored digitally, it sits in the client’s chart next to the intake form, the consent, and every progress note. Practice management software like Pabau keeps all of that on one client record, so you can open the genogram mid-session instead of hunting for it.
Genograms hold sensitive health information about people who are not your client. Digital storage puts that under the same access controls as the rest of the record. That matters for HIPAA in the US and GDPR in the UK and EU, where a filing cabinet offers no audit trail.
Structured digital intake forms collect the factual scaffolding before the appointment. A secure mental health EMR then stores the finished diagram against the client’s timeline. A colleague picking up the case in six months reads the same family history you drew.

Pabau stores the completed genogram, the intake form, and every progress note on one client record. Your team reads the same family history at every appointment, without chasing a scanned page.

Consistency is what makes a genogram worth drawing. A diagram any colleague can read six months later earns its place in the record. One drawn from memory, in private shorthand, does not.
Download the sheet, keep it visible during intake, and agree with your team on the handful of local conventions you add on top. Write those conventions into the legend on every diagram you file.
The payoff builds slowly. After a dozen genograms you start seeing the pattern before the client has finished describing it. Book a demo to see how Pabau keeps genograms, intake forms, and family history on one client record.

Ready to launch your own practice? opening a private practice as an LCSW walks California clinicians through the steps, from licensing to setup.
Need a complete clinical assessment framework? psychiatric evaluation template walks practitioners through every component of a structured mental health assessment.
Working with a highly sensitive client? highly sensitive person guide covers traits, clinical background, and therapy approaches for clients high in sensory processing sensitivity.
Squares represent males, circles represent females, and diamonds represent non-binary or unknown gender. Solid horizontal lines show married or partnered relationships, dashed lines show cohabitation or adoption, and vertical lines connect parents to children. Emotional relationship symbols cover close, distant, and conflictual ties. Medical notation uses filled symbols for conditions and initials for substance use. Together they make up the standard set defined by McGoldrick and Gerson.
An X through a symbol denotes a deceased person. Add the age at death and year of death where you have them, for example “X 1995, age 67”. This tells a clinician which family members are alive and which have died. It also dates the losses against the client’s own life events.
A dashed line connects the adoptive parents to an adopted child, showing the legal family relationship while distinguishing it from biological lineage. Biological parents are often shown too, in family therapy or for context. Their connection is marked separately, usually with a different line style, to keep the family of origin clear.
Mark the symbol (square, circle, or diamond) with an X through it. Write the age at death and year of death near or inside the symbol if that detail is clinically relevant. Say a parent died of a heart attack at 52. Recording “X 1998, age 52, MI” tells the next clinician exactly where to look for hereditary cardiac risk.
The McGoldrick and Gerson framework (1985) is the most widely adopted standard across mental health, nursing, social work, and primary care. Some disciplines add their own notation on top. Genetic counselors add penetrance and carrier markers, child welfare teams add custody and safety flags, and obstetric nurses lean on the reproductive symbols. The baseline symbols stay the same. When in doubt, ask your team which local conventions they use.
A fully filled symbol denotes a diagnosed hereditary or chronic condition. A half-filled symbol shows carrier status for a genetic condition. Write an abbreviation inside the symbol, such as “Dep” for depression, “D” for diabetes, or “A” for alcohol use disorder. This notation lets clinicians read health patterns across generations and judge familial risk for the client.
A family tree shows names, dates, and biological relationships across generations. A genogram adds emotional relationship patterns, medical and mental health history, substance use, and reproductive events on top of that. Genograms are standardized clinical tools. Family trees are genealogical records, built for genealogy rather than assessment.