Impaired skin integrity nursing care plan
An impaired skin integrity nursing care plan is a structured document that recor...

2
Last Updated: Oct 16, 2026
A food carbohydrate chart is a reference table that groups common foods and lists the grams of carbohydrate in one standard serving of each. Grains and starches, fruits, dairy, non-starchy vegetables, and sweets each get their own row. One carb choice, the standard unit across charts, equals 15 grams.
Clinicians and patients use the chart for meal planning, blood sugar control, and dietary counseling. This guide covers the food group values, how to read them against a nutrition label, and how to set per-meal targets. The printable file below is a blank form you fill in and hand to a patient.
A blank, printable form for recording your own carbohydrate reference values and logging what a patient eats. It gives you 14 meal rows for portion, range and source notes, an approval line, and a dated recording log.
Download template
A food carbohydrate chart groups common foods by serving size and carb gram count, where one carb choice equals 15 grams.
Carbohydrate counting helps people with diabetes manage blood glucose and supports weight loss through structured portion control.
Charts separate simple from complex carbohydrates, and starchy from non-starchy vegetables, which keeps dietary counseling practical.
The downloadable file is a blank form you fill in yourself, with 14 reference rows and a dated intake log.
Pabau’s digital forms capture what a patient eats, and Care Plus adds specialist patient care features on top.
Nutrition labels vary by brand and package size, so two patients reading two packets can end up with two different numbers for the same food. A standardized carbohydrate chart gives the practice and the patient one shared framework for meal planning and glucose management.
The groups follow how the body handles carbohydrate. They are grains and starches, fruits, milk products, non-starchy vegetables, and discretionary foods. That structure also matches the order dietary counseling tends to take in a consultation.
When patients know the carbohydrate content of the foods on their own plate, they can anticipate blood sugar responses and adjust portions with confidence. A dietitian or diabetes educator uses the chart to turn an abstract target into named foods and portions.
Take a target of 45 to 60 grams of carbohydrate per meal. Instead of “eat less bread”, the practitioner points at the row. One slice is roughly 15 grams, so three slices and a non-starchy vegetable still land inside the 45 to 60 gram target. The conversation moves from restriction to strategy.
For people with diabetes, carbohydrate counting is an established strategy for blood glucose control. The amount and type of carbohydrate eaten drives the postprandial, or after-meal, rise in blood sugar.
Counting consistently builds awareness of which foods and portions cause spikes. Patients on insulin can then adjust dose or timing against a number they trust. Patients who are newly diagnosed often start broader, with a type 2 diabetes diet that narrows the choices before gram counting begins.
Weight management also relies on carbohydrate awareness. Total calorie intake drives weight loss, but many patients find carbohydrate counting more intuitive than calorie counting.
The chart gives practitioners a concrete way to discuss satiety, glycemic impact, and energy balance. Patients who learn that non-starchy vegetables carry very little carbohydrate often eat larger portions of them without anxiety.
Not all carbohydrates behave identically in the body, and many charts separate simple from complex ones for that reason. Simple carbohydrates are the sugars in fruit, sweets, and refined grains. They are absorbed quickly and push blood sugar up fast.
Complex carbohydrates are the starches in whole grains, legumes, and starchy vegetables, and they break down more slowly into a gentler glucose curve.
Fiber is technically a carbohydrate, but it resists digestion and does not raise blood sugar much. Many charts subtract fiber grams from total carbohydrate to give a net carb figure. Patients who read labels will meet that number, so it is worth explaining once rather than leaving it to guesswork.
Glycemic index refines the picture further by ranking foods on how quickly they raise blood glucose compared with pure glucose. Low GI foods such as legumes, most non-starchy vegetables, and steel-cut oats produce smaller spikes. High GI foods such as white bread, white rice, and sugary drinks raise blood sugar rapidly.
Two foods with the same carb gram count can therefore land very differently. A carbohydrate chart supplies the raw grams per serving. The clinician adds the context on processing, fiber content, and glycemic load that turns those grams into a decision.
The core of any food carbohydrate chart is a table organized by food group. Each group holds foods that share a nutritional profile and behave the same way in meal planning. The structure below is the one used across CDC, American Diabetes Association, and most hospital carbohydrate counting resources.
Non-starchy vegetables are the standout row. At roughly 5 grams of carbohydrate per half-cup cooked serving, they count as free foods in many carbohydrate counting systems. Patients can fill the plate with them without moving blood sugar much.
Grains, fruits, dairy, and sweets each contribute about one carb choice per standard serving. That makes them direct substitutes for one another in meal planning, and a diabetes exchange list formalizes the same swaps group by group.
Cheese is the common exception patients ask about. Most hard cheeses carry under 1 gram of carbohydrate per ounce, so they sit outside the 12 to 15 gram dairy row above.
The printable file is a blank working form rather than a pre-filled reference sheet. It opens with a reminder to check every figure against current product information and your own practice protocols. The gram counts in the table above are not printed inside it, so keep this page open while you complete the sheet.
The first section is headed “Food carbohydrate reference values” and holds 14 blank rows. Each row takes four entries: the meal, the portion, a range or note, and the source with the date you checked it. You fill those rows yourself, from the table above or from your practice’s own dietetic references.
That source field earns its place. Carbohydrate values drift between brands, recipes, and cooking methods, so a dated source tells the next clinician where a number came from. An approval line and date sit below the table. A dietitian or supervising clinician signs the values off before the sheet reaches a patient.
The second half of the form is a recording log. Each entry captures the date, time, meal, portion, and the name of whoever recorded it, with a notes area at the end. Patients use that half as a food diary between visits, and you review the completed sheet at the next appointment.
A food carbohydrate chart covers whole foods, but packaged products need label reading. On a nutrition label, “Total Carbohydrate” is the line that matters, and it already includes starches, sugars, and fiber. Many practitioners teach patients to subtract dietary fiber to get net carbs.
A serving with 20 grams of total carbohydrate and 4 grams of fiber leaves 16 grams, close to one carb choice.
Serving size is just as important, because the nutrient values apply only to the stated serving. A package labeled “1 serving = 1 cup” may hold three servings, which means multiplying every number on the panel. Patients often eat two or three servings in one sitting and triple their carbohydrate intake without realizing it.
Walking a patient through a label they brought in makes the point far better than a diagram. Point out the serving size, the total carbohydrate per serving, and the number of servings in the package, in that order.
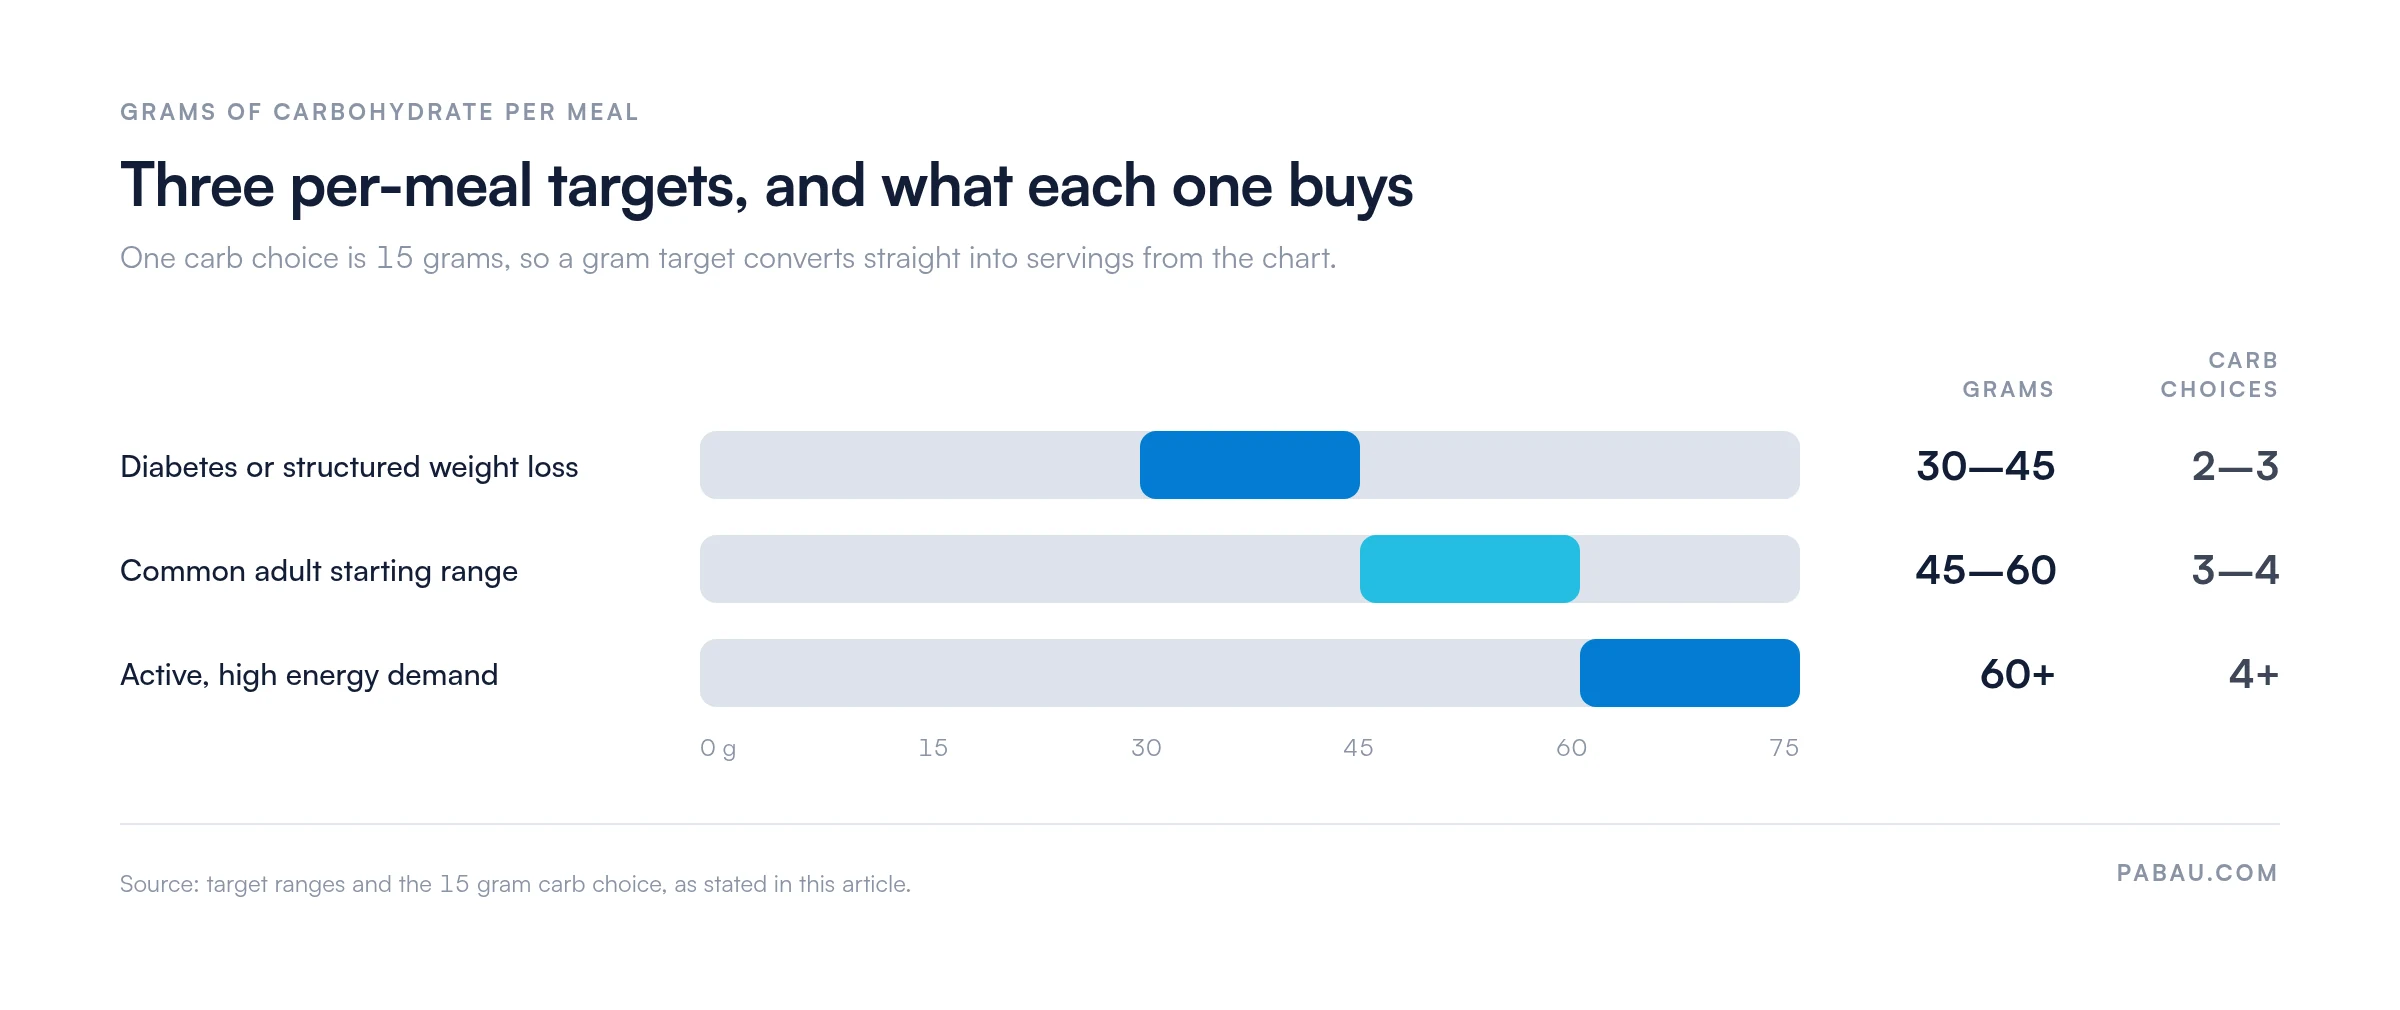
There is no single target that suits every patient. A common starting range for adults is 45 to 60 grams of carbohydrate per meal. People with diabetes, or those pursuing structured weight loss, often do better at 30 to 45 grams. Active patients with high energy demands may sit above 60 grams per meal.
Because one carb choice is 15 grams, each of those bands converts straight into servings off the chart.
Consistency is what makes the target useful. Once a patient and practitioner agree on a number, the chart becomes the practical tool for hitting it meal after meal.
Individual variation matters here. Insulin sensitivity, activity level, medication regimen, and personal metabolic factors all shift the ideal intake. One patient with insulin resistance may do best at 30 grams per meal while another manages 60 grams comfortably.
The reliable way to find the right number is to work with a dietitian. Read the response on a continuous glucose monitor or a point-of-care glucometer. Pair the completed chart with a blood glucose log so each meal’s carb count sits beside the reading it produced.
Most patients want a quick mental model for what to reach for and what to cut back. A carbohydrate chart supports that by showing relative carbohydrate density. Non-starchy vegetables stay safe in large quantities. Whole fruits and whole grains carry a moderate load alongside useful fiber.
Refined carbohydrates such as white bread, sugary drinks, and packaged snacks deliver the most carbohydrate for the least nutrition. They are the first place to trim.
Frame the categories as portion size and frequency matched to each patient’s target, rather than as a list of banned foods. Patients keep to a plan they helped build far longer than one handed to them.
A printed chart works hardest when the rest of the record keeps up with it. Practice management software like Pabau captures a patient’s eating patterns, dietary goals, and carbohydrate awareness on a digital intake form. The form goes out before the first visit. You open the consultation already knowing what the patient eats.
Weight loss and metabolic practices run that loop several times per patient. Weight loss clinic software keeps the intake forms, the agreed targets, and the review dates on one patient record instead of three.
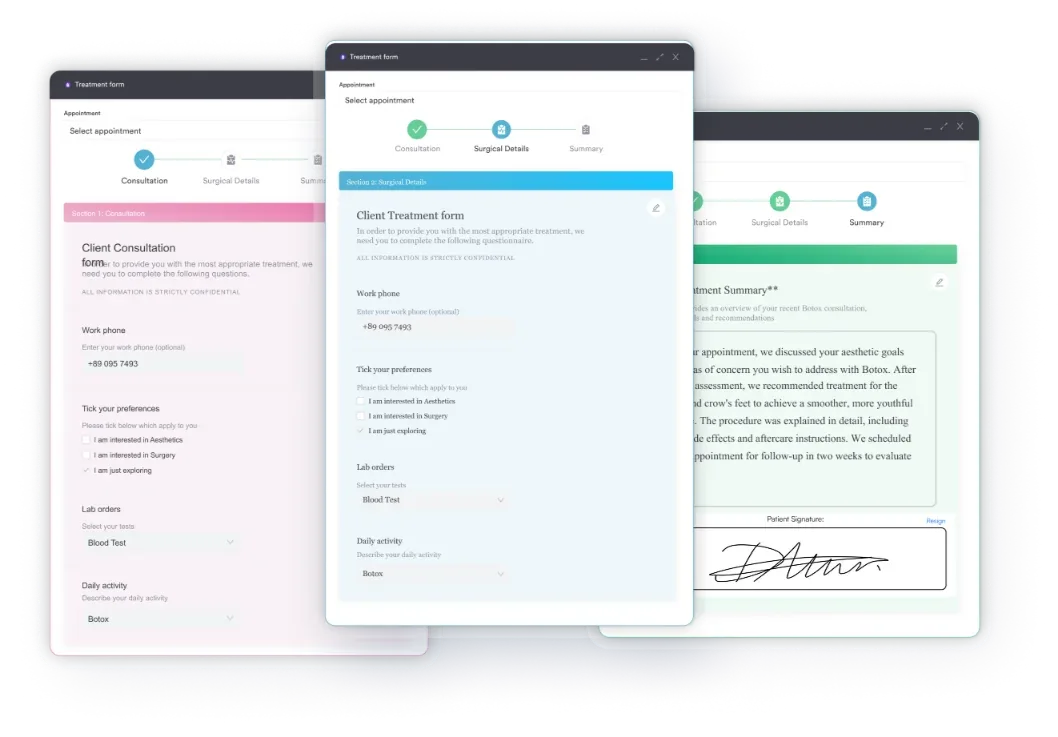
After the visit, the patient record holds the carbohydrate target, the agreed food substitutions, and the review dates. Automated email and SMS reminders prompt patients to log their intake, so the recording half of the form comes back filled in.
Store the completed chart in the Client Portal so patients can open it on a phone at mealtimes or print a fresh copy. Each review compares logged intake with glucose readings and weight trends in the same record. The next target you set then rests on the patient’s own data.

Pabau’s digital forms, patient records, and automated reminders hold a patient’s carbohydrate targets, completed charts, and review dates in one place. Your team sees what changed since the last visit without chasing paper.

Carbohydrate counting only helps when the numbers behind it are yours. Use the food group table on this page for the standard values. Then commit the foods this patient eats week to week to the printable form, source and date included.
The trade-off is worth stating plainly. A blank sheet takes five minutes to complete before a consultation. It buys you a chart the patient recognizes, plus a dated log you can review instead of relying on recall.
Download the form above, fill it in for your patient population once, and reuse it from there. Book a demo to see how Pabau keeps dietary forms, carbohydrate targets, and follow-up reminders in one patient record.

Need the swap logic behind carb choices? Diabetes exchange list groups foods into exchanges, so a patient can trade one serving for another without recounting.
Tracking intake against readings? Blood glucose log gives patients a dated sheet that pairs each meal with the glucose result it produced.
Want a lighter recording sheet? My food diary suits patients who are not counting grams yet but still need to record what they eat.
Setting fasting targets? Fasting blood sugar levels chart lists the ranges you measure a carbohydrate plan against between visits.
Building a starting food list? Type 2 diabetes diet food list narrows the choices before a patient starts counting grams per meal.
Refined grains such as white bread, white rice, and regular pasta top the list, along with sugary drinks, desserts, and processed snacks. These often carry 20 to 50 grams per serving or more. Whole fruits, legumes, and starchy vegetables sit around 15 grams per serving, and non-starchy vegetables contain only about 5 grams.
Find the food on your carbohydrate chart, check the serving size, and note the gram count listed against it. Add the carbs across every food in the meal, then compare the total with your target. Most adults with diabetes work to 45 to 60 grams per meal and adjust portions to fit.
Yes. Carbohydrate awareness supports weight loss by making portion sizes concrete and cutting back on high-calorie processed foods. Many people find carb counting more intuitive than calorie counting. Pairing chart-based portions with regular physical activity works better than either change on its own.
No. Low glycemic index foods raise blood sugar more slowly than high GI foods, but they still contain carbohydrate. Steel-cut oats have a low GI and still carry about 27 grams per cooked cup. A carbohydrate chart gives you the grams, while glycemic index describes how fast that food moves blood glucose.
Non-starchy vegetables such as broccoli, spinach, peppers, tomatoes, cauliflower, lettuce, and zucchini contain about 5 grams of carbohydrate per half-cup cooked serving. Starchy vegetables such as potatoes, corn, and winter squash carry around 15 grams per serving and count as one carb choice.