Waist-to-hip ratio chart: Risk bands for women & men (free PDF)
A waist-to-hip ratio chart sorts a patient’s waist-to-hip ratio (WHR) into...

1
Last Updated: Oct 14, 2026

An A1C conversion chart maps hemoglobin A1C (%) to estimated average glucose (eAG) in mg/dL and mmol/L, reflecting roughly 2-3 months of blood sugar control.
The American Diabetes Association (ADA) diagnostic threshold for diabetes is A1C ≥6.5%; prediabetes ranges from 5.7-6.4%.
An A1C of 7% corresponds to about 154 mg/dL eAG, the ADA target for most adults with diabetes.
Pabau’s digital forms and client records support longitudinal A1C tracking and automated patient follow-up workflows for metabolic health practices.
A clinical reference chart for converting hemoglobin A1C percentages to estimated average glucose (eAG), supporting diabetes management workflows, patient education, and longitudinal glucose monitoring in healthcare practices.
Download templateAn A1C conversion chart maps each A1C percentage to its estimated average glucose (eAG) in mg/dL and mmol/L, so you can turn a lab result into a number patients recognize from their own glucose meter. This guide gives you the full conversion chart, the ADA diagnostic thresholds behind it, the ADAG formula that generates it, and how to read it against individualized glycemic targets in practice.
This chart converts an A1C percentage into estimated average glucose (eAG) using the ADA’s validated ADAG equation. Find the patient’s A1C in the first column and read across to the average glucose it represents over the preceding 2-3 months, in both US (mg/dL) and international (mmol/L) units.
| A1C (%) | eAG (mg/dL) | eAG (mmol/L) | Clinical category |
|---|---|---|---|
| 5.0 | 97 | 5.4 | Normal |
| 5.7 | 117 | 6.5 | Prediabetes (lower bound) |
| 6.0 | 126 | 7.0 | Prediabetes |
| 6.4 | 137 | 7.6 | Prediabetes (upper bound) |
| 6.5 | 140 | 7.8 | Diabetes threshold |
| 7.0 | 154 | 8.6 | ADA target (most adults) |
| 7.5 | 169 | 9.4 | Diabetes |
| 8.0 | 183 | 10.2 | Diabetes |
| 9.0 | 212 | 11.8 | Diabetes |
| 10.0 | 240 | 13.4 | Diabetes |
| 11.0 | 269 | 14.9 | Diabetes |
| 12.0 | 298 | 16.5 | Diabetes |
These are population averages from the ADAG study, not any single patient’s exact glucose. A specific patient’s meter average can differ, and conditions such as anemia, chronic kidney disease, or hemoglobin variants shift the A1C-to-glucose relationship. Treat the chart as a counseling and interpretation aid, not a substitute for direct glucose monitoring.
An A1C conversion chart is a clinical reference tool that converts hemoglobin A1C (glycated hemoglobin) percentages into estimated average glucose levels, expressed in both mg/dL (US standard) and mmol/L (international). The interactive version of the same tool is often called an A1C calculator. Either way, it turns a lab result into an actionable glucose target, helping clinicians counsel patients on long-term blood sugar control.
Hemoglobin A1C reflects approximately 2-3 months of average blood glucose exposure due to red blood cell turnover. Unlike point-in-time fingerstick readings, A1C provides a cumulative picture of glycemic control, which is the foundation for diabetes diagnosis, risk stratification, and therapy monitoring.
The American Diabetes Association (ADA) uses A1C as a gold standard for diabetes diagnosis alongside fasting glucose and oral glucose tolerance testing.
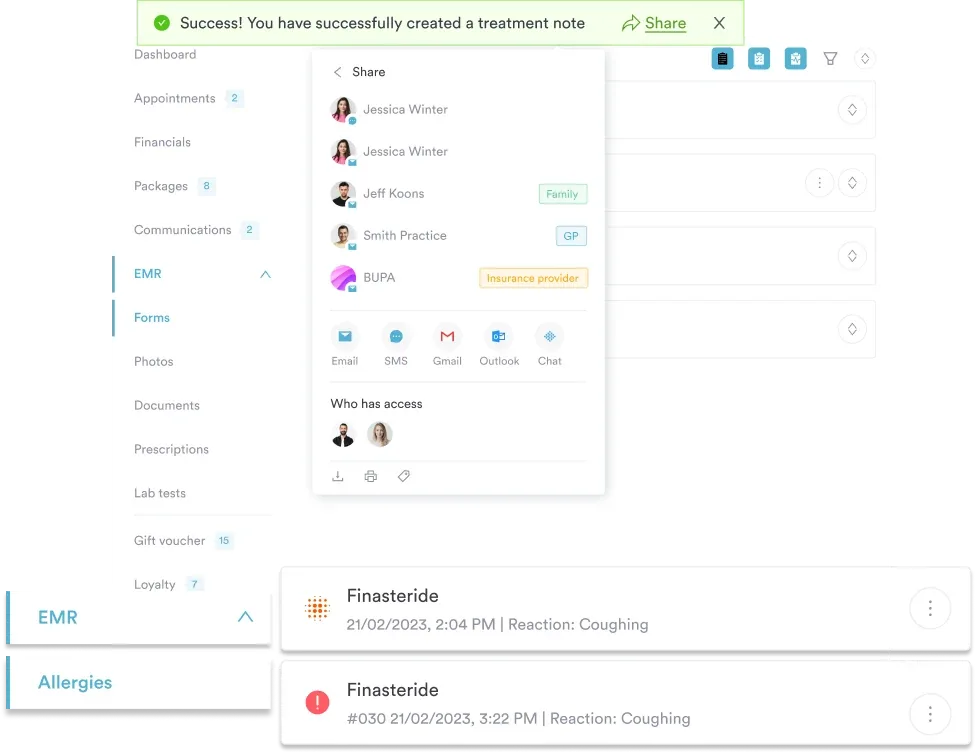
Clinicians read an A1C result off the chart to see the corresponding average glucose, then record it in the patient’s chart. In practice management software like Pabau.
Converting an A1C result into estimated average glucose takes five straightforward steps that fit into routine diabetes management workflows.
Recording each result in clinical software keeps A1C values in the permanent patient record, searchable for population health reports and available to trigger automated recall campaigns when testing is due.
Storing completed assessments in patient management software keeps every score searchable within the patient’s record.
An A1C conversion chart is a working tool for clinicians across several specialties and practice models who counsel patients on diabetes management, metabolic health, and preventive care.
Working from an A1C conversion chart or calculator delivers several operational and clinical benefits that improve patient understanding and support better metabolic health outcomes.
Clarity for patient education: Converting an abstract lab percentage (for example, 8.2%) into a relatable glucose equivalent (189 mg/dL) helps patients visualize their control and understand therapy targets. This builds motivation for adherence to lifestyle changes or medication regimens.
Accurate therapy monitoring: A1C reflects long-term control, so regular monitoring helps clinicians detect therapeutic drift before hyperglycemic complications emerge. A shared conversion reference standardizes interpretation across your practice team, reducing ambiguity in therapy adjustments.
Workflow efficiency: Automated A1C-to-eAG conversion eliminates manual calculation errors and speeds up patient counseling. Embedding the reference in patient portals or staff dashboards reduces documentation time and supports data-driven decisions.
Population health insights: A1C data supports aggregate reporting on cohort-level glycemic control, identifying high-risk patients for proactive recall and intensified monitoring. Many metabolic health practices pair A1C trend data with patient recall software to demonstrate treatment efficacy to payers and insurers.
Flag patients with A1C in the prediabetic range (5.7-6.4%) for intensive lifestyle counseling. In the landmark Diabetes Prevention Program, a structured lifestyle program cut progression to Type 2 diabetes by 58% over about three years, making prediabetes detection a critical prevention opportunity.
The American Diabetes Association establishes three diagnostic categories based on A1C levels, each carrying different clinical implications and recommended follow-up pathways. Coding for a confirmed diagnosis ranges from Type 2 diabetes without complications (E11.9) to Type 2 diabetes with hyperglycemia (E11.65) or diabetic neuropathy (E11.40), depending on associated complications.
A1C may read falsely low in patients with conditions such as sideroblastic anemia, hemoglobin variants (HbS, HbC), or iron deficiency anemia, and falsely high in chronic kidney disease or post-transfusion states. Follow-up testing with fasting glucose or an oral glucose tolerance test is warranted when clinical suspicion conflicts with the A1C result.
The ADAG (A1C-Derived Average Glucose) consensus equation is the mathematically validated relationship behind every value in the conversion chart above. The formula is:
A1C (%) = (mean plasma glucose in mg/dL + 46.7) / 28.7
Rearranged to solve for glucose: eAG (mg/dL) = (A1C × 28.7) − 46.7
This relationship was derived from the ADAG study, which combined continuous glucose monitoring and frequent self-monitoring data across 507 subjects (268 with Type 1 diabetes, 159 with Type 2 diabetes, and 80 without diabetes) recruited from 10 international centers.
The study established a consistent A1C-to-glucose correlation across populations. An A1C of 7% approximates 154 mg/dL eAG, and an A1C of 8% equals roughly 183 mg/dL.
International users may work in IFCC units (mmol/mol) rather than NGSP percentages. Modern A1C calculators auto-convert between formats using: IFCC mmol/mol = (NGSP % − 2.15) × 10.929.
Beyond the conversion chart, several complementary resources reinforce patient understanding of glucose control. Staff-led sessions on A1C interpretation, diet-glucose relationships, and medication adherence increase engagement. Printable A1C reference charts posted in exam rooms and patient care areas act as visual touchpoints that reinforce targets during consultations.
The CDC’s National Diabetes Prevention Program and the ADA’s Standards of Care provide evidence-based lifestyle and pharmacotherapy guidelines you can reference in patient education materials. Patient portals can deliver automated A1C trend notifications, appointment reminders, and educational articles when lab results are logged, reducing clinician workload and improving adherence monitoring.
Metabolic health practices using automated workflows often build A1C-triggered recall pathways. When a patient’s A1C drops into the prediabetic range after a lifestyle intervention, an automated email congratulates the patient and schedules follow-up counseling, which supports retention and helps reduce missed follow-up appointments.
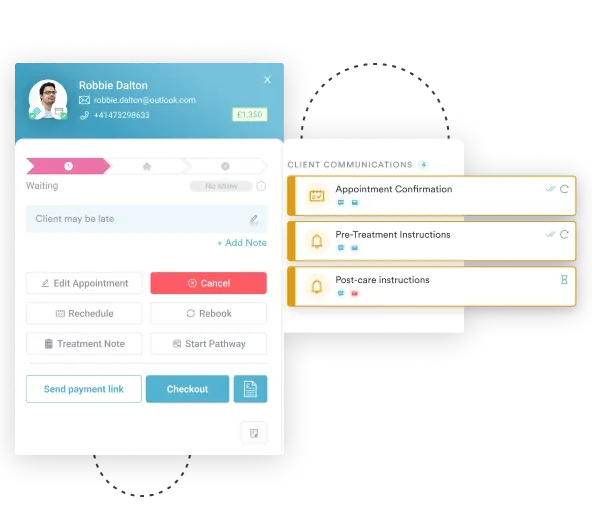

See how Pabau’s patient records, automated workflows, and clinical dashboards help metabolic health practices track A1C trends, automate follow-up care, and improve patient engagement across your practice.

An A1C conversion chart is a foundational clinical asset for diabetes diagnosis, risk stratification, and longitudinal management in primary care, metabolic health, and weight loss practices. Converting A1C percentages into estimated average glucose (eAG) helps patients visualize their glycemic control and motivates behavior change.
Because the ADAG-based conversion holds across patient populations, the chart is reliable for screening, diagnostic workups, and therapy monitoring, as long as you account for the conditions that skew A1C.
Record conversions in the digital patient record, automate follow-up workflows triggered by A1C thresholds, and use longitudinal A1C tracking to demonstrate population health outcomes to your team and payers.
Pabau’s integrated clinical documentation and metabolic health reporting support A1C monitoring at scale, helping you deliver personalized, data-driven diabetes care. Book a demo today to see how Pabau fits your diabetes care workflow.

List Item #1
List Item #2
An A1C conversion chart maps hemoglobin A1C percentages to estimated average glucose (eAG) in mg/dL and mmol/L using the ADAG formula, helping clinicians and patients understand long-term blood sugar control over the preceding 2-3 months. The interactive version is often called an A1C calculator.
An A1C of 7% corresponds to approximately 154 mg/dL (8.6 mmol/L) estimated average glucose, which is the ADA target for most adults with diabetes to reduce microvascular and macrovascular complications.
The ADA recommends A1C testing at least twice per year for patients at target, and quarterly for those not meeting goals or with recent therapy changes. ADA Standards of Care also recommend screening adults 35 and older without known diabetes at least once, with more frequent screening for at-risk individuals.
Yes, for the conversion step. A1C itself cannot be accurately measured at home; blood must be drawn at a lab or an NGSP-certified point-of-care site. Once you have the lab result, any A1C conversion chart or calculator converts it to eAG.
A1C is the percentage of hemoglobin molecules glycated over 2-3 months (the lab result). eAG is the estimated average glucose, in mg/dL or mmol/L, that the A1C percentage mathematically corresponds to, which is a more intuitive metric for patient education.
An A1C of 6.5% or higher is diagnostic for Type 1 or Type 2 diabetes per the American Diabetes Association. An A1C between 5.7-6.4% indicates prediabetes, requiring lifestyle intervention and, depending on risk factors, pharmacotherapy.