Blood type O food list
A blood type O food list sorts foods into what people with type O should eat, li...

1
Last Updated: Oct 6, 2026

A weight height chart for women maps healthy weight ranges to height, grouped by the four BMI categories.
At 5 ft 4 in, the normal BMI band runs from 108 to 145 lb, a span of 37 lb.
The band widens as height increases, so a single target weight misleads taller patients most.
BMI screens rather than diagnoses, so pair the chart with waist circumference and body composition.
Practice management software like Pabau records height and weight at every visit, so the trend stays in the patient record.
The PDF lists healthy weight ranges in pounds and kilograms for every height from 4 ft 11 in to 6 ft 0 in. It also carries the four BMI category thresholds and a blank column for recording each visit.
Download templateA weight height chart for women shows the weight span that keeps an adult woman inside the normal BMI category, height by height. At 5 ft 2 in that span runs from 101 to 136 lb. At 5 ft 8 in it runs from 122 to 164 lb.
Practitioners reach for the chart at intake, at wellness visits, and at every weight management follow-up. It turns a number on the scale into a category the patient can act on. It also gives the whole team one reference instead of several remembered ones.
The ranges below are arithmetic rather than opinion. They come from one formula and one pair of thresholds. That is also why the chart is silent on muscle, bone density, and fat distribution.
A weight height chart for women is a clinical reference tool that displays healthy weight ranges by height and BMI category. Practitioners use it to set a baseline and see whether a patient’s weight sits inside the normal band for her height. It screens rather than diagnoses.
The chart earns its keep in weight management programs, wellness practices, and metabolic health services that need one standardized reference. Practices running a structured program usually hold it inside their weight loss clinic software. The reference and the patient record then sit in one place.
Many versions also carry age-stratified data. Healthy weight norms shift across decades as body composition, muscle mass, and hormones change, and a chart that ignores that shift invites the wrong conversation.
Documentation is the other reason to use one. CMS wellness visit guidelines expect practices to capture baseline biometric data, and a structured chart in the patient record makes that capture auditable.
BMI is weight in kilograms divided by height in meters squared. It became the standard screening number because it tracks health risk across large populations. It did not become standard because it describes any one patient well.
The CDC and the National Heart, Lung, and Blood Institute (NHLBI) define four categories:
Convert those thresholds at a given height and you have the chart. A woman who is 5 ft 4 in (163 cm) sits in the normal range between 108 and 145 lb (49 to 66 kg).
Read the whole set at once and a pattern shows up that a single row hides. The normal band is not a fixed number of pounds wide.
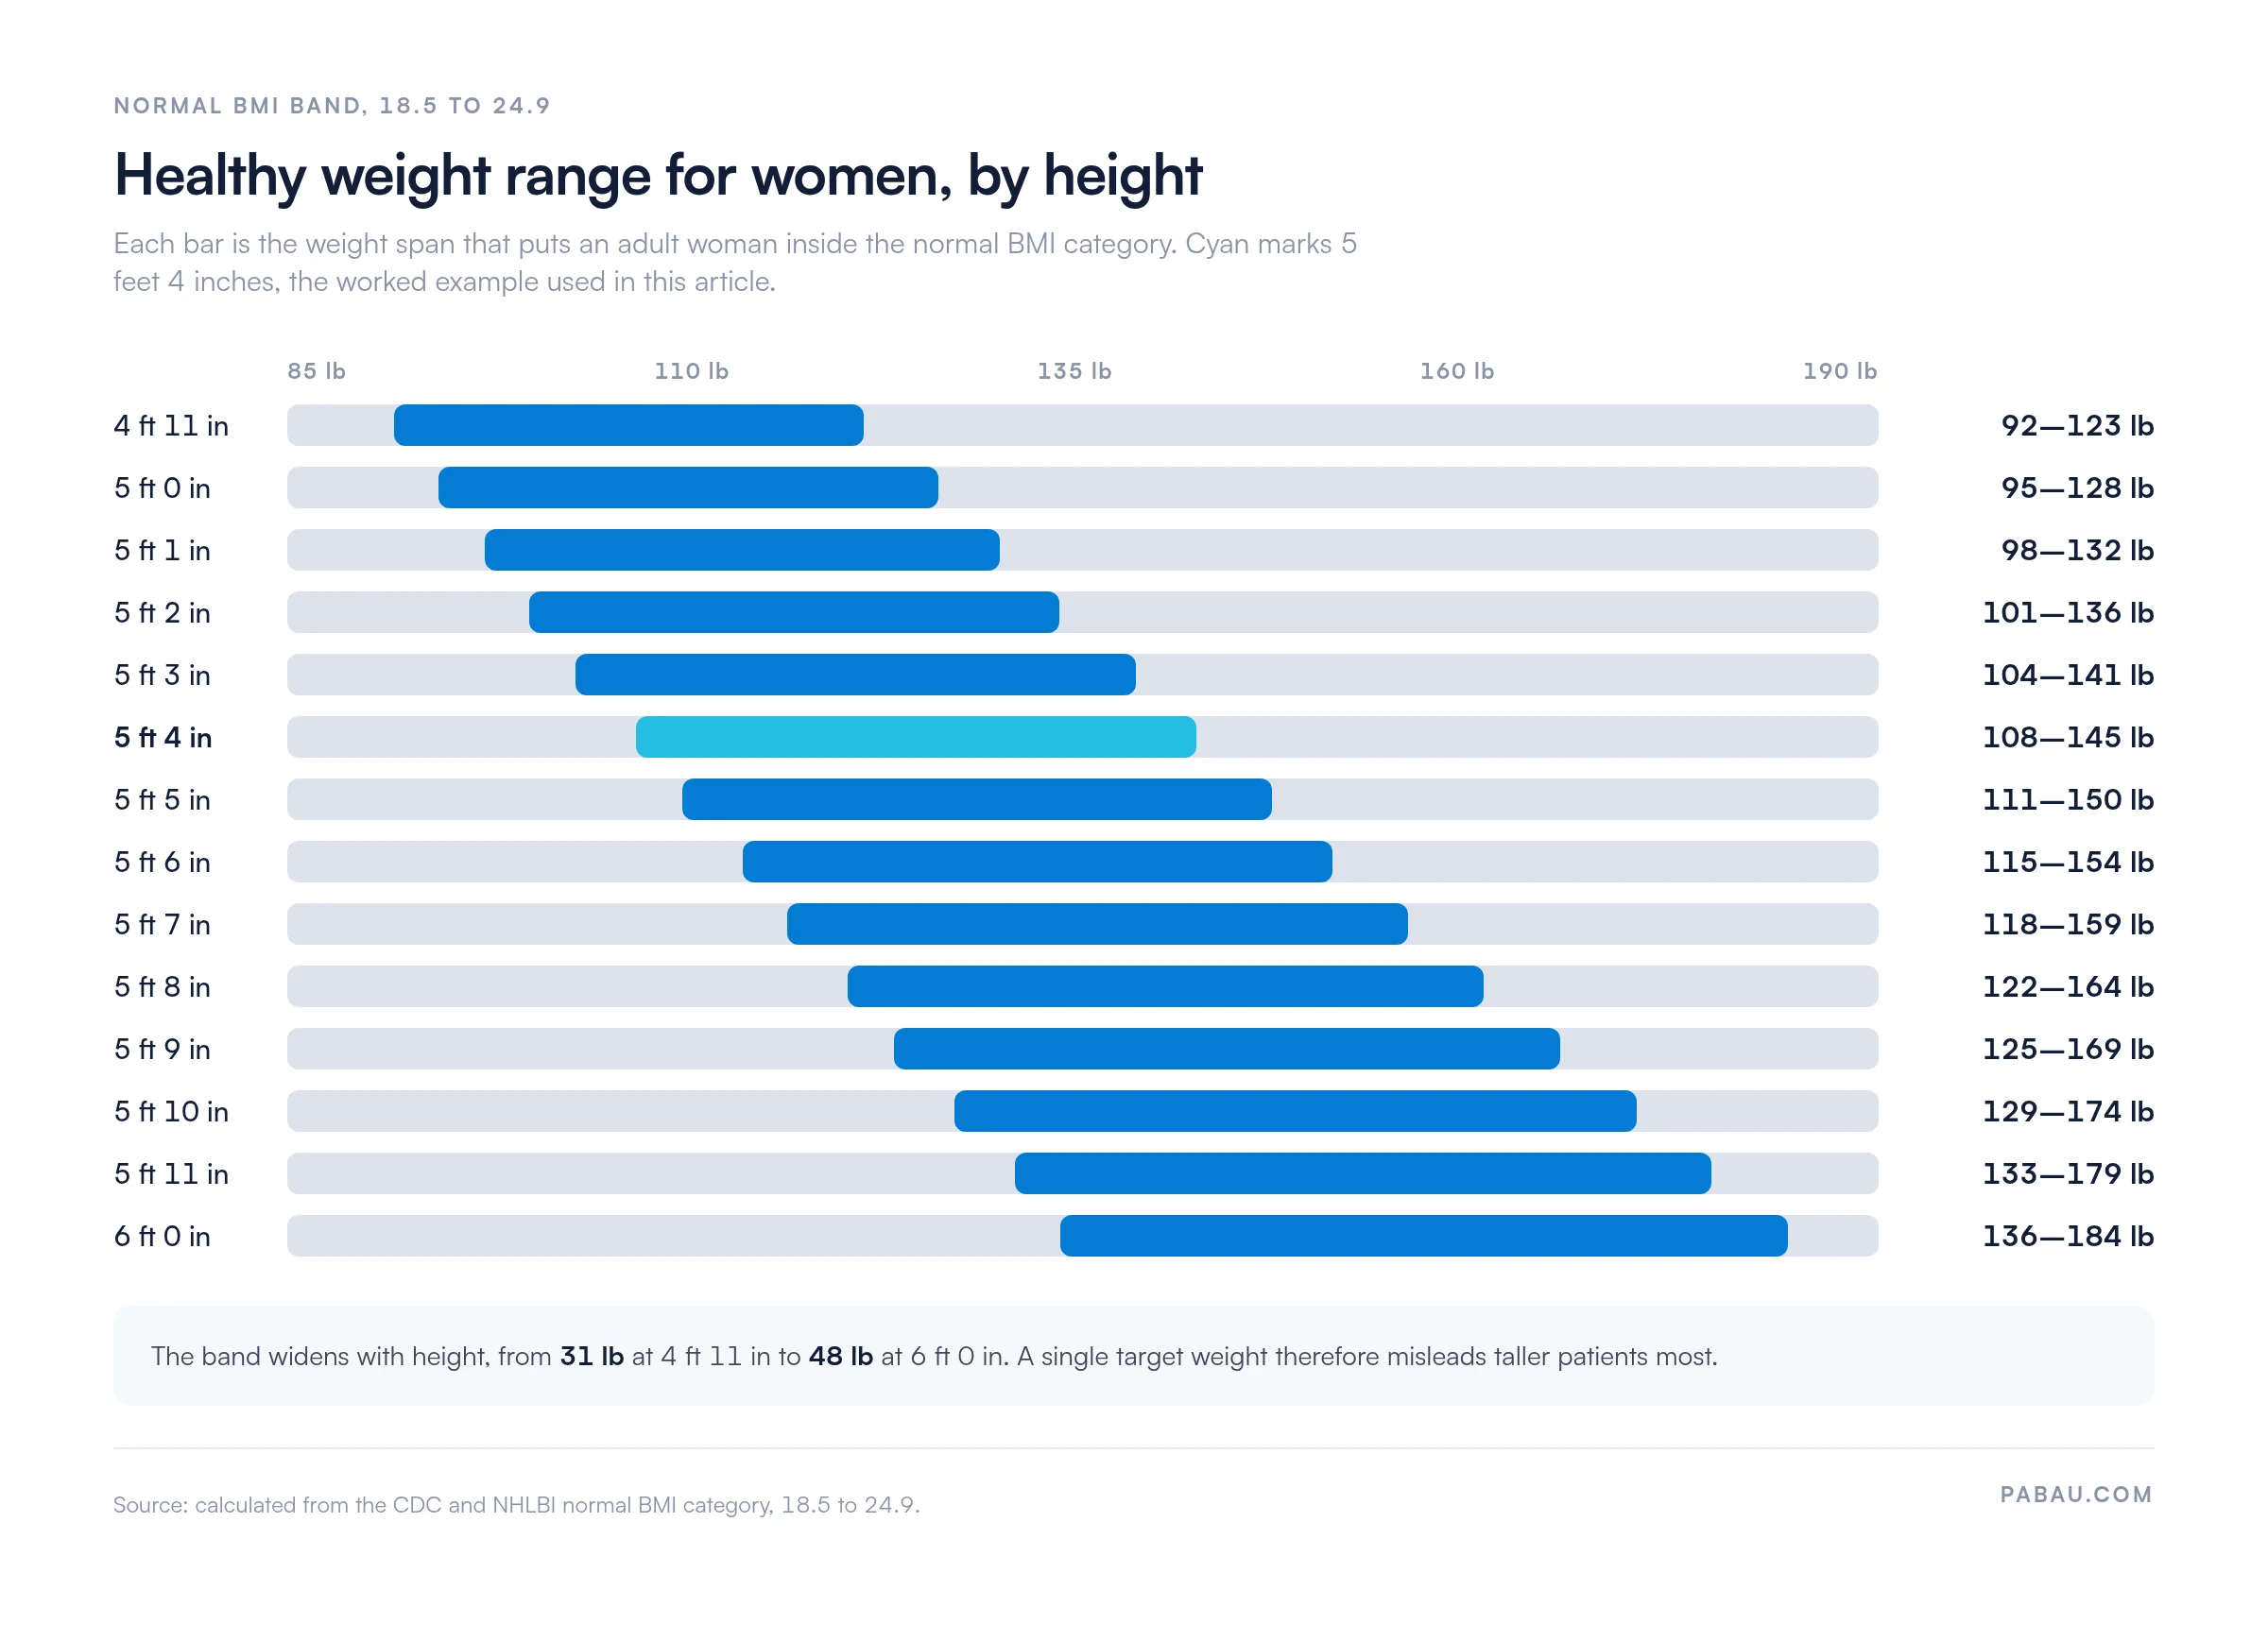
That widening matters in the room. A 5 lb change carries more weight for a patient at 4 ft 11 in than for one at 6 ft 0 in. A shared target weight quietly penalizes the taller patient.
Recording the numbers is the other half of the job. Measurement tracking software stores baseline height and weight, then flags the readings that call for a conversation about nutrition, activity, or referral.
Healthy weight does not hold still across a woman’s lifespan. Average weight for women in the US climbs gradually from the 20s through the 50s, then flattens or dips slightly after 60. Muscle mass, bone density, and metabolic rate all move underneath that curve.
Naming these shifts out loud changes the conversation. A patient who expects her 50s to look like her 30s reads a 10 lb rise as failure. The chart and the physiology both say otherwise.
BMI screens for risk. It does not measure body fat, and the CDC says so plainly. Four limits bite hardest in female patients.
Muscle mass and body composition: BMI cannot tell muscle from fat. A female athlete with high muscle mass can land in the normal or even the overweight category while carrying a low body fat percentage.
Bone density and age: Women lose bone density after menopause. That lowers overall body density without indicating poor health, and BMI makes no adjustment for it.
Ethnicity and genetic variation: The thresholds came mainly from white populations. The WHO has recommended lower action points for Asian populations, with overweight starting at a BMI of 23.0 rather than 25.0.
Fat distribution: A woman carrying weight around her abdomen faces different risks from one carrying it across hips and thighs. BMI reports neither pattern.
Two women of identical height and weight can therefore carry very different risk. A structured body mass index assessment pairs the chart with waist circumference, body fat percentage, and waist-to-hip ratio before anyone reaches a conclusion.
Three measurements fill in what BMI leaves out. They matter most when a patient sits near a category boundary, or when her build makes the single number suspect.
Abdominal fat is metabolically active and tracks with insulin resistance, cardiovascular disease, and type 2 diabetes. The NHLBI puts the lower-risk threshold for women below 35 inches (88 cm). This one measurement often surfaces the risk that BMI missed.
Waist-to-hip ratio divides waist circumference by hip circumference and describes where the weight sits. WHO guidelines put a healthy ratio for women below 0.85. It separates abdominal carriage, which raises metabolic risk, from hip and thigh carriage, which does not to the same degree.
Body fat percentage is the share of total body weight made up of fat mass. Healthy ranges for women usually run from 18 to 25 percent. Age and fitness level move that band. Bioelectrical impedance scales, DEXA scans, hydrostatic weighing, and skinfold calipers all measure it, but each needs equipment and training that BMI does not.
Most practices fold height and weight into the vital signs check at intake. A staff member records both, and the practitioner reads them against the chart to see whether the patient is tracking inside her healthy range.
A significant rise since the last visit gives the conversation an objective starting point. The cause may be lifestyle, medication, or an underlying condition. Steady readings inside the normal band do work too, because they confirm to the patient that her efforts are holding.
Store the chart in the digital record alongside the measurements. Digital intake forms capture height and weight at every visit, which builds a longitudinal record showing the trend rather than one isolated point.
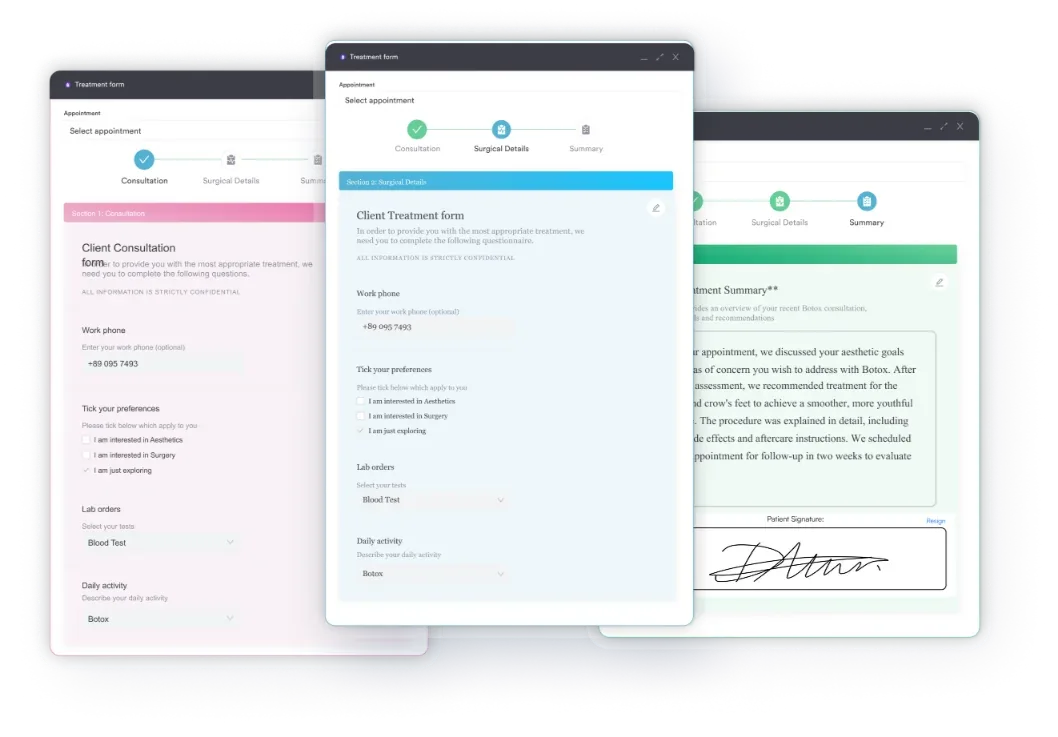
The template above is ready to print and customize. Six steps take it from download to a working part of the visit.
A new patient needs more than height and weight before a program starts. A weight loss intake form gathers medication history, previous attempts, and goals in the same sitting, so the baseline is complete on day one.
The chart starts the clinical conversation. It does not end it, and referral depends on the full picture.
Qualify every referral with medical history, family genetics, age, and the patient’s own goals. A woman one year postpartum at BMI 26.5 needs a different conversation from one with a decade of untreated obesity behind her.
Most practices capture height and weight on paper or in a vitals field nobody ever charts over time. The number gets written down, the trend gets lost, and the next practitioner starts from a blank page.
Pabau stores each measurement against the visit it came from. Intake forms feed the values straight into the client record, so no one retypes them. Waist circumference sits alongside height and weight rather than in a separate note.
What you get is a trend you can open in the room. Show the patient a year of readings, point at what moved and when, and agree the next step from the same screen. The chart tells her where the range is, and the record tells her where she is going.

Pabau’s measurement tracking and digital intake forms record height, weight, and waist circumference at each visit. Your team sees the trend in the patient record instead of hunting through separate notes.

The chart’s value is consistency, not precision. Every practitioner in the practice reads the same ranges, documents the same baseline, and describes the result to the patient in the same terms.
Its limit is just as firm. BMI cannot see muscle, bone, or where fat sits. A reading near a category boundary should send you for a tape measure rather than a diagnosis.
Print the template, keep it at the vitals station, and record every reading in the patient record rather than on the chart itself. Book a demo to see how Pabau tracks height, weight, and waist measurements across a patient’s whole history.

Need the same reference for male patients? The men’s BMI chart gives the equivalent height and weight bands for men.
Documenting care for a patient with obesity? The obesity nursing care plan sets out goals, interventions, and evaluation criteria you can adapt.
Comparing systems for a weight management service? EMR for a weight loss clinic covers the features that matter when measurements drive the treatment plan.
A woman who is 5’2″ (157 cm) sits in the healthy range at approximately 101-136 lbs (46-62 kg). That corresponds to a BMI of 18.5-24.9. Muscle mass, age, and body composition all shift what is ideal for an individual, so read the range alongside waist circumference and clinical assessment.
No. BMI does not account for muscle mass, bone density, fat distribution, or ethnicity. Waist circumference, body fat percentage, and waist-to-hip ratio each add what it misses. A full assessment combines several measures with clinical judgment.
No, the BMI categories stay the same at every age. Average weight for women does rise roughly 5-15 lbs between the 20s and the 50s, driven by muscle loss and hormonal change. Age-stratified norms help you judge whether a rise reflects normal physiology or needs investigation.
The NHLBI puts it below 35 inches (88 cm). A waist above that threshold signals raised risk of cardiovascular disease and type 2 diabetes, even when BMI sits in the normal range.
Measure at every visit and record the trend in the patient record. Quarterly review is standard in weight management practices, while an annual check suffices for stable wellness patients. A change of more than 5 lbs in a month warrants investigation.