Head to toe assessment cheat sheet: Printable nursing guide
A head to toe assessment cheat sheet gives you one fixed order at the bedside, s...

2
Last Updated: Oct 23, 2026

A glucose reading chart maps blood glucose measurements to clinical categories by timing, separating normal readings from prediabetic, diabetic, and dangerous ones.
Normal fasting blood glucose for non-diabetic adults is 70-99 mg/dL (3.9-5.5 mmol/L). Post-meal readings should stay below 140 mg/dL (7.8 mmol/L) under ADA guidelines.
Targets shift with age. Children on insulin aim for 100-180 mg/dL fasting, while teens aim for 70-150 mg/dL and healthy older adults for 100-140 mg/dL.
The free download is a blank one-page log sheet the patient fills in. The reference ranges, age tiers, and unit conversions stay on this page.
Practice management software like Pabau stores each reading in the patient record, so the trend is visible at the next visit without a paper log.
A printable one-page log sheet with fields for patient name, date range, target range, notes, and one dated reading with its time. It holds a single entry, so print a copy for each reading the patient records.
Download templateBlood glucose monitoring sits at the center of metabolic health management, but a reading only makes sense against a range. A glucose reading chart organizes those ranges by age, meal timing, and diabetes status. That lets you decide quickly whether a patient’s measurement is normal, prediabetic, or cause for same-day action. The logic is the same on paper as it is in a metabolic health EMR.
Clinicians in metabolic health, primary care, diabetes education, and wellness practices use these charts to standardize patient education. The same reference works whether you are reviewing a fasting lab result, reading a finger-stick during a visit, or coaching a patient on home monitoring.
This guide covers the chart’s structure, what each range means clinically, and how to work it into consultations and follow-up care. It also spells out what the free download does and does not contain, so nobody opens the file expecting a reference table.
The download is a blank log sheet rather than a reference chart. Opening it gives you one printable page with these fields:
The sheet carries one dated entry line, so it works best as a single-reading record. Print it in batches, or clip it into a paper chart. It contains no age tiers, no normal or prediabetic categories, and no mg/dL to mmol/L conversion table. Those live in the tables further down this page.
Write the agreed target range onto the sheet before you hand it over, and point the patient to this page for the interpretation.
A printed log suits any practice that asks patients to record readings between visits:
Patients who prefer paper, or who do not use a smartphone, get the most from it. For everyone else, logging readings straight into the patient record saves a transcription step and the errors that come with it. Practices running a structured metabolic program usually capture readings in their weight loss clinic software instead, alongside weight and medication changes.
A glucose reading chart is a reference table that maps blood glucose measurements to clinical categories. It answers one question. Is this reading normal for this person at this time of day?
The chart organizes readings by three variables:
Blood glucose is reported in two unit systems. The United States and Canada use milligrams per deciliter (mg/dL), while the UK, Europe, Australia, and most other countries use millimoles per liter (mmol/L). A usable chart carries both, so clinician and patient can each work in their own standard.
The foundation of any glucose reading chart is the normal range for non-diabetic adults. These are the benchmark thresholds published by the American Diabetes Association (ADA):
These ranges assume the person has no diabetes diagnosis and no symptoms of metabolic dysfunction. Readings above them warrant further investigation. A fasting glucose of 100-125 mg/dL (5.6-6.9 mmol/L) signals prediabetes. At 126 mg/dL (7.0 mmol/L) or higher on a repeat test, the result meets the diagnostic threshold for Type 2 diabetes.
Those numbers are diagnostic thresholds rather than treatment goals. A patient already diagnosed with diabetes works to ADA treatment targets instead. Those are 80-130 mg/dL (4.4-7.2 mmol/L) before meals, and below 180 mg/dL (10.0 mmol/L) at the post-meal peak. Both sit above the non-diabetic normal range, deliberately, to keep hypoglycemia risk down.
Age changes the target. Younger patients tolerate tighter ranges, while older or frail adults benefit from looser ones that reduce the risk of a dangerous low. The chart below puts every tier on one scale, and the tables under it give the detail.
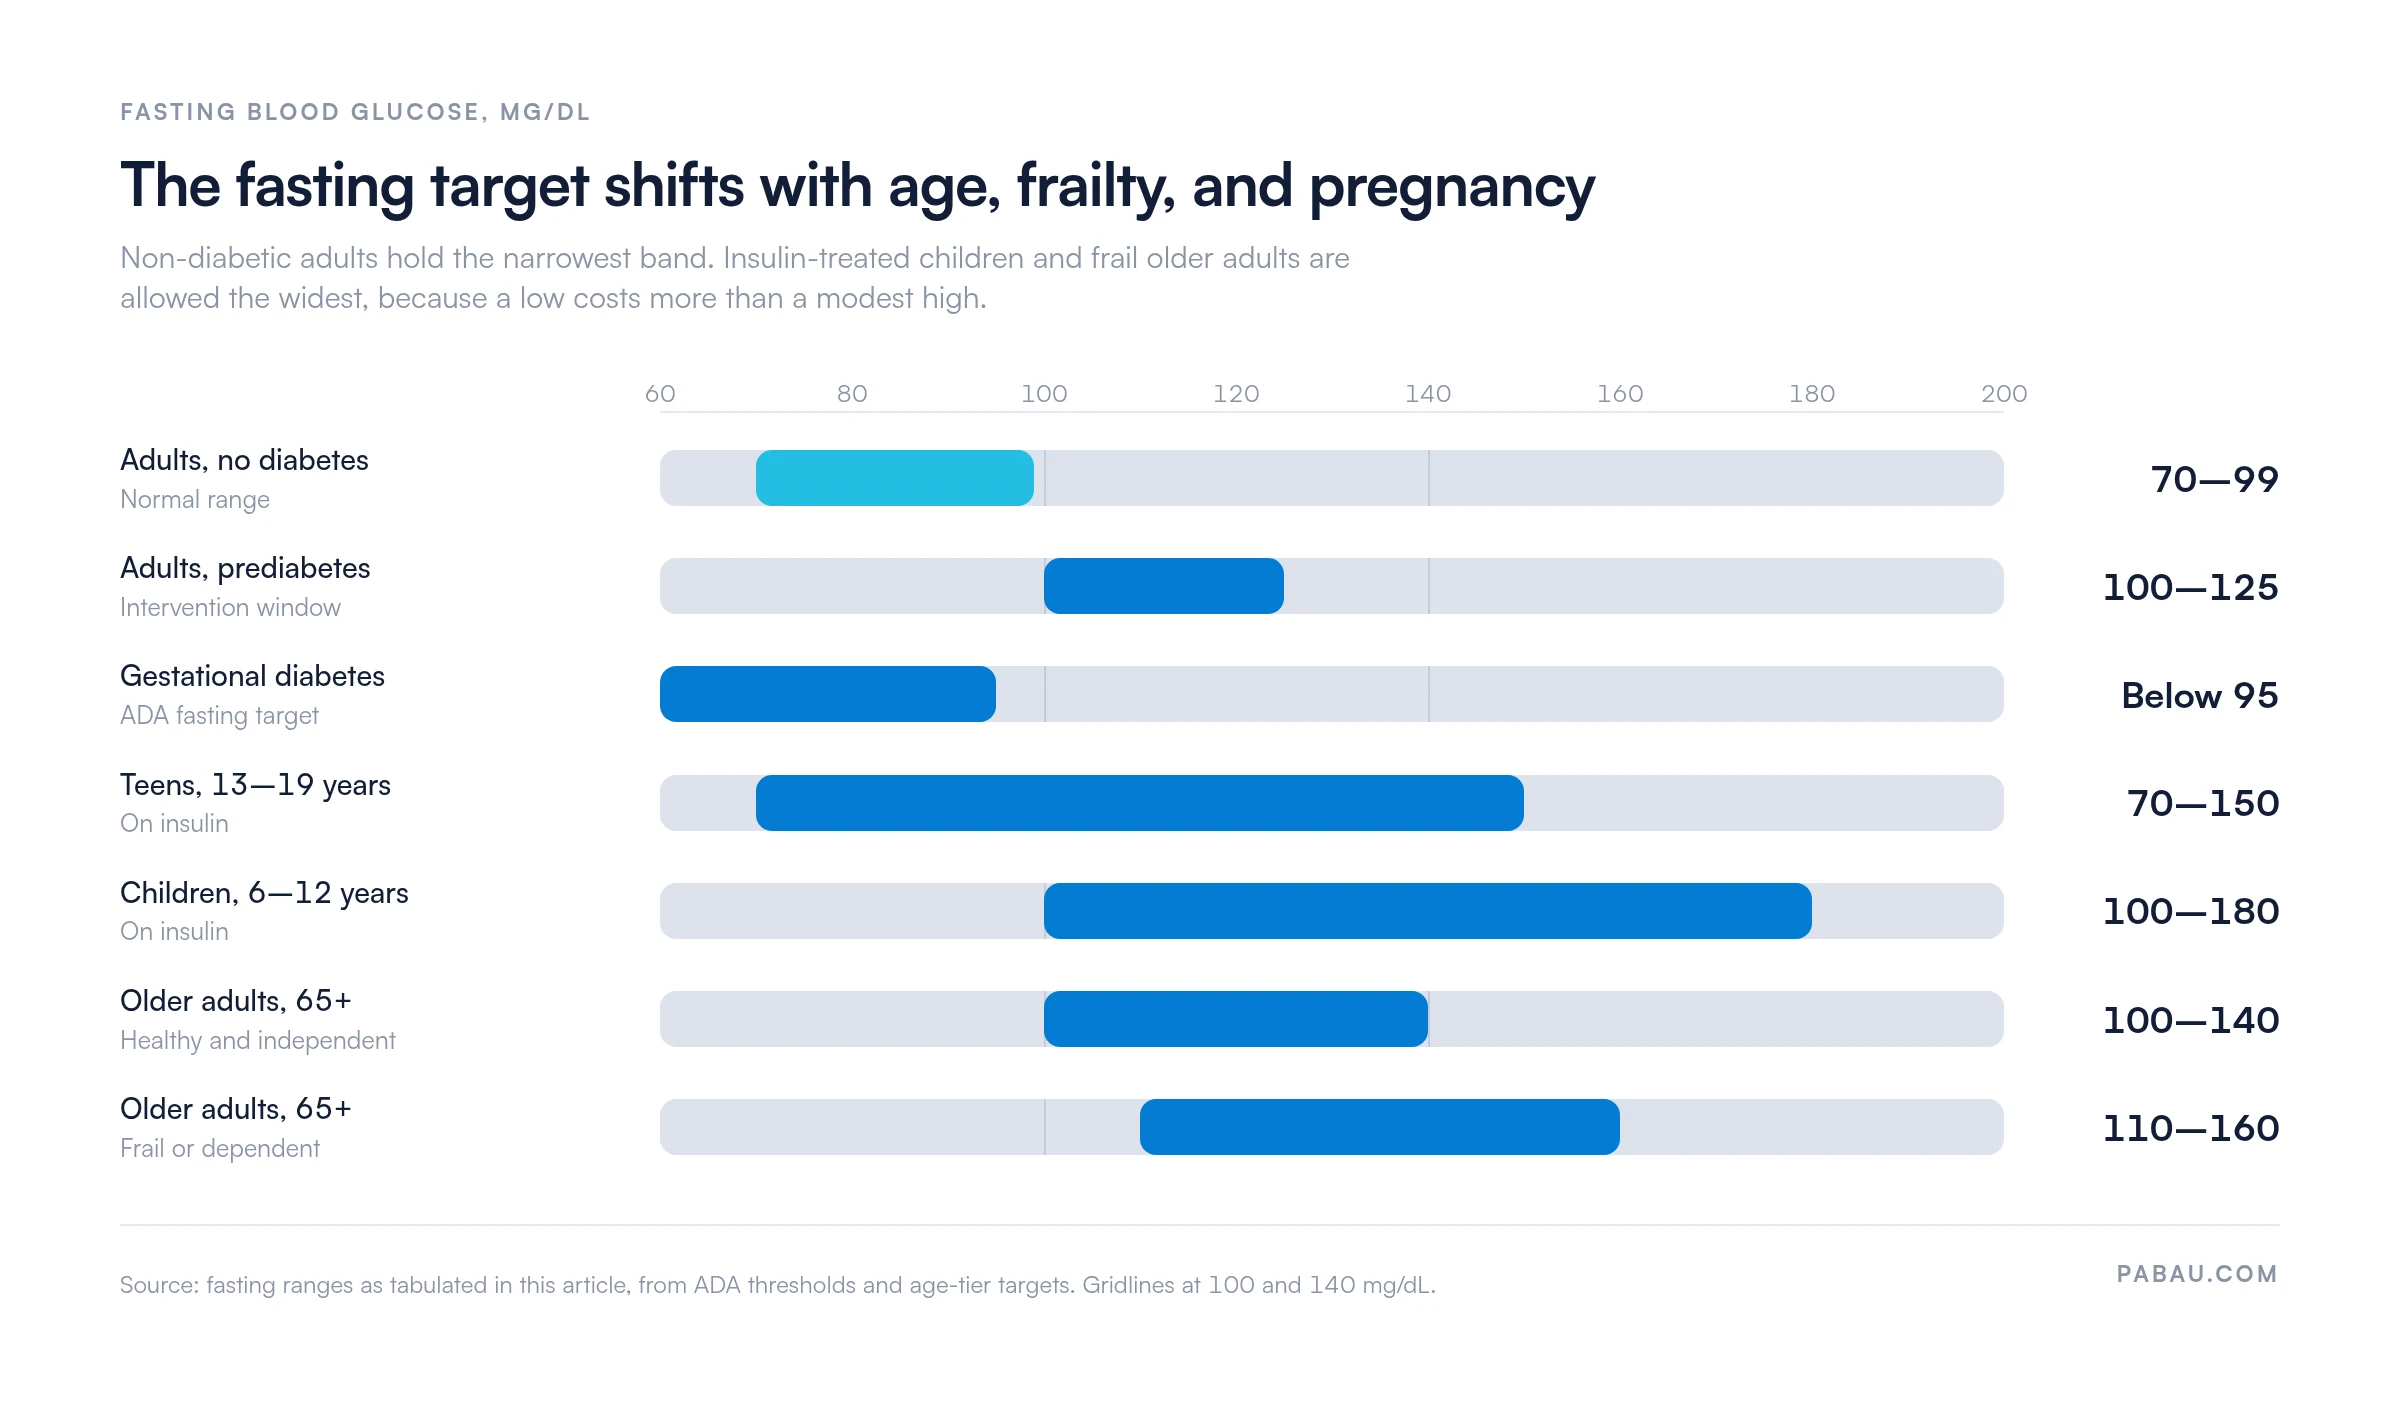
Young people have different baseline glucose patterns than adults, driven by higher metabolic rates and irregular meal timing. Typical target ranges are:
These wider ranges apply mainly to children and teens with Type 1 diabetes. Children without diabetes follow the adult normal ranges once they reach school age.
This is the population the standard glucose targets were written for:
Adults in this band make up most of the caseload in primary care and preventive health, which makes this the tier practitioners reach for daily.
Older adults often do better with a slightly higher fasting glucose, because a low can cause falls, cognitive decline, and cardiac events in this group. Targets here are individualized by functional status:
The principle is to avoid aggressive glucose lowering unless the patient is cognitively intact, mobile, and living independently. Recording functional status in the patient record is what lets whoever sees them next apply the right tier.
Point-in-time readings show the moment. The HbA1c (glycated hemoglobin) test reflects average blood glucose over the preceding two to three months. Pairing the two gives you the snapshot and the trend:
The estimated average glucose column comes from the ADA conversion formula, where average mg/dL equals 28.7 multiplied by the A1c percentage, minus 46.7. A standalone A1C conversion chart covers the full percentage range if you convert results often.
The A1c target for most adults with diabetes is below 7% (53 mmol/mol). Older or frailer patients may safely sit at 7-8% (53-64 mmol/mol) to reduce hypoglycemia risk.
Prediabetes is the intervention window, and any one of three tests can establish it:
The CDC puts roughly one in three American adults in this range, and most of them do not know it. A single borderline fasting result is not a diagnosis, so repeat the test or order an A1c before you label anyone. Where the fasting value and the A1c disagree, a glucose tolerance test settles it.
Patients in this window respond well to structured monitoring and lifestyle coaching. A printed target range and a log sheet give them something concrete to work against between appointments.
Pregnant patients with gestational diabetes need tighter targets, because sustained highs raise the risk of complications for mother and baby alike:
Gestational care involves frequent monitoring and regular dietary or insulin adjustment. A shared target range keeps the diabetes educator, the midwife, and the patient working from the same numbers between appointments.
Patients need to know which readings call for action today and which can wait for the next visit. Both hypoglycemia and hyperglycemia carry immediate clinical risk:
Patients on insulin or insulin-releasing medications carry the highest hypoglycemia risk. Marking these thresholds on the sheet the patient takes home is what turns a log into a safety net.
Practices with international patients need a conversion reference on hand. The factor is 18.0182. Divide mg/dL by that figure to get mmol/L, or multiply mmol/L by it to get mg/dL.
A digital form can show a reading in both units at once, which removes the arithmetic for practices treating patients from several countries.
The chart earns its keep when it sits inside a monitoring workflow rather than in a folder. Five steps cover most of the ground:
Reviewing the chart together during a consultation also lifts engagement. A patient portal can hold the ranges alongside lab results, so the patient reviews both in one place at home.
Readings move through the day for reasons that have nothing to do with diet. Knowing the drivers helps you counsel patients on measurement timing and on how much weight to give a single result:
Teaching patients these drivers prevents them from over-reading a borderline result, which cuts both anxiety and overtreatment. Send that context home with the log sheet rather than saving it for the next appointment.
A paper sheet goes home with the patient, and the practice hopes it comes back. Readings then arrive as a phone photo, a crumpled page, or a verbal summary, and only some of them reach the record. The trend a clinician needs gets lost in the handover.
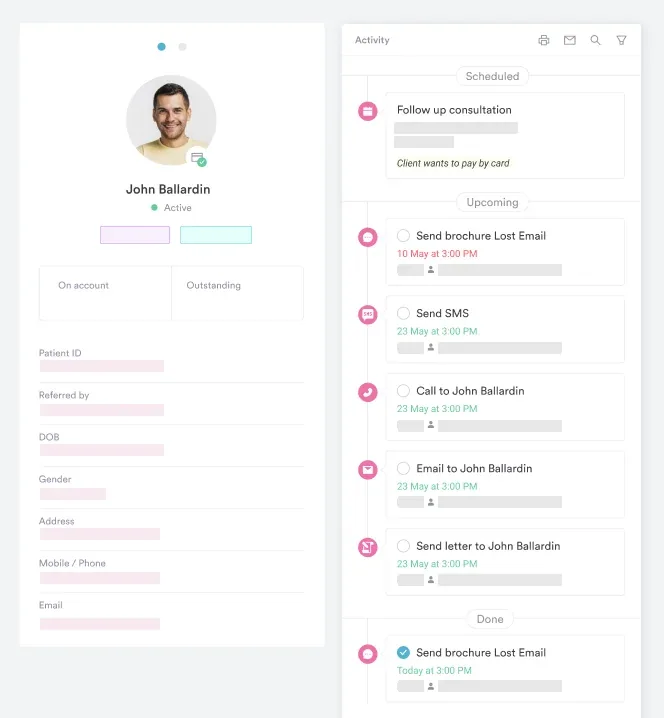
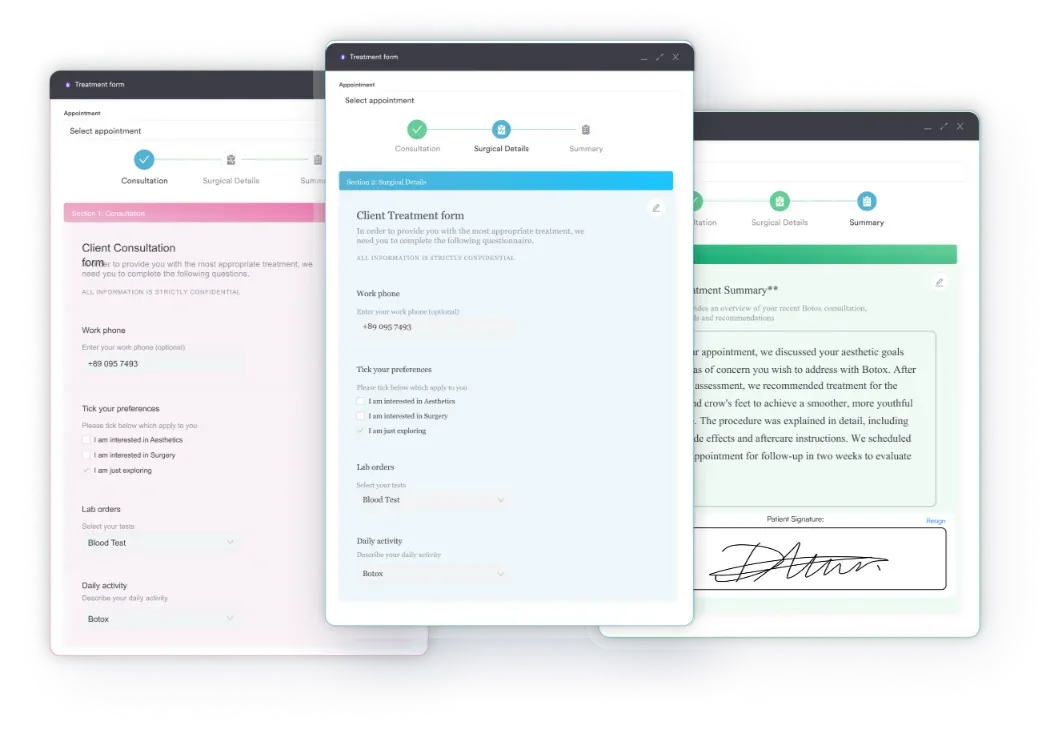
Practice management software like Pabau closes that loop. Custom forms send the same fields as the printed sheet to the patient portal, so the reading lands in their record instead of on paper.
Measurement tracking then plots every entry over time. A column of numbers becomes a trend line you can read at a glance, next to the weight and medication history.
Automated recalls handle the follow-up. A prediabetic patient due for a repeat fasting glucose in three months gets the reminder without anyone watching a diary. The agreed target range stays on the record too, so whoever sees the patient next reads each number against the right benchmark.

Pabau’s digital forms, measurement tracking, and automated recalls capture readings from patients, plot the trend over time, and prompt the next check without manual chasing.

A reading on its own is just a number. A glucose reading chart is what turns it into a decision: reassure, retest, counsel, or escalate today. Age, frailty, and pregnancy all move where those lines sit, which is why a single universal target range does more harm than good.
The download that goes with this article is deliberately plain. It is a blank sheet the patient writes on, and the interpretation stays here on the page with you. That split works on paper, but it starts to cost you the moment you want a trend rather than a snapshot.
Decide where home readings will live before you ask a patient to start recording them. Book a demo to see how Pabau captures patient-reported glucose readings, tracks them over time, and prompts the next check on schedule.

Need to turn an A1c into an average glucose? A1C conversion chart maps each percentage to its estimated average glucose using the ADAG formula.
Setting A1c goals across age groups? A1c goals by age chart lays out the target bands for each age group and the reasoning behind them.
Need to resolve an ambiguous fasting result? Glucose tolerance test covers patient preparation, the timed draws, and how to read the results.
Tracking insulin resistance alongside glucose? Insulin resistance levels chart carries the core reference thresholds and the diagnostic tests worth ordering.
The download is a blank one-page log sheet. It has fields for patient name, date range, target range, notes, and one dated reading with its time. The age tiers, normal and prediabetic categories, A1c equivalents, and unit conversions are on this page rather than in the PDF.
Normal fasting blood glucose for non-diabetic adults is 70-99 mg/dL (3.9-5.5 mmol/L), and below 140 mg/dL (7.8 mmol/L) two hours after a meal. These are the ADA standard thresholds. Age and individual health status may shift the target.
Hypoglycemia below 70 mg/dL (3.9 mmol/L) needs immediate fast-acting carbohydrate. Below 54 mg/dL (3.0 mmol/L) is a medical emergency. Hyperglycemia above 250 mg/dL (13.9 mmol/L) warrants same-day contact with a provider. Above 300 mg/dL with ketones present signals possible diabetic ketoacidosis, which is an emergency.
Find the age group, then match the reading to its timing, fasting or post-meal. A result in the normal band means control is good. The prediabetes band calls for lifestyle modification, and the diabetes band needs medical follow-up and possibly medication. Check the danger thresholds to know when to seek emergency care.
mg/dL (milligrams per deciliter) is the unit used in the United States and Canada. mmol/L (millimoles per liter) is used in the UK, Europe, Australia, and most other countries. To convert mg/dL to mmol/L, divide by 18.0182. To convert mmol/L to mg/dL, multiply by 18.0182. Both describe the same glucose concentration in different units.
Normal A1c for non-diabetic adults is below 5.7% (below 39 mmol/mol). Prediabetes is 5.7-6.4% (39-47 mmol/mol), and diabetes is 6.5% or higher (48+ mmol/mol). The A1c target for most adults with diabetes is below 7% (53 mmol/mol). Older or frailer patients may safely tolerate 7-8% to reduce hypoglycemia risk.