Head to toe assessment cheat sheet: Printable nursing guide
A head to toe assessment cheat sheet gives you one fixed order at the bedside, s...

2
Last Updated: Oct 23, 2026

The star excursion balance test (SEBT) measures dynamic postural control while a patient stands on one leg and reaches in up to eight directions.
Score it by summing three reach distances, dividing by three times limb length, then multiplying by 100.
A composite score below 94% of limb length and an anterior asymmetry above 4 cm both flag raised injury risk in athletes.
Chronic ankle instability, ACL reconstruction, and athlete screening cohorts carry the most published reference data.
Pabau’s measurements tracking software records reach distances, composite scores, and limb symmetry values in the patient record across sessions.
Balance deficits after a lateral ankle sprain are poorly detected by static tests. The star excursion balance test (SEBT) exposes them, because it loads strength, flexibility, and proprioception at once. Clinicians often shorten it to the SEBT test, and it remains one of the most useful dynamic assessments in sports medicine and physical therapy.
Developed in the 1990s, the SEBT asks a patient to stand on one leg and reach as far as possible with the other. Eight lines are taped on the floor at 45-degree increments. The reach distance, normalized to limb length, produces a composite score for dynamic postural stability. Clinicians working in a physical therapy EMR can track that score across a whole course of rehabilitation.
This guide covers setup and administration, the composite score and limb symmetry index (LSI) calculations, and the normative reference data. It then shows how to read a series of scores when a return-to-sport decision is due.
Use the star excursion balance test in five situations, each one where static balance testing misses the deficit.
Patellofemoral pain belongs on the list too, in a smaller way. Patients with it reach shorter distances anteriorly than controls. That makes anterior reach worth recording even when the knee, not the ankle, is the complaint.
The American Physical Therapy Association (APTA) lists the SEBT and the modified SEBT among its evidence-based practice resources for lower extremity assessment. Its summary notes good-to-excellent reliability and established validity for detecting dynamic postural control deficits.
The SEBT needs almost no equipment, which is part of its clinical appeal.
Mark a center point on the floor, then tape eight lines outward at 45-degree increments. The diagram in the next section names each one. Run every line at least 120 cm from the center so a tall patient does not reach past the tape.
A pre-printed star excursion balance test mat is the cheapest way to remove setup variability, because the lines never drift between sessions. A commercial star excursion balance test kit adds a fixed measuring device to that mat. That matters most when several clinicians test the same patient, which is where hand-taped setups lose the most accuracy.
Standardize every administration, because inter-session reliability is what makes serial testing worth doing. The star excursion balance test protocol below follows the procedure in the APTA evidence-based practice summary.
A trial is disqualified and repeated if the patient does any of the following.
Note how many trials you had to repeat, next to the score. A patient who needs six attempts to produce three clean anterior reaches has a control problem the composite score will never show.
Each direction loads the hip, knee, and ankle differently. That is why a direction-specific result often tells you more than the composite score does.
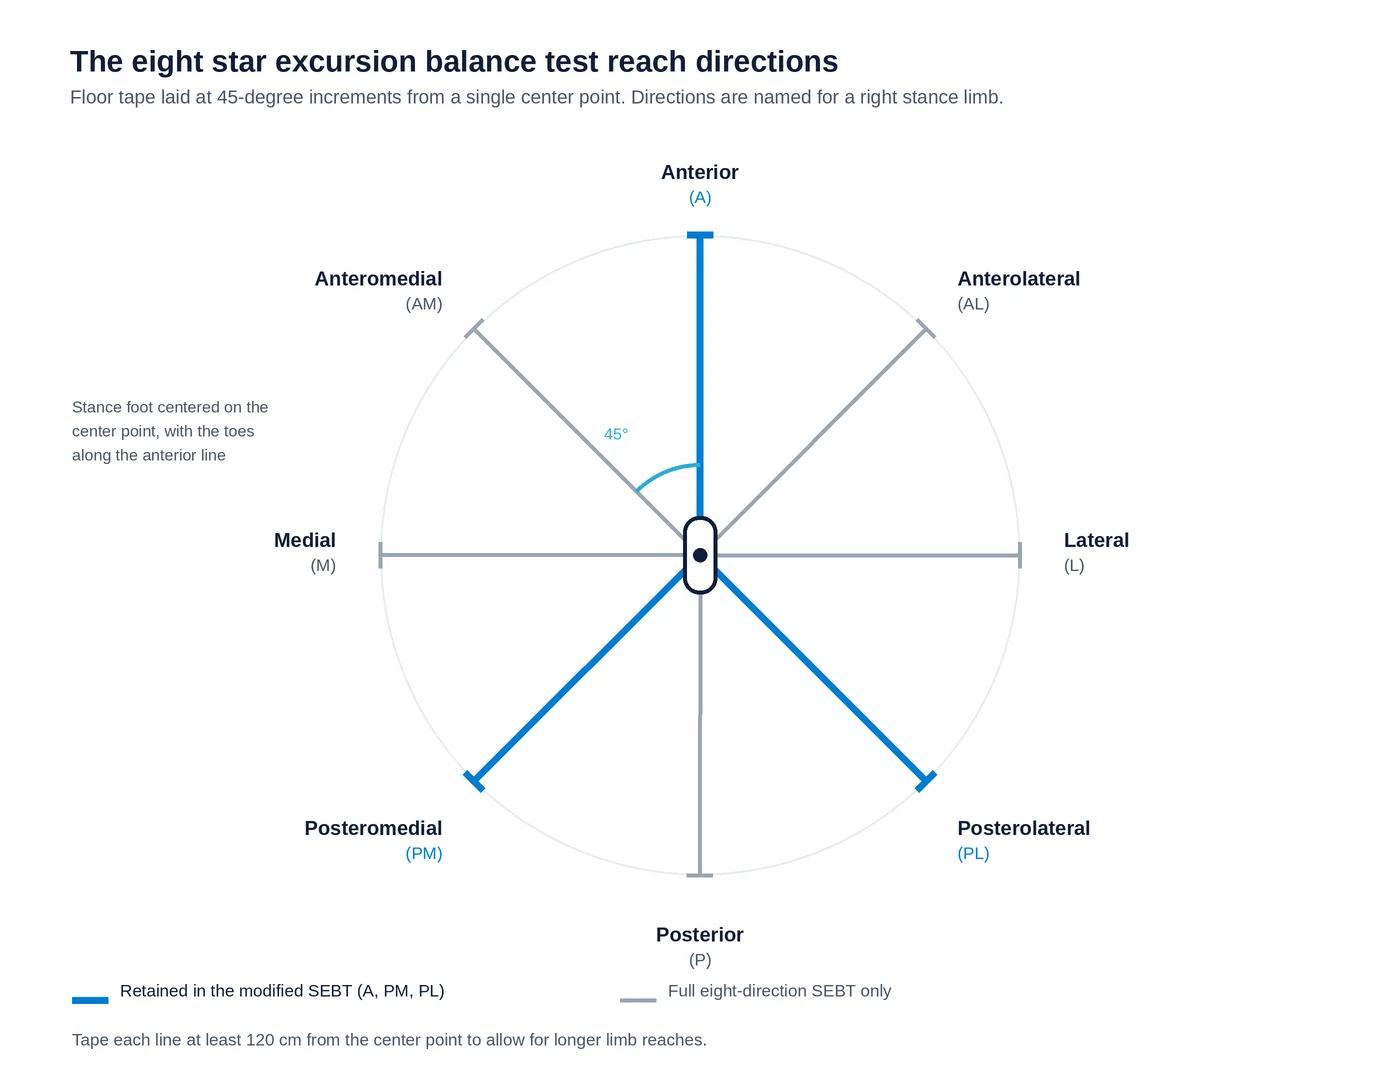
The three highlighted lines are the ones the modified SEBT keeps. The table below adds the main demand each direction places on the limb.
Those three are retained because they carry the highest reliability and account for most of the variance in the composite score. Posteromedial reach on its own separates people with chronic ankle instability from controls about as well as the full eight do. That finding is summarized in this systematic review of SEBT research.
The composite score is the anterior, posteromedial, and posterolateral reach distances added together, divided by three times limb length, then multiplied by 100. Raw distances cannot be compared between patients, because a taller patient reaches further for the same amount of postural control.
Composite score formula
Composite score (%) = (A + PM + PL) / (3 x limb length) x 100
A, PM, and PL are the maximum reach distances in centimeters. Limb length runs from the ASIS to the medial malleolus on the same limb.
Work the star excursion balance test calculation in four steps, one limb at a time.
Worked example: anterior 68 cm, posteromedial 92 cm, posterolateral 88 cm, limb length 89 cm. The sum is 248 cm and three times limb length is 267 cm. The composite score is 92.9%.
The LSI compares the involved limb against the uninvolved limb. It is the more useful number early in rehabilitation, because it sidesteps the question of which population norm applies.
Limb symmetry index formula
LSI (%) = (Involved composite score / Uninvolved composite score) x 100
Both composite scores must come from the same test version and the same session. Mixing the full SEBT with the modified version breaks the comparison.
Research summarized by Science for Sport links an LSI below 89% to raised injury risk in athletes with a history of lateral ankle sprain. Treat that as a flag for closer evaluation rather than a clearance rule, because cut-offs shift with population and limb tested.
Record the raw reach distances as well as the composite percentage every session. Raw values reveal a direction-specific deficit, such as isolated posteromedial weakness, that an unchanged composite score can hide completely.
No single normative composite score exists for the star excursion balance test. Published means run from about 83% of limb length in healthy women in their sixties to 107% in collegiate athletes. Star excursion balance test norms are only useful once you match the patient to the closest published group.
Every ranking clinical resource cites some of these figures, but they sit scattered through prose. The table below pulls the cut-offs, reference means, and asymmetry thresholds into one place, with the population attached to each one.
Two things stand out once the numbers sit side by side. First, the healthy and unstable ranges overlap heavily, so no single score diagnoses instability. Second, the scoring method moves the composite further than the pathology does.
In the pooled instability analysis, stance position and trial-scoring choice shifted the composite by more than 25 percentage points. Best-of-three and mean-of-three are not the same measure. The difference between the instability and control groups was a fraction of that spread.
Age deserves the same caution as sport. Composite scores in healthy women fall from roughly 91% in their fifties to about 83% in their sixties. Read an active 65-year-old against collegiate athlete norms and you will record a deficit that is not there.
The SEBT is reliable enough for serial use when one tester follows the same protocol every time. Sound star excursion balance test interpretation rests on two numbers. The intraclass correlation coefficient (ICC) shows how repeatable the measurement is. The minimum detectable change (MDC) shows how large a change must be before it means anything.
The inter-rater figures carry the practical lesson. Reliability between two testers was poor on their first day together and good on their second. Tester familiarization is therefore part of the protocol, not an optional extra, and so are the three practice trials per direction.
The MDC values change how you read a follow-up. A high school athlete whose anterior reach improves by 4% has not measurably improved, because the anterior MDC in that population is 5.38%. Posteromedial and posterolateral need close to 12% before the change clears measurement error.
On validity, the SEBT does what it claims for dynamic postural control, and it predicts injury at a group level. It is much weaker as an individual predictor. The collegiate football cut-off caught every injured player but also flagged many who stayed well, which is the trade-off any screening threshold carries.
Use the modified star excursion balance test whenever testing time is short, because it keeps the three most informative directions and drops the other five. The full eight-direction version takes 15 to 20 minutes per patient. The mSEBT keeps anterior, posteromedial, and posterolateral, and uses the identical composite formula.
Those are the same three directions as the y balance test, which is why mSEBT and Y Balance Test composite scores are broadly comparable. The published instability data is also strongest here. A participant-level analysis of 429 people pooled mSEBT reach across instability, control, and coper groups.
Reach for the mSEBT when any of the following applies.
Use the full SEBT when you need direction-specific deficits, such as isolated medial or lateral instability, to aim the rehabilitation program. Whichever version you choose, record which one it was. Good physiotherapy practice management means the whole team can see that decision in the patient record, because mixing versions across sessions destroys the trend.
The SEBT supports a return-to-sport (RTS) decision and never settles it alone. Used alongside strength testing and hop testing, it contributes the balance component of the battery. The most cited thresholds are an LSI at or above 89%, plus a composite score within one standard deviation of age-matched and sex-matched reference values. The return to running protocol used in physical therapy sets out the wider framework those numbers sit inside.
What makes the test useful at clearance is the series, not the single reading. Four values per session are enough to build it.
Three sessions of that data answer a question a single score cannot. It shows whether the athlete is still improving, has plateaued, or has moved only inside measurement error. Write the reasoning into the record next to the numbers, so the clearance decision is legible months later if the athlete is re-injured.
Choose the Y Balance Test when several clinicians test the same patients. Choose the tape-based SEBT when you need all eight directions, or when the equipment budget is near zero.
Inter-rater reliability is the whole reason. The Y Balance Test platform fixes the stance position and the reach indicators. A hand-taped floor drifts between testers and between sessions, which is exactly where reliability leaks away.
Put star excursion balance test vs Y Balance Test side by side and the composite formula is identical. A y balance test score and an mSEBT score therefore track one patient equally well over time. The differences that matter are setup, cost, and how many people will be holding the tape measure.
The kit costs $269.95 from the manufacturer’s own store. For a single clinician testing their own patients, tape and a tape measure produce data that is just as usable. For a team of four rotating through pre-season screening, the platform pays for itself in cleaner numbers.
What you cannot do is switch between the two partway through a rehabilitation course and read the difference as progress. Pick one, and note the choice in the patient record.
A SEBT record is only worth keeping if another clinician can reproduce it. That means logging the inputs, not just the composite percentage.
Following safer clinical note practices, every SEBT entry should carry the test version, both limbs’ scores, the LSI, and the reference values used for interpretation. That is what makes a clearance decision defensible if it is questioned a year later. Lab values deserve the same rigor: antibody titer results are only interpretable against a documented baseline.
Practice management software like Pabau turns that record into a trend. Pabau’s measurements tracking software takes reach distances, composite percentages, and LSI values straight into the patient record, then charts them across sessions.
So a clinician opening the file at week 10 sees the whole series instead of one reading. They can tell a genuine gain from measurement noise without rebuilding the history from paper logs. The numbers sit in the same client records as the treatment notes and consent forms. So the series travels with the patient if they change provider.
Practices looking after a squad rather than one athlete can pull outcome reports from the aggregated measurement data. That is the job sports medicine software does, and it removes the spreadsheet that usually sits between the assessment and the report.

Pabau’s measurements tracking software records reach distances, composite scores, and limb symmetry values in the patient record. Trend charts across sessions show whether an athlete is still improving, so clearance decisions rest on the series rather than one reading.

The reference data in this guide is context, not a verdict. The comparison that decides anything is the patient’s own uninvolved limb, measured the same way each time. The change also has to clear the MDC for that direction.
The trade-off worth remembering is precision against practicality. Tape and a tape measure cost nothing and give one clinician reliable data. A $269.95 platform buys that same reliability across a whole team.
Either way, the value only compounds if the numbers are recorded consistently and stay visible from session to session. Pabau’s measurements tracking software keeps composite scores and LSI values in the patient record with trend charts across sessions. Book a demo to see how it fits your assessment workflow.

Deciding whether an acute ankle needs imaging first? Ottawa ankle rules calculator walks through the decision rule you apply before SEBT tracking begins.
Managing a squad rather than one patient? Sports medicine software brings scheduling, clinical records, and measurement tracking into one system.
The star excursion balance test (SEBT) measures dynamic postural control. The patient stands on one leg and reaches as far as possible with the free limb. Lines are taped on the floor at 45-degree increments, in up to eight directions. Reach distance is normalized to limb length, which lets you compare patients of different heights. Clinicians use it to screen for lower extremity injury risk, to track ankle and knee rehabilitation, and to inform return-to-sport decisions.
The composite score is the anterior, posteromedial, and posterolateral reach distances added together, divided by three times limb length, then multiplied by 100. Limb length is measured from the anterior superior iliac spine to the medial malleolus. The limb symmetry index is the involved limb composite divided by the uninvolved limb composite, multiplied by 100.
There is no single normal value, so match the patient to a published population. High school basketball players averaged 100.9% of limb length in Plisky and colleagues’ 2006 cohort. Division I collegiate athletes fall roughly between 97% and 107% across sports and sexes. Healthy non-athletic young adults sit closer to 90%. Healthy women in their sixties average about 83%, so athlete norms do not transfer to older patients.
The Y Balance Test uses the same three directions as the modified SEBT, but runs them on a proprietary platform with sliding reach indicators. That fixed setup is why its inter-rater reliability reaches 0.97 to 1.00, against 0.35 to 0.93 for tape-based testing. The kit costs $269.95 from the manufacturer. The composite formula is identical, so scores are broadly comparable when either test is administered consistently.
Intra-rater reliability across the eight directions runs from 0.78 to 0.96, which is good to excellent. Inter-rater reliability is weaker, and it improves with tester practice. It rose from 0.35 to 0.84 on a first testing day to 0.81 to 0.93 on a second. Minimum detectable change is direction-specific. In high school athletes it is 5.38% for anterior reach and close to 12% for the posterior directions.
No. The SEBT contributes the balance component of a return-to-sport battery, nothing more. Clearance should also weigh limb strength symmetry, functional hop testing, and clinical examination. A limb symmetry index at or above 89% supports clearance after lateral ankle sprain without justifying it on its own. Composite limb symmetry after ACL reconstruction averages 97.1% at three months, so it normalizes long before the knee is ready.