GLP-1 usage by state: Who’s taking, searching and paying in 2026
GLP-1 usage by state peaks in West Virginia, America’s GLP-1 capital, with...

Last Updated: Oct 16, 2026
What state has the most plastic surgery per capita? Florida is America’s plastic surgery capital, with the most plastic surgeons per capita11. It anchors the South Atlantic, the top region at 780.7 cosmetic surgical procedures per 100k people in 2025, 5.4x the Northeast’s rate1. Washington is the plastic surgery search capital7, while Utah has climbed to 3rd for searches8.
We derived this data from a combination of our own research, plus publicly available sources. Add search demand, surgeon supply, injector density and price, and you get America’s cosmetic map — plastic surgery by state in 20 numbers.

Florida is America’s plastic surgery capital, with the most plastic surgeons per capita (0.220 per 10k) and the #2 spot for ‘plastic surgery’ searches.
Florida’s region, the South Atlantic, did 548,025 cosmetic surgical procedures in 2025, 36% of the US total from 20% of the population.
The Northeast is the only shrinking region for cosmetic surgery, yet its BBLs rose 38%.
Louisiana is America’s Botox capital per capita, with 0.83 listed injectors per 100k.
Washington is America’s plastic surgery search capital, at 560 monthly cosmetic surgery searches per 100k.
A Botox session costs 3x more in Massachusetts ($600 median) than in Wisconsin ($200).
Every number below sits in one of six sections. Use the list to jump straight to the number you need, or read on for the full picture.
Florida is the plastic surgery capital of the US, with the most plastic surgeons per capita and the busiest cosmetic surgery region around it. Florida earns the title on surgeon density, at 0.220 plastic surgeons per 10k11. Its South Atlantic region runs at 780.7 cosmetic surgical procedures per 100k, 5.4x the Northeast’s 144.91. Florida also ranks #2 for ‘plastic surgery’ searches5.
Florida is #1 for plastic surgeons per capita (0.220 per 10k)11 and #2 for ‘plastic surgery’ searches in 20265. It anchors the South Atlantic, the region with the highest rate (780.7 cosmetic surgical procedures per 100k)1.
Surgeon supply tends to follow search demand, and Florida’s #2 search ranking fits its #1 surgeon density. For a Florida practice, that means more rival surgeons within a short drive of every patient.
The South Atlantic has the highest cosmetic surgery rate of any region: 548,025 cosmetic surgical procedures in 2025 (36% of the US total from 20% of the population); 780.7 per 100k vs 144.9 in the Northeast, a 5.4x gap1.
The region covers nine jurisdictions: Florida, Georgia, North Carolina, South Carolina, Virginia, Maryland, Delaware, West Virginia and Washington, DC. Its procedure count grew 8% on 2024’s 506,379, so the crowding hasn’t cooled demand.
Saturation cuts both ways for practices there. Patients can compare several surgeons in one afternoon, so price, reviews and before-and-after galleries get judged side by side.
The Northeast is the only shrinking region for cosmetic surgery: 84,124 procedures (-1%); liposuction -16%, rhinoplasty -21%, but BBL +38%1.
Every other region grew 7% or 8% in the same year. Northeast liposuction fell from 15,611 to 13,122 procedures, while BBLs climbed from 724 to 996.
Demand in the Northeast is shifting procedure rather than vanishing. For a Northeast practice, the BBL line is the one to plan next year’s marketing around.
The West did 130,292 breast augmentations in 2025, 43% of the US total, according to the ASPS 2025 report1.
So if you’re asking what state has the most breast implants, start in the West. The region’s count rose 8% from 121,166 in 2024, out of 304,234 breast augmentations nationally.
Each region has a signature procedure. Breast augmentation belongs to the West, the BBL belongs to the South Atlantic, and the Northeast is drifting toward the BBL too.
Lay procedure volume, search demand, surgeon supply, injector density and price on one grid, and America’s cosmetic map looks like this.
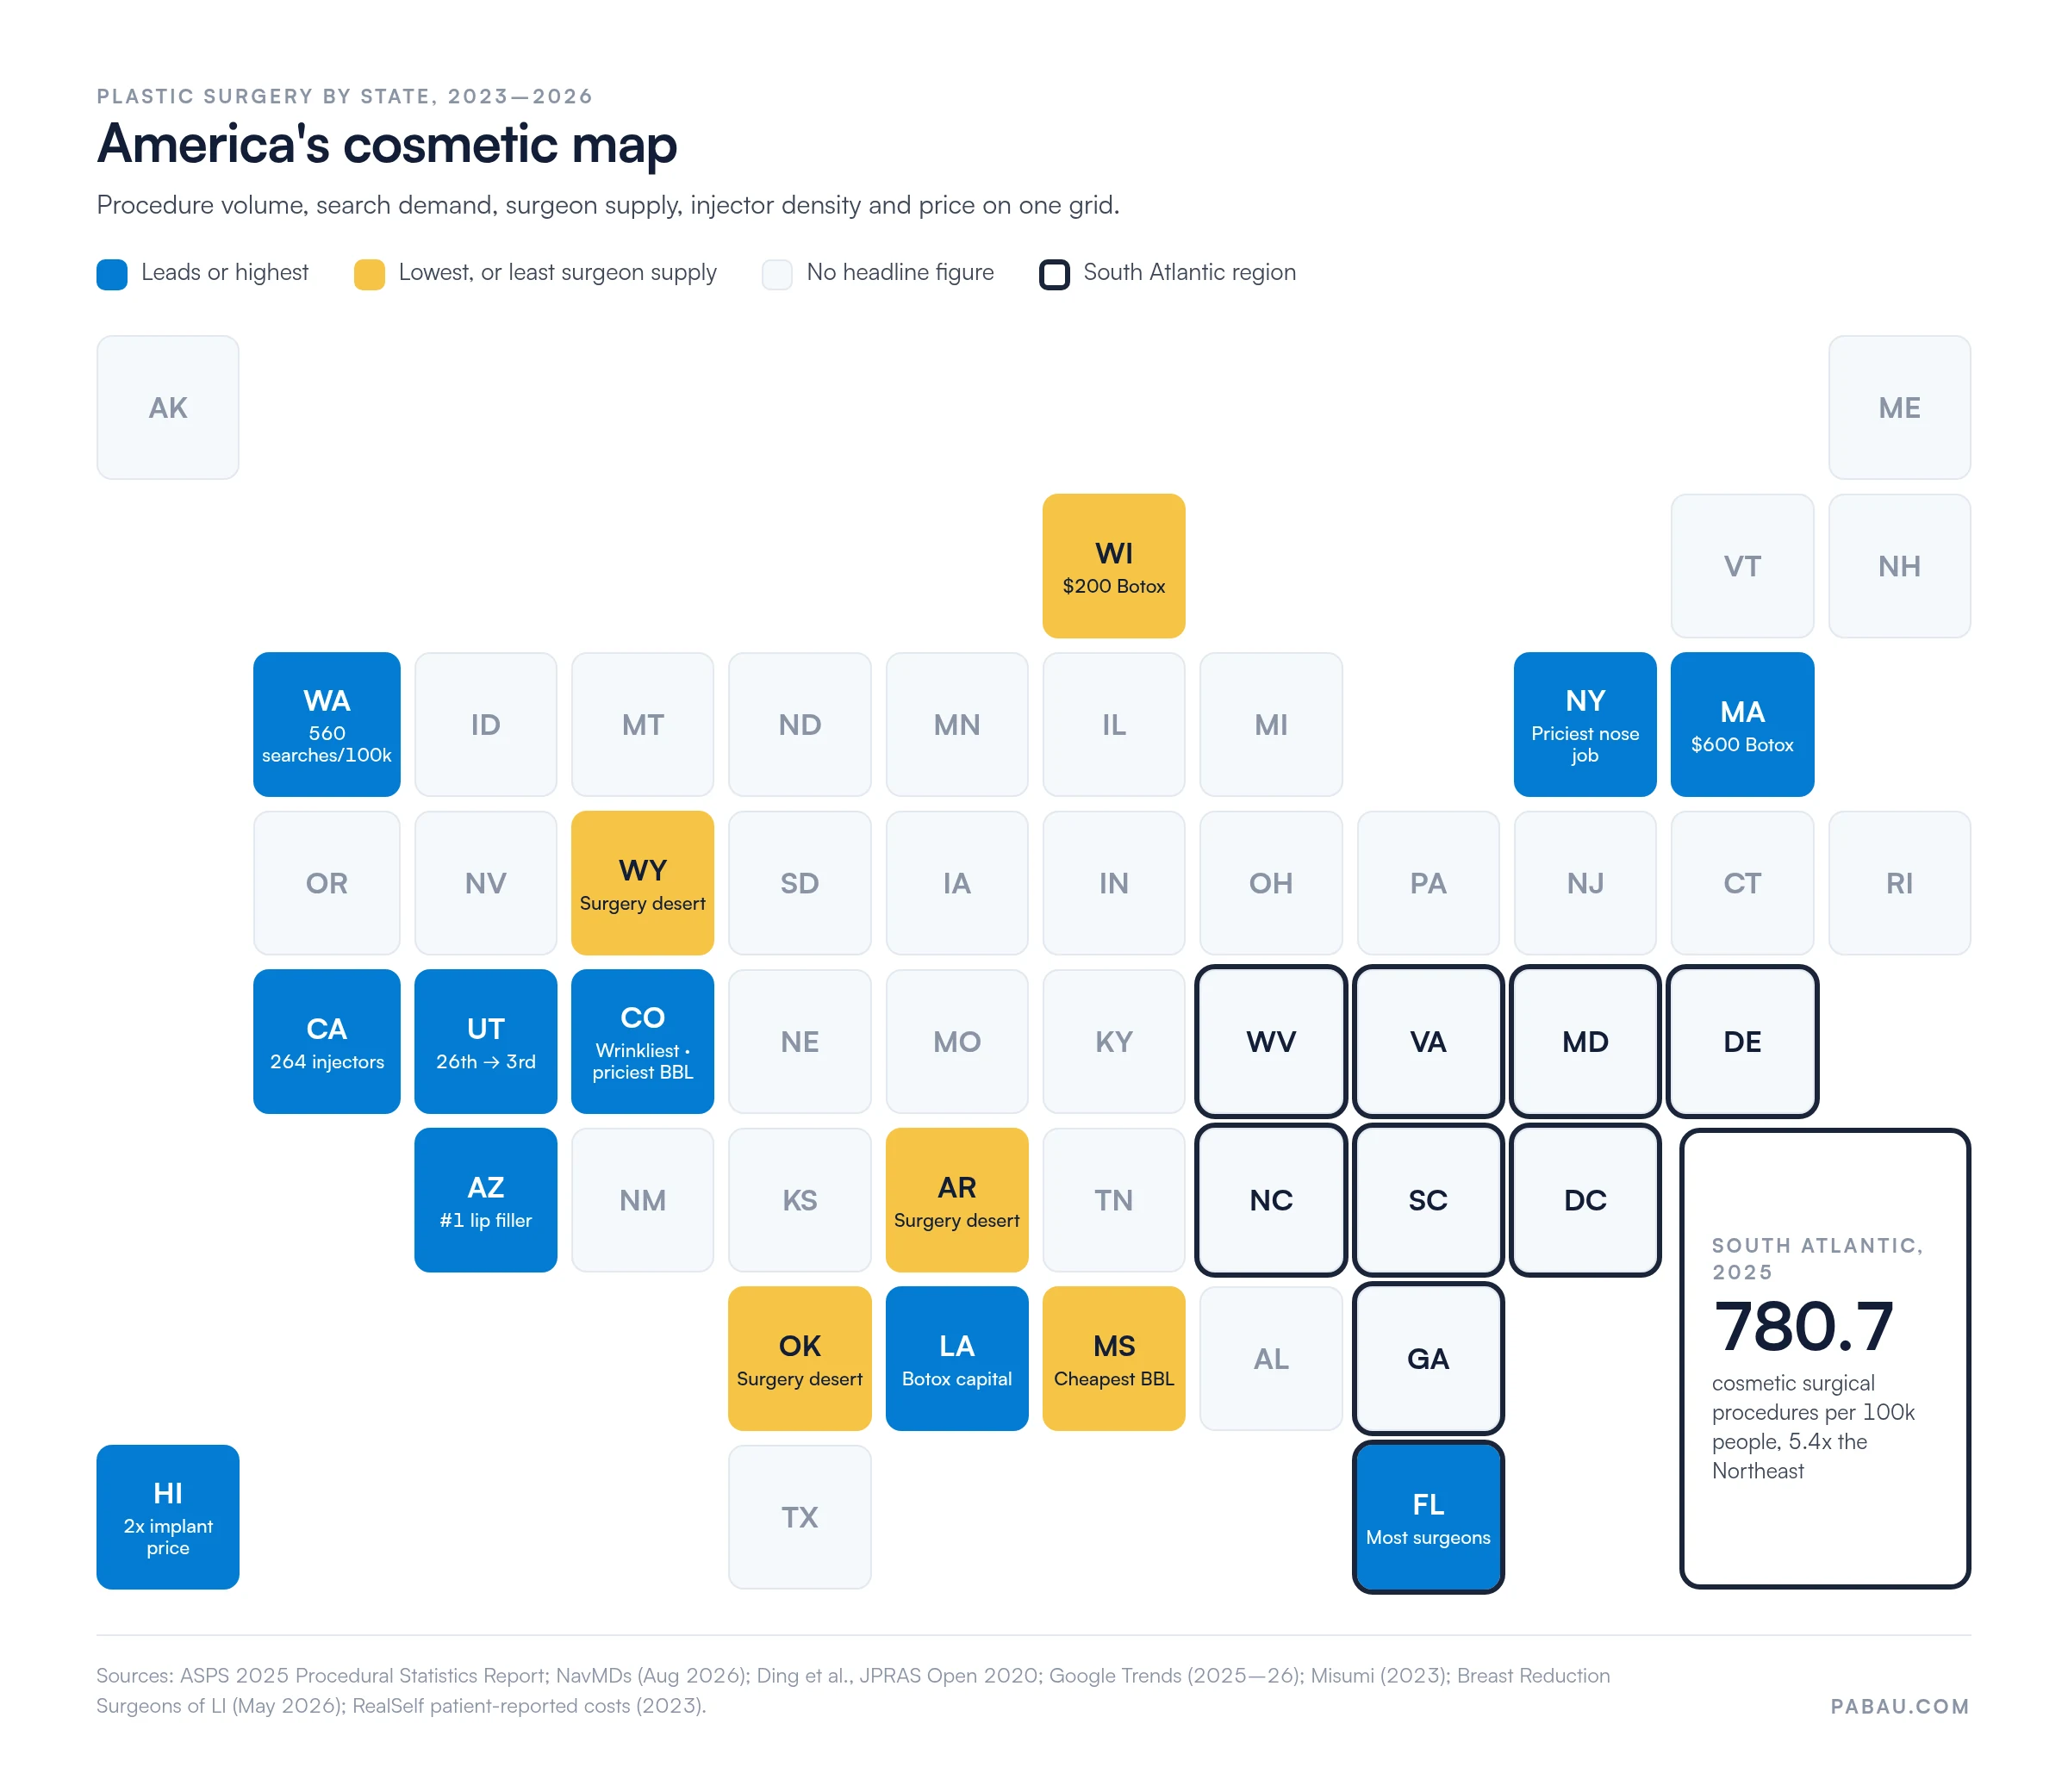
Louisiana is America’s Botox capital, with 0.83 listed Botox injectors per 100,000 residents in August 2026, the highest rate of any state.
Injector supply depends partly on who may inject, and that varies by state. Our guide to med spa laws by state covers the supervision and delegation rules behind those numbers.
Louisiana is America’s Botox capital per capita: 0.83 listed injectors per 100k, ahead of New York (0.77), DC (0.71), Hawaii (0.69) and Florida (0.68)2.
Injector density is a rough proxy for demand, because injectors tend to set up where patients already book. For a Louisiana patient, a high rate means more choice of injector within driving distance.
California has 264 listed Botox injectors, more than the bottom 30 states combined. South Dakota and Wyoming list zero2.
Raw counts and per-capita rates tell different stories. California’s total is the biggest, yet the state misses the top five on injectors per head.
In South Dakota and Wyoming, a patient searching the listings finds no injector at all. Patients there are likely to cross a state line for treatment.
Colorado is the ‘wrinkliest’ state: 312 wrinkle/anti-aging searches per 100k (52% above average) and #1 for ‘Botox near me’ searches3, yet the lowest adult obesity rate (25%)4.
Colorado searches for Botox more than any other state, at 91 searches per 100,000 people. Sun exposure and altitude may play a part.
The pattern describes a fit, outdoor population that still spends on anti-aging treatments. Colorado injectors are selling prevention to patients who already look after themselves.
The BBL is a South Atlantic procedure, lip filler searches peak in Arizona, and tummy tuck searches peak in Mississippi and Connecticut.
Each pattern follows a different driver, from regional surgeon supply to weight-loss drugs. For the national ranking behind these local peaks, see the most common cosmetic procedures.
BBL gap: South Atlantic 13,227 vs Midwest 449 in 2025, a 29:1 ratio1.
The South Atlantic did 13,227 of the 25,662 BBLs performed in the US in 2025, or 52%. Midwest BBLs fell 41% in a year, from 766 to 449.
The procedure clusters where surgeons who specialize in it already work. Midwest patients who want a BBL are likely to travel south for it.
Arizona is the #1 state for ‘lip filler’ Google searches (index 100)5 AND has the most med spas per capita (20.7 per 100k)6, while ranking 48th for GLP-1 use.
Arizona’s demand is face-first rather than weight-first. Lip filler interest, dense med spa supply and low GLP-1 use all point to patients spending on faces and skin.
‘Tummy tuck’ is the most-searched in Mississippi and Connecticut (tied index 100)5; Mississippi is also #2 for obesity and #5 for GLP-1 use.
Fast weight loss on GLP-1 drugs can leave loose skin, and a tummy tuck is the surgical fix. Mississippi’s rankings suggest body-contouring demand there will follow the weight-loss wave.
Washington is America’s plastic surgery search capital, with 560 monthly cosmetic surgery searches per 100,000 residents in May 2026.
Mississippi sits at the bottom with 50, an 11x spread between the top and bottom states. Search interest tends to run ahead of bookings, so the spread hints at where consult demand is building.
Washington is the most cosmetic-surgery-obsessed state: 560 monthly searches per 100k across 300 keywords; its #1 procedure is the BBL (7,775 searches/month). Mississippi is lowest at 50 per 100k7.
The BBL tops Washington’s searches even though the procedure is concentrated on the other side of the country. Washington patients researching a BBL may well book it in another state.
Utah jumped from 26th (2017) to 3rd (2025) for ‘plastic surgery’ searches per capita8; #1 for ‘best plastic surgeons’, #2 for ‘laser hair removal’5, 6th for med spas per capita, and the youngest state (median age 32.4).
Utah’s young population researches surgeons hard before booking, and the top spot for ‘best plastic surgeons’ shows it. For practices there, reviews and before-and-after galleries do much of the selling.
Our plastic surgery marketing strategies guide covers how to build both into your marketing.
Delaware led the 2023 ranking of cosmetic-surgery searches per capita (308 per 100k/month)9.
Delaware is small, but its interest per head topped every other state that year. Delaware also sits inside the South Atlantic, the region that leads procedure volume.
Florida led the 2023 Face Med Store ranking (1,862 searches per 100k/month)10 and in 2026 is #2 nationally for ‘botox’, ‘bbl’, ‘facelift’, ‘med spa’ and ‘plastic surgery’ searches5, #2 for med spas per capita6, and #1 for plastic surgeons per capita11.
Florida ranks first for surgeon supply and second for ‘plastic surgery’ searches, so few states match it on both. That density also makes it one of the most crowded markets to compete in.
Florida has the most plastic surgeons per capita, at 0.220 per 10,000 residents, followed by New York (0.217) and Connecticut (0.209).
Ask what state has the most plastic surgeons for its population and Florida comes out on top in 2014–15 workforce data. Wyoming sits at the other end, with roughly a quarter of Florida’s density. That surgeon lead is the strongest single measure behind Florida’s top spot.
Florida has the most plastic surgeons per capita (0.220 per 10k), then New York (0.217) and Connecticut (0.209). Wyoming has the fewest (0.051) and the highest unmet demand index11.
Surgeon supply varies more than 4x between Florida and Wyoming. A high ratio means stiff competition for each patient, and a low one means patients wait or travel.
Plastic-surgery ‘deserts’: Wyoming, Oklahoma and Arkansas have the highest ratio of search demand to surgeon supply in the US11.
Wyoming’s demand index reached 1,187.8, ahead of Oklahoma at 993.8 and Arkansas at 974.7. Patients in these states either travel for surgery or wait for it.
For a new practice or a satellite location, that unmet demand is an opening. Our guide to starting a cosmetic surgery clinic covers the setup.
Botox runs from a $200 median in Wisconsin to $600 in Massachusetts, and a BBL from $5,080 in Mississippi to $14,300 in Colorado.
The Botox medians come from August 2026 listings. The surgical prices below are patient-reported averages as of February 2023, so read them as the shape of the market rather than today’s quote.
A Botox session costs 3x more in Massachusetts ($600 median) than Wisconsin ($200). National median $4402.
Botox prices track local cost of living and how many injectors compete for each patient. Patients near a state line can cut the bill by booking across it.
Patients paid an average of $14,300 for a Brazilian butt lift in Colorado, compared with $5,080 in Mississippi and $5,833 in Florida12.
Those averages come from 4,235 patient reviews up to February 2023. BuildMyHealth reports the same pattern in 2026: $13,816 in the West and $9,294 in the South, against an $11,266 US average13.
The cheapest BBL states sit in the Southeast, where the procedure is most common. Southern practices compete on volume, while Western practices charge a premium for reputation.
Patients paid an average of $12,283 for rhinoplasty in New York, 2.3x the $5,400 average in Arkansas14.
In New York City the average reaches $15,501. Facial surgery is where big-city surgeons charge the most, so rhinoplasty is where shopping across state lines saves patients the most.
The average facelift ran to $17,651 in Washington State, against $9,400 in Kansas15.
City prices spread wider still, from $29,052 in San Francisco to $9,000 in Columbus, Ohio. A difference that size can cover flights and a recovery stay, so lower-cost states can market to out-of-state patients.
Use up and down arrow keys to resize the meta box pane.
Move upMove downShow or hide panel
Used by the Diagnostic Code post template. Leave a field blank to fall back to a value derived from the title.
| Code system badge | e.g. ICD-10-CM Code, CPT Code, HCPCS Level II Code, CCSD Code. Drives the H1 prefix and the sidebar labels |
|---|---|
| Code | e.g. L70.0 — shown before the dash in the H1 |
| Descriptor (full) | The complete official ICD-10-CM descriptor. Used in the Code Definition, not the H1 |
| Descriptor (short) | Short plain-English form shown in the H1, e.g. “Unspecified humerus shaft fracture”. Blank = falls back to the full descriptor |
| Billable code | YesShows the “Billable Code” pill. Leave unset for CPT/CCSD, where it does not apply |
| Specific code | YesShows the “Specific Code” pill |
| Code definition | The short paragraph under the “Code Definition” heading |
| H1 prefix | Words before the code in the H1. Blank = derived from the badge, e.g. “ICD code” |
| Chapter | Sidebar: e.g. L00–L99 Diseases of the skin and subcutaneous tissue |
| Category | Sidebar: e.g. L70 Acne |
| Group | Sidebar: e.g. L70.0 Acne vulgaris |
| Sidebar label 1 | Override the first sidebar row label. Blank = derived from the code system (ICD: Chapter, CPT: Section, HCPCS: Level, CCSD: Group) |
| Sidebar label 2 | Blank = Category (Subsection for CPT) |
| Sidebar label 3 | Blank = Group (Code range for CPT/HCPCS, Subcategory for CCSD) |
| Code also known as | Sidebar: synonyms, comma separated |
Move upMove downShow or hide panel
Optimize your content for discovery or get new content suggestions.Get content suggestions
Focus keyphrase
Use the main word or phrase you want your content found for across search, AI, and beyond. Learn more about best practices for keyphrases.(Opens in a new browser tab)Keyphrase synonyms
Add synonyms of your focus keyphrase to reduce repetition of your focus keyphrase. Read more about synonyms.(Opens in a new browser tab)
Determine how your post should look in the search results.Google preview
MobileGoogle preview: Switch to desktop preview. Currently showing mobile preview.
Desktop
Url preview:

Pabaupabau.com
SEO title preview:
What state has the most plastic surgery per capita? (2026)
Meta description preview:
Oct 15, 2026 - What state has the most plastic surgery per capita? Florida, with the most surgeons per capita. Washington leads plastic surgery searches.
SEO titleInsert variableGenerate SEO title
What state has the most plastic surgery per capita? (2026)
Slug
Meta descriptionInsert variableGenerate meta description
What state has the most plastic surgery per capita? Florida, with the most surgeons per capita. Washington leads plastic surgery searches.
Move upMove downShow or hide panelOutbound (48)Inbound (0)
Showing 0 suggestionsExport support data
Filters0Regenerate suggestions
| Sentence to create link in accept to add the linkOnline booking captures the patient comparing surgeons at 11 PM, so the consult lands in your calendar before they call anyone elseEdit sentence | Post to link to 10 optionsTitle:7 Best Fresha alternatives for salons and med spas (2026)Match score:Strong (75%)URL:/fresha-alternativesLink1 of 1010post options |
| Sentence to create link in accept to add the linkDigital consent forms and before-and-after photos sit in one patient record, so the surgeon opens one file before the procedureEdit sentence | Post to link to 10 optionsTitle:LASER HAIR REMOVAL INFORMED CONSENTMatch score:Strong (76%)URL:/laser-hair-removal-informed-consentLink1 of 1010post options |
| Sentence to create link in accept to add the linkFast weight loss on GLP-1 drugs can leave loose skin, and a tummy tuck is the surgical fixEdit sentence | Post to link to 10 optionsTitle:Intermittent fasting diet planMatch score:Strong (75%)URL:/intermittent-fasting-diet-planLink1 of 1010post options |
| Sentence to create link in accept to add the linkFlorida is the plastic surgery capital of the US, with the most plastic surgeons per capita and the busiest cosmetic surgery region around itEdit sentence | Post to link to 10 optionsTitle:Hip augmentation consent form templateMatch score:Strong (67%)URL:/hip-augmentationLink1 of 1010post options |
| Sentence to create link in accept to add the linkSocial Media’s Most Popular Cosmetic Procedures in the U.S. Ranked by StateEdit sentence | Post to link to 8 optionsTitle:Dermatology practice marketing: A complete growth guideMatch score:Strong (67%)URL:/dermatology-practice-marketingLink1 of 88post options |
Export Support DataExport Links to ExcelSelect allLink Selected (0)Link all strong
Move upMove downShow or hide panel
Update Existing Keywords
Move upMove downShow or hide panelPostBlock
Introduce new sections and organize content to help visitors (and search engines) understand the structure of your content.
Generate with Elementor AITransform to variation
Color
Font sizeFont size
Color
Gradient
All options are currently hidden
All options are currently hidden
All options are currently hidden
All options are currently hidden
Skip to the selected block
What state has the most plastic surgery per capita? America’s cosmetic map in 20 numbers↗ is now live.
What’s next?Post addressCopy
View Post(opens in a new tab)Add Post
Share your post!
Always show pre-publish checks.
Patients paid an average of $8,328 for breast implants in Hawaii and $8,136 in Connecticut, about double the $4,062 average in Alabama16.
US surgeons did 304,234 breast augmentations in 2025, so a 2x state difference touches a lot of patients. The spread also makes an all-in price quote a strong selling point for practices.
These plastic surgery statistics by state put all 20 numbers in one table. Use it to compare plastic surgery per capita by state across every metric.
| State or region | Headline fact | Figure | Source |
|---|---|---|---|
| Florida | America’s plastic surgery capital | Most plastic surgeons per capita (0.220 per 10k) | Blau et al.11 |
| South Atlantic | Highest cosmetic surgery rate of any region | 780.7 procedures per 100k (2025) | ASPS1 |
| Northeast | Only shrinking region, but BBLs rose | 84,124 procedures (-1%), BBL +38% | ASPS1 |
| West | Breast augmentation leader | 130,292 (43% of US) | ASPS1 |
| Louisiana | Botox capital per capita | 0.83 listed injectors per 100k | NavMDs2 |
| California | Most listed Botox injectors | 264 injectors | NavMDs2 |
| Colorado | The ‘wrinkliest’ state | 312 anti-aging searches per 100k | Misumi3 |
| South Atlantic vs Midwest | BBL concentration | 13,227 vs 449 (29:1) | ASPS1 |
| Arizona | #1 for ‘lip filler’ searches | Index 100; 20.7 med spas per 100k | Google Trends5 |
| Mississippi and Connecticut | #1 for ‘tummy tuck’ searches | Index 100 (tied) | Google Trends5 |
| Washington | Plastic surgery search capital | 560 per 100k per month | Breast Reduction Surgeons of LI7 |
| Utah | Biggest climber for ‘plastic surgery’ searches | 26th to 3rd | Salt Lake Tribune8 |
| Delaware | Led a 2023 search ranking | 308 searches per 100k per month | med.ro9 |
| Florida | Led a 2023 search ranking | 1,862 searches per 100k per month | Face Med Store10 |
| Wyoming, Oklahoma, Arkansas | Plastic-surgery deserts | Highest demand-to-supply ratio | Blau et al.11 |
| Massachusetts vs Wisconsin | Botox price per session | $600 vs $200 median | NavMDs2 |
| Colorado vs Mississippi | BBL price | $14,300 vs $5,080 | RealSelf12 |
| New York vs Arkansas | Rhinoplasty price | $12,283 vs $5,400 | RealSelf14 |
| Washington vs Kansas | Facelift price | $17,651 vs $9,400 | RealSelf15 |
| Hawaii vs Alabama | Breast implant price | $8,328 vs $4,062 | RealSelf16 |
Demand differs by state, but every busy practice has the same job. Search interest has to become a booked, kept consult before a competitor answers first.
Pabau, the all-in-one practice management system we build for aesthetic and surgical practices, handles that path from search to surgery:
In the surgical practices we onboard, consult deposits are usually among the first settings switched on. The same platform runs as medical spa software for injector-led practices and as a plastic surgery EMR for surgical teams.

Pabau’s online booking, consult deposits and digital consent forms help cosmetic practices turn high local search demand into kept appointments. Recall reminders bring Botox patients back on schedule.

Geography decides what patients ask for, what they pay and how far they travel. In the South Atlantic, patients can compare many surgeons in an afternoon, so experience and reviews decide who gets the booking.
Wyoming, Oklahoma and Arkansas sit at the opposite end. Demand outruns surgeon supply there, and the first practice to open close to those patients collects the consults that now leave the state.
Find your own state’s row in the table before you set prices or plan next year’s marketing. Then Book a demo to see how Pabau turns local search demand into booked, deposit-backed consults.

Getting the inquiries but not the surgeries? Converting consultations into surgical bookings walks through turning a consult into a scheduled procedure.
Need a consent form for cosmetic procedures? Cosmetic surgery consent form gives you a ready-made template to adapt for your practice.
Florida is America’s plastic surgery capital, with the most plastic surgeons per capita (0.220 per 10k). No source counts procedures by state, but Florida’s South Atlantic region leads with 780.7 cosmetic surgical procedures per 100k in 2025.
Florida is the plastic surgery capital of the US, with the most plastic surgeons per capita and #2 for ‘plastic surgery’ searches. Its South Atlantic region did 548,025 cosmetic surgical procedures in 2025, 36% of the US total.
Florida, judged on surgeon supply and search demand. Procedures are only counted by region, and Florida’s South Atlantic region leads on volume. The West did 43% of US breast augmentations (130,292) in 2025.
Washington, America’s plastic surgery search capital, at 560 monthly cosmetic surgery searches per 100k people. Mississippi is lowest at 50.
Louisiana, with 0.83 listed Botox injectors per 100k, ahead of New York (0.77).
Wyoming, Oklahoma and Arkansas have the highest ratio of search demand to surgeon supply. Wyoming has 0.051 surgeons per 10k.