GLP-1 diet plan
A GLP-1 diet plan is a structured eating framework for patients taking semagluti...

2
Last Updated: Oct 13, 2026

The stroke volume equation is SV = EDV – ESV, where EDV is end-diastolic volume and ESV is end-systolic volume, both in milliliters.
Normal adult stroke volume at rest is 60 to 100 mL per beat. Stroke volume index normalizes that for body size, at 33 to 47 mL/m².
Three determinants govern stroke volume: preload, afterload, and contractility. Each one answers to a different intervention.
A low stroke volume with a normal EDV points to afterload or contractility. A low stroke volume with a low EDV points to preload.
Practice management software like Pabau stores serial hemodynamic readings against the client record, so a falling stroke volume shows up as a trend.
Stroke volume is the blood the left ventricle ejects in a single contraction, and the equation for it is SV = EDV – ESV. In a healthy adult at rest, that comes to roughly 70 mL per beat.
The same subtraction sits underneath cardiac output, goal-directed fluid therapy, and every echocardiographic report a clinician reads. This guide covers the formula, a worked calculation, the three determinants, and the normal reference values. It then works through the measurement methods and the point where stroke volume and ejection fraction stop agreeing.
The stroke volume equation is expressed as SV = EDV – ESV. Stroke volume (SV) is the blood ejected from the left ventricle in a single contraction, measured in milliliters.
End-diastolic volume (EDV) is the volume in the left ventricle immediately before contraction, once the chamber has filled. End-systolic volume (ESV) is the residual volume left behind after contraction is complete.
Subtract one from the other and you have the blood that left the ventricle on that beat. StatPearls sets this out as the standard formula in cardiovascular physiology.
The equation also runs in reverse. Where a monitor reports cardiac output instead of chamber volumes, SV = CO / HR returns the same figure. Thermodilution and pulse contour systems work this way, which is why an ICU chart can show a stroke volume without ever showing an EDV.
Applying the equation is straightforward once EDV and ESV are known. Here is a worked example using values typical of an adult at rest.
The difficulty in practice is obtaining accurate EDV and ESV, not the arithmetic. Echocardiography is the standard non-invasive route, and the measurement methods below cover what each one can and cannot give you.
Cardiac output (CO) equals stroke volume multiplied by heart rate: CO = SV x HR. The stroke volume equation is therefore the first step in any cardiac output calculation. A resting adult with a stroke volume of 70 mL and a heart rate of 70 bpm generates about 4.9 L/min.
The cardiac output formula works through that second multiplication in full. What matters at the bedside is how the two variables cover for each other. When stroke volume falls, in heart failure or hypovolemia, heart rate rises to hold cardiac output up.
Clinicians in the ICU and the perioperative setting use that relationship to guide fluid resuscitation and inotropic support. A climbing heart rate on a stable cardiac output is often the first sign that stroke volume is dropping.
Three physiological variables govern how much blood the ventricle ejects per beat. They explain why the equation returns the number it does in a given patient.
Preload is the degree of myocardial stretch at end-diastole, and it tracks directly with EDV. More filling stretches the myocardial fibers further, which raises the force of the next contraction and lifts stroke volume. That is the Frank-Starling mechanism: within limits, the heart ejects more when it receives more.
Fluid loading raises preload, and diuresis or venodilation lowers it. In heart failure with a dilated, poorly contractile ventricle, the Frank-Starling curve flattens. Extra preload then stops producing a proportional rise in stroke volume, so knowing where the patient sits on that curve drives fluid management.
Afterload is the resistance the left ventricle has to overcome to eject blood into the aorta. It runs inversely to stroke volume, so higher afterload means less volume ejected per beat. Systemic vascular resistance (SVR) is the usual clinical proxy for it.
Hypertension and aortic stenosis both raise afterload chronically, making the ventricle work harder for the same output. Vasodilators used in heart failure, such as ACE inhibitors and nitrates, cut afterload and raise stroke volume. Neither preload nor contractility has to change for that to work.
Contractility, or inotropy, is the inherent ability of myocardial cells to generate force. It is independent of preload and afterload, and it reflects calcium cycling inside the cardiomyocytes. Higher contractility shifts the Frank-Starling curve upward, so the ventricle ejects more at any given EDV.
Inotropic agents such as dobutamine, milrinone and digoxin raise contractility pharmacologically. Myocardial ischemia, cardiomyopathy and beta-blocker toxicity lower it. Ejection fraction is the surrogate most often reported when the full stroke volume equation is not to hand.
The three determinants are also a triage order. When the equation returns a low number, the EDV sitting beside it narrows the cause before any drug gets chosen.
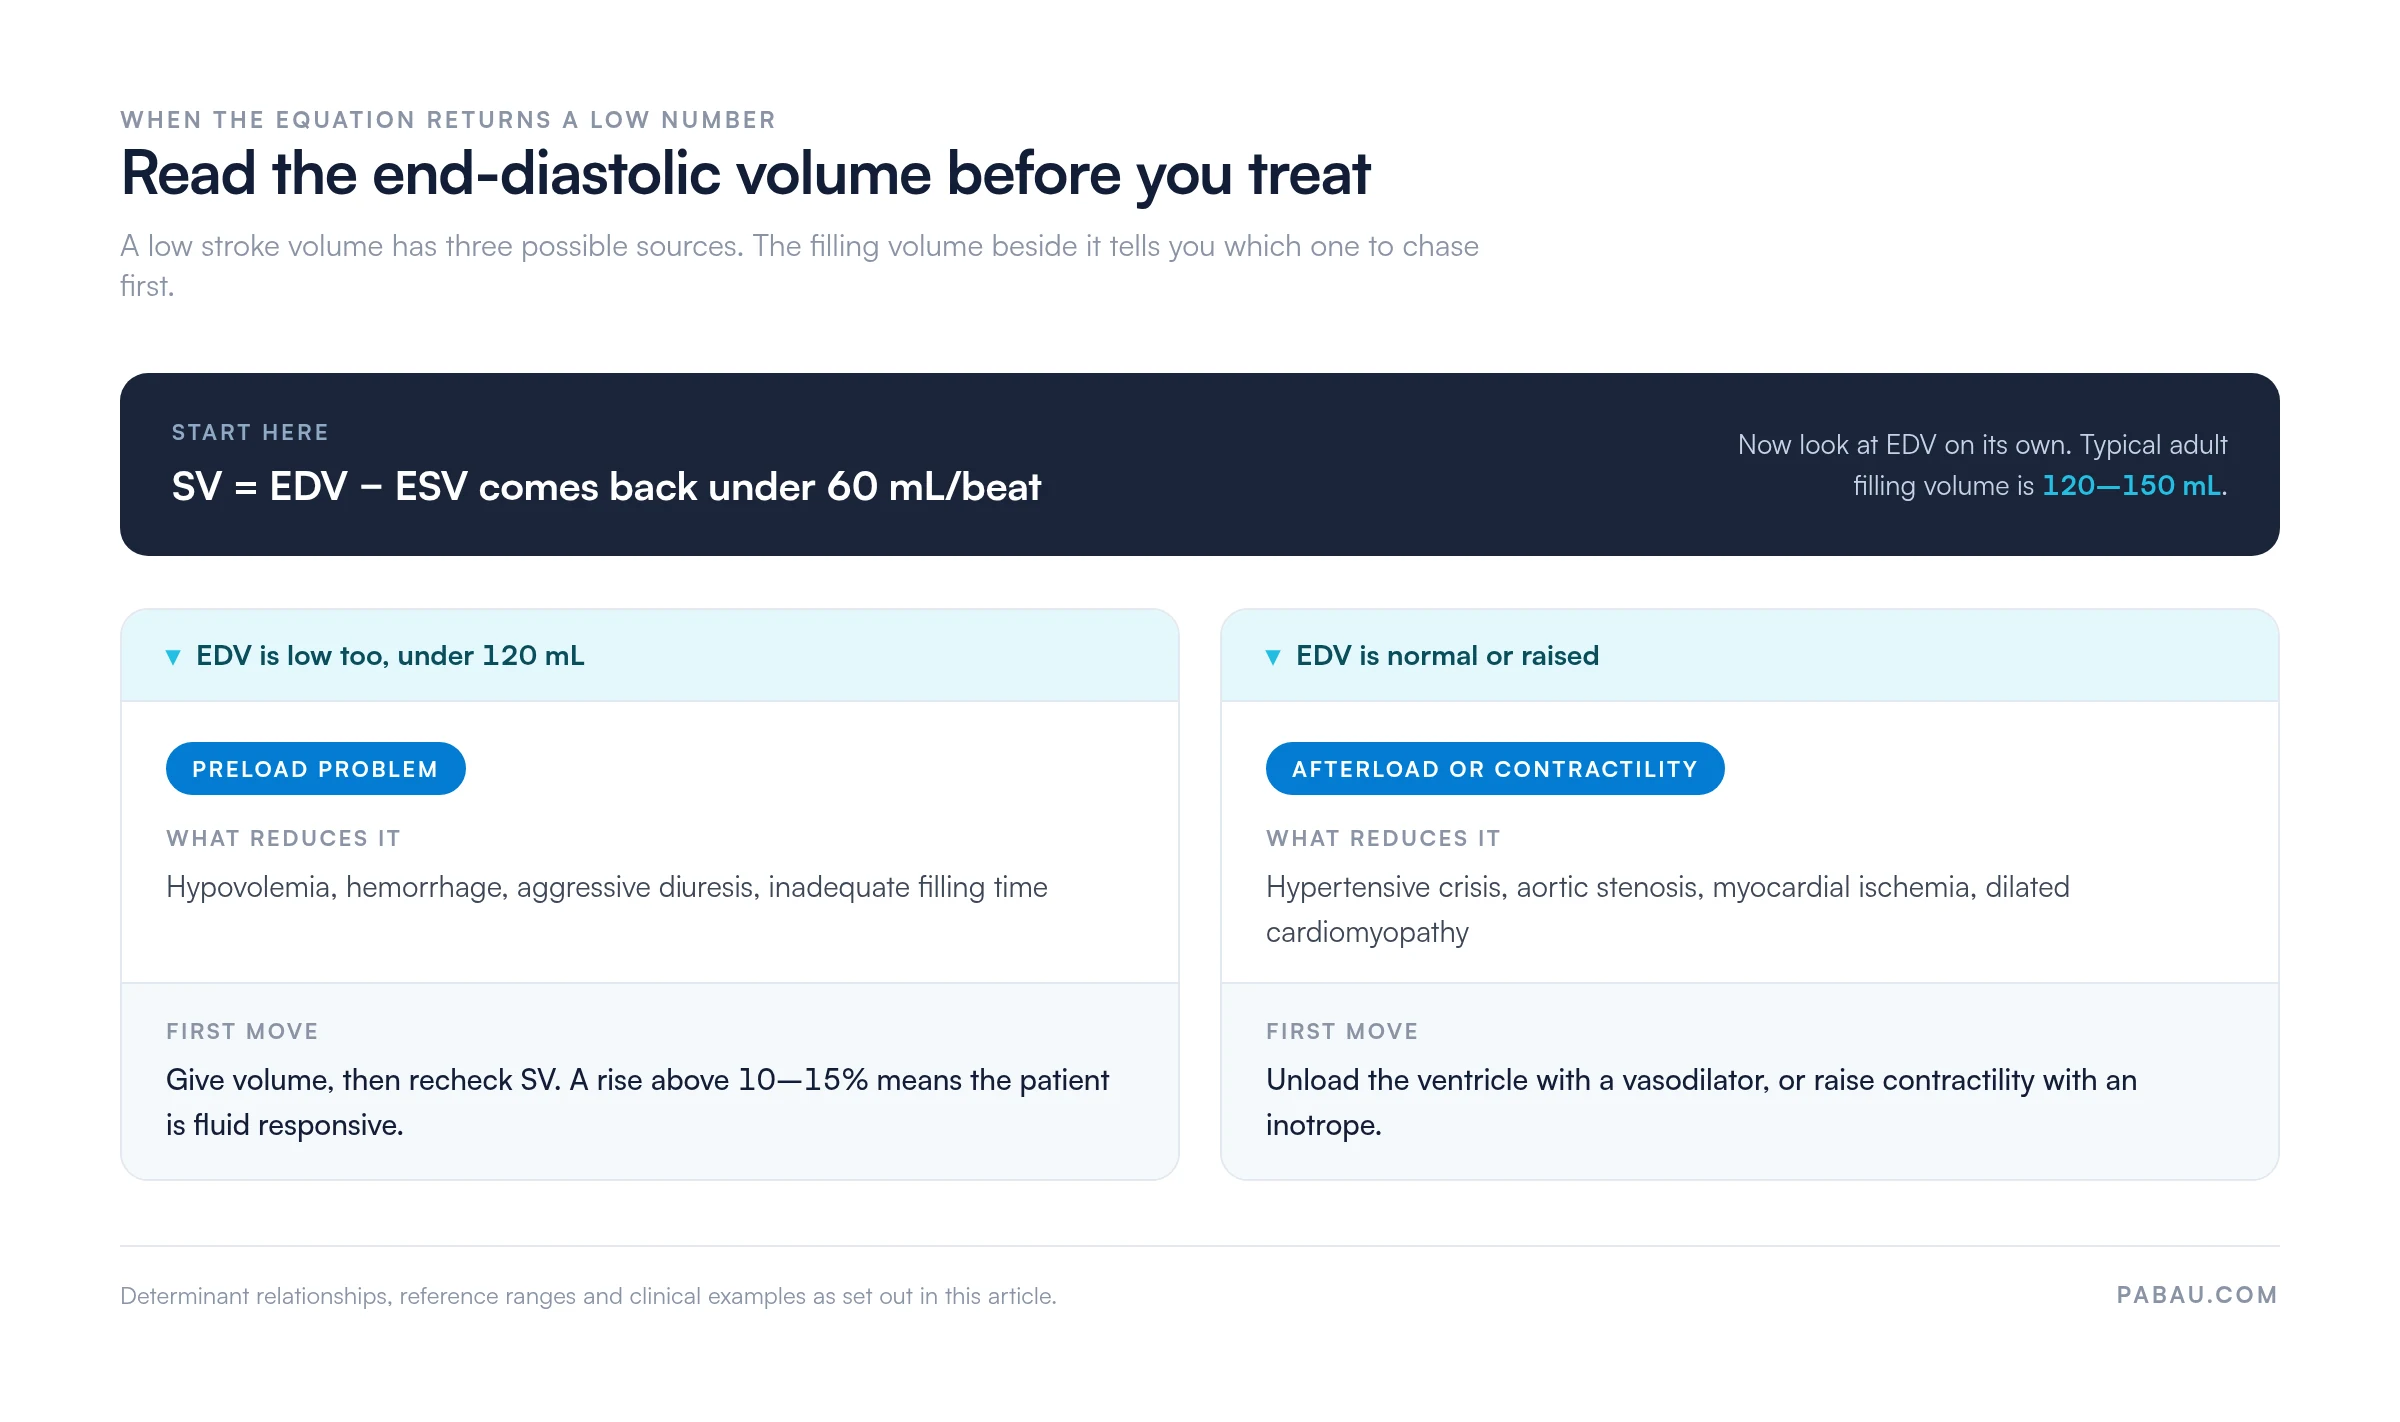
Record EDV and ESV in the note, not just the derived stroke volume. Two months later, the stored EDV is what tells you whether a falling stroke volume came from filling or from the ventricle itself.
Raw stroke volume ignores patient size. A 70 mL stroke volume means something different in a 50 kg patient than in a 110 kg athlete. Stroke volume index (SVI) corrects for that by dividing SV by body surface area (BSA): SVI = SV / BSA.
Normal adult SVI is roughly 33 to 47 mL/m². It earns its place in pediatric hemodynamic monitoring, where adult reference ranges do not apply, and in perioperative goal-directed therapy. Indexed values are standard output on advanced hemodynamic monitors and in echocardiographic reports.
Calculating stroke volume from the equation needs EDV and ESV. Two broad routes get you there: non-invasive imaging and invasive hemodynamic monitoring.
Setting, equipment and patient acuity decide the method. Echocardiography covers most outpatient and inpatient assessments, and an echocardiogram test returns both chamber volumes from a single study. Invasive monitoring stays with the critically ill.
Where those volumes get written up by hand, an echocardiography report template keeps the fields consistent. EDV, ESV and the derived value land in the same place on every study, which is what makes two studies six months apart comparable.
Stroke volume and ejection fraction (EF) describe the same beat from two angles. One is an absolute volume, the other a proportion, and they can disagree.
Ejection fraction is calculated as EF = (SV / EDV) x 100. It expresses stroke volume as a percentage of end-diastolic volume. Take an EDV of 130 mL and an SV of 75 mL. That gives an EF of 57.7%, inside the normal range of 55 to 70%.
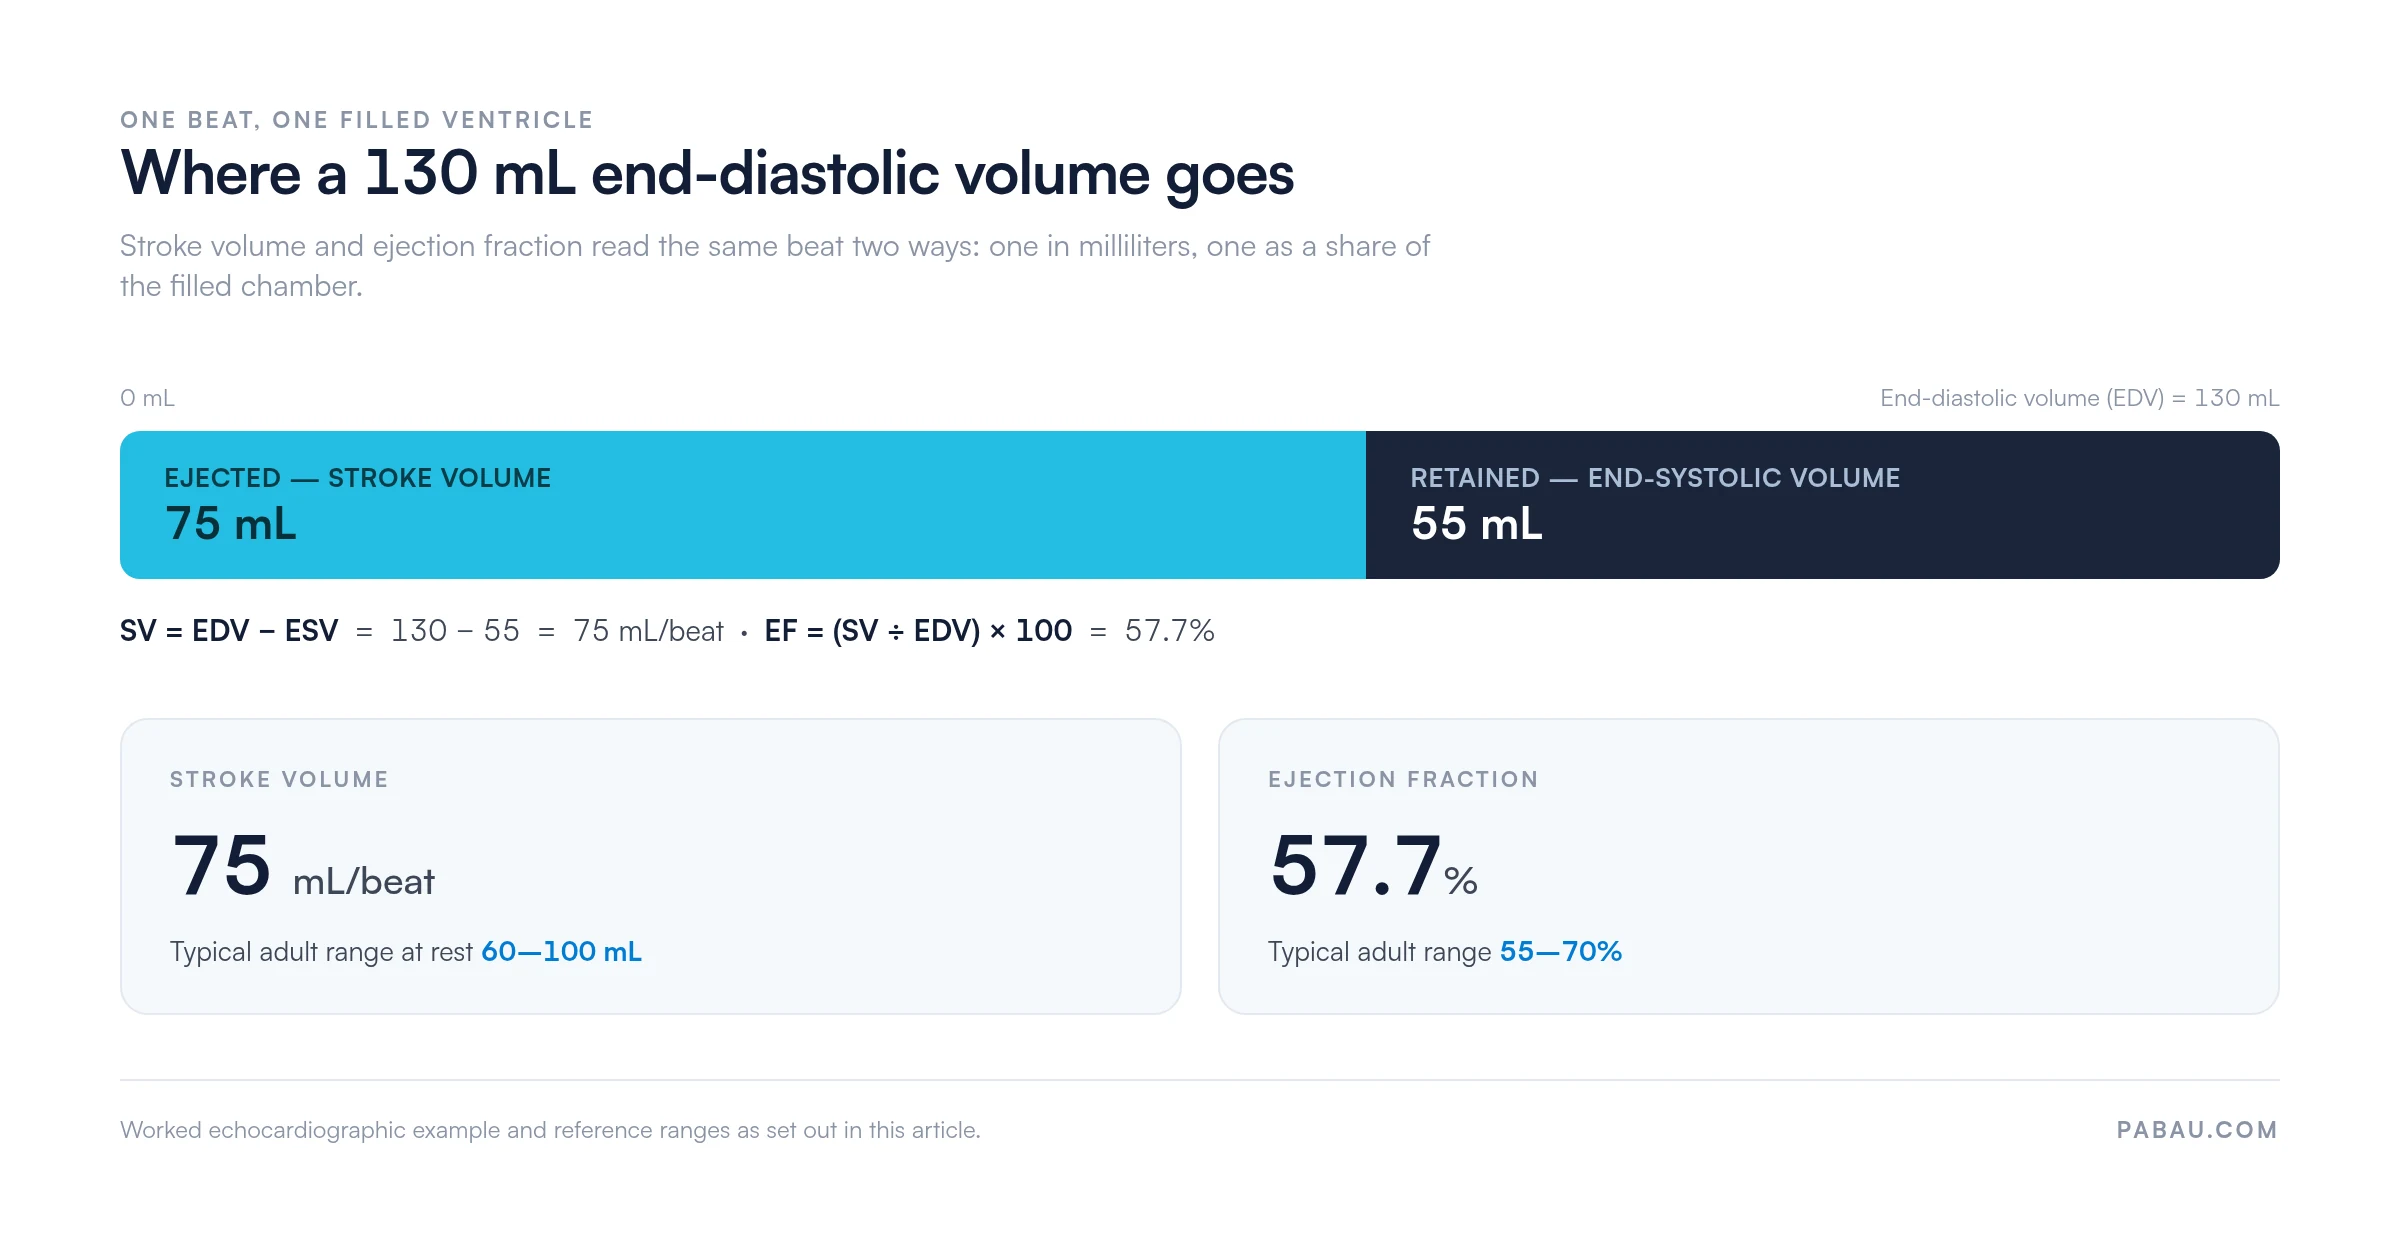
A patient can hold a normal EF and still move an inadequate stroke volume, if the ventricle is small and EDV is low. A dilated ventricle with a poor EF can do the opposite. Its large filling volume still yields an acceptable absolute stroke volume.
That is why echocardiographic reports carry both numbers rather than either one. In heart failure with preserved ejection fraction (HFpEF), reading the pair together is the whole point.
The stroke volume equation is not a physiology-exam curiosity. It sits under several decisions made at the bedside.
Across all four, the equation, its indexed form and the cardiac output relationship carry decisions that change outcomes. Capturing a baseline at first presentation is what makes the next reading mean anything. Digital intake forms that record hemodynamic parameters up front give practitioners that reference point.

Hemodynamic data is only as useful as the record that holds it. Today, most cardiac assessment findings land in a free-text note, which means the next practitioner has to read three visits to see a trend.
Primary care and cardiology teams running GP practice software can structure that assessment note in one place instead. Values outside the reference range get flagged, and the follow-up is scheduled from criteria you set once.
Practice management software like Pabau is built for multi-practitioner practices, where continuity depends on records being searchable rather than buried in free text. Its measurements tracking stores each stroke volume, EDV and ESV as a dated value against the client record.
The outcome is a trend you can read at a glance. When stroke volume drifts down across three visits, the practitioner sees the slope rather than hunting through three sets of notes.
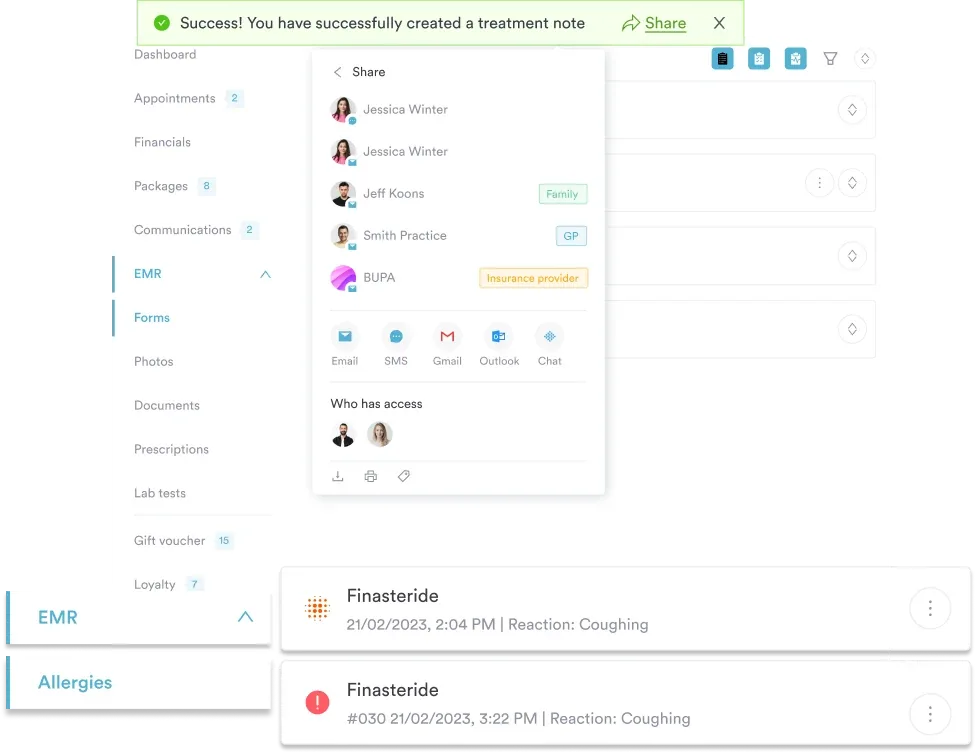

Pabau structures cardiac assessment notes, stores serial stroke volume readings against the client record, and schedules the follow-up. Your team reads the trend instead of rebuilding it from paper.

SV = EDV – ESV is arithmetic anyone can do in their head. The judgment is in reading the two inputs separately. EDV and ESV together tell you which determinant moved, and which intervention will move it back.
So record both, not just the difference, and index the result when you are comparing patients of different sizes. A stroke volume with no EDV beside it is a number you cannot act on six months later.
For practices tracking cardiac assessments across visits, that record is the whole exercise. Book a demo to see how Pabau keeps serial hemodynamic readings, notes and follow-up in one client record.

Need the second half of the calculation? Cardiac output formula works through CO = HR x SV and the normal 4 to 8 L/min range.
Working from oxygen consumption instead of chamber volumes? Fick cardiac output calculator covers the indirect route and where its assumptions break down.
Not sure what the study itself involves? Echocardiogram test explains what to expect and how to read the results.
Writing the study up? Echocardiography report template keeps chamber volumes and derived values in consistent fields.
Managing a patient whose stroke volume keeps falling? Congestive heart failure nursing care plan sets out the monitoring and intervention steps.
The stroke volume equation is SV = EDV – ESV. SV is stroke volume in mL per beat, EDV is end-diastolic volume, and ESV is end-systolic volume. EDV is the blood in the left ventricle before contraction, and ESV is what remains after it. The difference is the blood ejected per heartbeat.
Subtract end-systolic volume from end-diastolic volume: SV = EDV – ESV. For example, if EDV = 130 mL and ESV = 55 mL, then SV = 75 mL/beat. EDV and ESV are typically obtained via echocardiography in clinical settings.
Normal adult stroke volume at rest is approximately 60-100 mL per beat, with a typical value around 70 mL. Values vary by age, sex, fitness level, and hemodynamic state. Trained endurance athletes may rest above 100 mL, from physiological cardiac adaptation.
Cardiac output equals stroke volume multiplied by heart rate, written as CO = SV x HR. At 70 mL and 70 bpm, that produces roughly 4.9 L/min of cardiac output. Normal adults run 4 to 8 L/min, and heart rate rises to compensate when stroke volume falls.
Stroke volume index (SVI) normalizes stroke volume for body surface area: SVI = SV / BSA. The normal adult SVI range is approximately 33-47 mL/m². It beats raw stroke volume for comparing patients of different body sizes. It is also standard in pediatric hemodynamic monitoring and perioperative goal-directed therapy.